Virginia Commonwealth University
VCU Scholars Compass
Theses and Dissertations Graduate School
2012
Electroencephalography (EEG)-based brain
computer interfaces for rehabilitation
Dandan Huang
Virginia Commonwealth University
Follow this and additional works at:http://scholarscompass.vcu.edu/etd Part of theBiomedical Engineering and Bioengineering Commons © The Author
This Dissertation is brought to you for free and open access by the Graduate School at VCU Scholars Compass. It has been accepted for inclusion in Theses and Dissertations by an authorized administrator of VCU Scholars Compass. For more information, please contactlibcompass@vcu.edu. Downloaded from
School of Engineering
Virginia Commonwealth University
This is to certify that the dissertation prepared by Dandan Huang entitled “Electroencephalography (EEG)-based brain computer interfaces for rehabilitation” has been approved by her committee as satisfactory completion of the dissertation requirement for the degree of Doctoral of Philosophy.
Ou Bai, Ph.D., Director of Dissertation, School of Engineering
Ding-Yu Fei, Ph.D., School of Engineering
Azhar Rafiq, M.D., School of Medicine
Martin L. Lenhardt, Ph.D., School of Engineering
Kayvan Najarian, Ph.D., School of Engineering
Gerald Miller, Ph.D., Chair, Department of Biomedical Engineering, School of Engineering
Rosalyn Hobson, Ph.D., Associate Dean of Graduate Studies, School of Engineering
Charles J. Jennett, Ph.D., Dean, School of Engineering
F. Douglas Boudinot, Ph.D., Dean of the Graduate School
______________________________________________________________________ Date
© Dandan Huang 2012 All Rights Reserved
ELECTROENCEPHALOGRAPHY-BASED BRAIN-COMPUTER INTERFACES FOR REHABILITATION
A dissertation submitted in partial fulfillment of the requirements for the degree of Doctor of Philosophy at Virginia Commonwealth University.
By
DANDAN HUANG
M.S., Virginia Commonwealth University, 2009 B.S., Tianjin University, People’s Republic of China, 2007
Director: Ou Bai, PH.D.
Assistant Professor, Department of Biomedical Engineering
Virginia Commonwealth University Richmond, Virginia
i
Acknowledgments
I would like to express my gratitude to all the people who have given their heart whelming full support in making this project a magnificent experience. My foremost thank goes to my Ph.D. adviser Dr. Ou Bai. Without him, this dissertation would not have been successful. I thank him for his patience and support that carried me on through difficulties, and for his knowledge, insights and creativity that inspired me to explore and challenge the unknown.
I am very grateful to Dr. Ding-Yu Fei, who encouraged and supported me throughout these years when I’m in VCU. I always enjoy so much from the discussion with him about research and life. I also would like to thank Ms. Cai-Ting Fu, my colleagues at the EEG&BCI Lab, and my collaborators at Huazhong University of Science and Technology for their great help, and I really enjoyed the time we spent together.
I would like to acknowledge and thank the members of my dissertation committee, Dr. Azhar Rafiq, Dr. Martin L. Lenhardt and Dr. Kavyan Najarian for kindly consenting to serve on my graduate committee and for reviewing and advising on this dissertation.
ii
Special thanks are given to my parents for their unconditional love, support and encouragement throughout my studies.
iii
Table of Contents
Page
Acknowledgments ... i
List of Abbreviations ...vi
List of Figures ... x
List of Tables... xiii
Abstract... 1
CHAPTER 1 Introduction & Literature review ... 4
1.1 Background...4
1.2 Brain-computer interface technology ...5
1.3 Brain signal detection methods ...7
1.4 Challenges of EEG-based BCIs ...8
1.5 Relevant studies by other groups ...9
1.6 Preliminary studies by our group ...10
1.7 Aims of the doctoral study...12
CHAPTER 2 2D virtual wheelchair control ... 15
2.1 Experimental system ...15
iv
2.2 Subject selection...17
2.2.1 General subject Inclusion criteria ...17
2.2.2 Subject exclusion criteria ...17
2.2.3 Potential risks ...18
2.3 Experimental paradigm ...19
2.3.1 Online wheelchair control paradigm ...19
2.3.2 Wheelchair control strategy ...20
2.4 Experiment procedure and Signal processing for decoding movement intention....24
2.4.1 Spatiotemporal filtering and feature selection ...24
2.4.2 Two-step modeling/classification ...28
2.5 Experimental results...30
2.6 Discussion ...39
CHAPTER 3 Exploration of classification methods ... 43
3.1 Software and toolbox for classification exploration ...43
3.2 EEG signals to be classified ...43
3.3 Exploration of classification methods...46
3.3.1 One-vs-All logistic regression ...46
3.3.2 Support vector machine classifier ...51
v
3.3.4 Effect of Principle Component Analysis ...69
3.3.5 Recommendation on classifier selection ...72
CHAPTER 4 SSVEP for Hybrid BCI system ... 74
4.1 Background and significance ...74
4.2 Experimental design of SSVEP paradigm ...76
4.3 Data analysis...78
CHAPTER 5 Summary and future work ... 83
5.1 Contributions and future work ...83
5.1.1 Practical design of 2D wheelchair control ...83
5.1.2 Exploration of pattern recognition methods...85
5.1.3 SSVEP system for the hybrid BCI...87
Literature Cited ... 88
vi
List of Abbreviations
ALS Amyotrophic lateral sclerosis
ADL Activities of daily living
AVONA One-way analysis of variance
BCI Brain-computer Interface
Bpm Bits per minute
CNS Central nervous system
CCA Canonical correlation analysis
ERD Event-related desynchronization
ERS Event-related synchronization
EEG Electroencephalography
ECoG Electrocorticography
vii
EOG Electrooculography
ERP Event-related potential
FP False positive
FPR False positive rate
FNR False negative rate and true negative
fMRI Functional magnetic resonance imaging
fNIR Functional near-infrared imaging
GA Genetic algorithmeature
GA-MLD GA-based Mahalanobis Linear Distance Classifier
GS Go/Stop
ITR Information transfer rate
IC Intentional control
ID Idle
viii
LFP Local field potentials
MEG Magnetoencephalography
MLD Mahalanobis linear distance
MLP Multilayer perceptron
NC Non-control
OVA One-vs-all classifier
PCA Principle component analysis
PSD Power spectrum density
PMA Pre-motor area
PLS Primary lateral sclerosis
PET Positron emission tomography
RBF Radial basis function
RT Right turn
ix
SMR Sensorimotor rhythm
SCP Slow-cortical potential
SVM Support vector machine
SLD Surface Laplacian derivation
SSVEP Steady state visual evoked potential
TP True positive
TN True negative
x
List of Figures
Page
Figure 1. Experimental system. ...15
Figure 2. Electrodes setup. ...16
Figure 3. Screen shots of virtual wheelchair control in one run. ...20
Figure 4. Strategy of wheelchair control. ...21
Figure 5. Demonstration for the two-step classification. ...29
Figure 6. True positive rate and false positive rate for all subjects in two physical games. ...32
Figure 7. Traces of all physical and motor imagery games for each subject...33
Figure 8. Illustration of time-frequency plots for S2 and S3 in motor imagery tasks...37
Figure 9. ERD/ERS amplitude at C3 and C4 for subject S2-S5...37
Figure 10. Head topography plots of Bhattacharyya distance for binary discrimination for the 4 subjects in motor imagery tasks. ...38
Figure 11. Scheme for One-vs-All classification method ...47
Figure 12. One way Anova analysis of the affects of different on physical data of 5 subjects. ...48
xi
Figure 14. One way Anova analysis of the affects of different on imaginary data of 4
subjects. ...51
Figure 15. The SVM learns a hyperplane which best separates the two classes ...52
Figure 16. The Gaussian Radial Basis Function kernel. ...54
Figure 17. Illustration of feature scaling. ...56
Figure 18. Loosed grid search on C = 2-5, 2-3, ……215 and = 2-15, 2-13,……25 ...57
Figure 19. Fine grid search on C=24, 24.25,... 25 and =2-4, 2-3.5, ... 2-3 ...58
Figure 20. SVM testing result with the best trained C and . ...59
Figure 21. Illustration of SVM classification output result on a testing set. ...60
Figure 22. Loose grid search on imaginary data. ...61
Figure 23. Fine grid search on imaginary data. ...61
Figure 24. The structure of a multilayer perceptron with one hidden layer of six hidden units. ...64
Figure 25. Oneway Anova analysis on different hidden unit effect on the physical data of all subjects. ...65
Figure 26. Oneway Anova analysis on different hidden unit effect on the imaginary data of all subjects. ...66
Figure 27. Classifier comparison on physical data...67
xii
Figure 29. Instances projection onto the plane of 2 PCA selected features...70
Figure 30. Instances projection onto another plane of 2 PCA selected features ...71
Figure 31. Visualization of a subset features of PCA selected features. ...72
Figure 32. Electrodes used in SSVEP study. ...76
Figure 33. System setup and experimental paradigm. ...78
Figure 34. Power spectrum density of single trial visual responses...79
Figure 35. Distribution of peak values for class 1-4 of each channel 1-9. ...80
xiii
List of Tables
Page Table 1. Wheelchair control commands, associated motor tasks, detected EEG patterns
and output control actions ... 22
Table 2. Hit rate and average target hit duration in each game ... 31
Table 3. EEG features that were used for binary classification and 3-class classification 35 Table 4 Hit rate of pass-door tests in the scene with no obstacles. ... 44
Table 5 Hit rate of pass-door tests in the scene with 10 obstacles. ... 44
Table 6 Hit rate of positioning tests in the scene with no obstacles... 45
Table 7 Hit rate of positioning tests in the scene with 10 obstacles... 45
Table 8. Fine tuned cross-validation results using 81 pairs of C and ... 62
1
Abstract
Objective: Brain-computer interface (BCI) technologies have been the subject of study for the past decades to help restore functions for people with severe motor disabilities and to improve their quality of life. BCI research can be generally categorized by control signals (invasive/non-invasive) or applications (e.g. neuroprosthetics/brain-actuated wheelchairs), and efforts have been devoted to better understand the characteristics and possible uses of brain signals. The purpose of this research is to explore the feasibility of a non-invasive BCI system with the combination of unique sensorimotor-rhythm (SMR) features. Specifically, a 2D virtual wheelchair control BCI is implemented to extend the application of previously designed 2D cursor control BCI, and the feasibility of the prototype is tested in electroencephalography (EEG) experiments; guidance on enhancing system performance is provided by a simulation incorporating intelligent control approaches under different EEG decoding accuracies; pattern recognition methods are explored to provide optimized classification results; and a hybrid BCI system is built to enhance the usability of the wheelchair BCI system.
Methods: In the virtual wheelchair control study, a creative and user friendly control strategy was proposed, and a paradigm was designed in Matlab, providing a virtual environment for control experiments; five subjects performed physical/imagined left/right hand movements or non-control tasks to control the virtual wheelchair to move forward,
2
turn left/right or stop; 2-step classification methods were employed and the performance was evaluated by hit rate and control time. Feature analysis and time-frequency analysis were conducted to examine the spatial, temporal and frequency properties of the utilized SMR features, i.e. related desynchronization (ERD) and post-movement event-related synchronization (ERS). The simulation incorporated intelligent control methods, and evaluated navigation and positioning performance with/without obstacles under different EEG decoding accuracies, to better guide optimization. Classification methods were explored considering different feature sets, tuned classifier parameters and the simulation results, and a recommendation was provided to the proposed system. In the steady state visual evoked potential (SSVEP) system for hybrid BCI study, a paradigm was designed, and an electric circuit system was built to provide visual stimulus, involving SSVEP as another type of signal being used to drive the EEG BCI system. Experiments were conducted and classification methods were explored to evaluate the system performance.
Results: ERD was observed on both hemispheres during hand's movement or motor imagery; ERS was observed on the contralateral hemisphere after movement or motor imagery stopped; five subjects participated in the continuous 2D virtual wheelchair control study and 4 of them hit the target with 100% hit rate in their best set with motor imagery. The simulation results indicated that the average hit rate with 10 obstacles can get above 95% for pass-door tests and above 70% for positioning tests, with EEG decoding accuracies of 70% for Non-Idle signals and 80% for idle signals. Classification methods showed that with properly tuned parameters, an average of about 70%-80% decoding
3
accuracy for all the classifiers could be reached, which reached the requirements set by the simulation test. Initial test on the SSVEP BCI system exhibited high classification accuracy, which may extend the usability of the wheelchair system to a larger population when finally combined with ERD/ERS BCI system.
Conclusion: This research investigated the feasibility of using both ERD and ERS associated with natural hand's motor imagery, aiming to implement practical BCI systems for the end users in the rehabilitation stage. The simulation with intelligent controls provided guides and requirements for EEG decoding accuracies, based on which pattern recognition methods were explored; properly selected features and adjusted parameters enabled the classifiers to exhibit optimal performance, suitable for the proposed system. Finally, to enlarge the population for which the wheelchair BCI system could benefit for, a SSVEP system for hybrid BCI was designed and tested. These systems provide a non-invasive, practical approach for BCI users in controlling assistive devices such as a virtual wheelchair, in terms of ease of use, adequate speed, and sufficient control accuracy.
4
CHAPTER 1
Introduction & Literature review 1.1 Background
Mobility limitations are the leading cause of functional limitations among adults with an estimated prevalence of 40 per 1000 persons aged 18 to 44 and 188 per 1000 aged 85 years and older in the general population [1]. Mobility difficulties are also strong predictors of difficulties with activities of daily living (ADL) and instrumental ADL, because individuals need to move to accomplish many of these activities. In addition, impaired mobility often decreases the opportunity to socialize, which results in social isolation, anxiety, and depression [2].
Amyotrophic lateral sclerosis (ALS) is a progressive neurodegenerative disease that affects nerve cells which are responsible for controlling voluntary movement. The first signs are muscle weakness and atrophy. Then, usually after 3-5 years, all voluntary movement is lost: the abilities to walk, speak, swallow, and breathe are all taken away. Because the disease does not affect sensations, intellect, or cognitive function, patients are left to watch their body slowly waste away. Muscle weakness and paralysis are characteristics of motor unit damage. Indeed, the pathology associated with ALS is the degeneration of the large alpha motor neurons. The large neurons of the motor cortex that innervate alpha motor neurons are also affected, but other neurons in the central nervous system (CNS) are spared. The
5
selective damage to motor neurons explains the selective loss of motor functions in ALS patients. Primary lateral sclerosis (PLS) is a variant of ALS that affects the corticospinal upper motor neurons, limiting movement. As some patients may completely lose motor function and become totally ‘locked-in’ [3], loss of motor function significantly affects patients’ quality of life (QoL) [4-7] and increases the financial burden for the cost of care [8].
Unfortunately, motor recovery is not possible at present for patients with progressive diseases, such as ALS, PLS, multiple sclerosis, or Parkinson's disease, or for many patients with severe trauma due to stroke, cerebral palsy, or injury to the spinal cord or brain. Although some innovative rehabilitation strategies have shown potential in randomized controlled trials [9-12], available rehabilitation methods do not restore normal or near normal motor function and quality of life in most patients. Therefore, it is important to develop more effective alternative methods for people with motor disabilities.
1.2 Brain-computer interface technology
How is the movement generated? Let’s take the arm movement of a healthy person for example. First, during the planning stage of movement, neurons in supplementary motor area (SMA) and premotor area (PMA) start firing, until the movement starts, and the primary motor cortex get activated mainly during the movement execution or even imagination; it will elicit twitches of muscles in the arm on the contralateral side.
6
For voluntary movement, the lateral pathways are involved where the brain talks to the spinal cord. The axons in the corticospinal tract originate in SMA, PMA and primary motor cortex and terminate in the ventral horns where the motor neurons control distal muscles. Alpha motor neurons directly generate force by activating extrafusal fibers in the muscle; meanwhile, gamma motor neurons stretch spindles by activating intrafusal fibers, and then send feedback to the spinal cord through Ia afferent. These events form a loop to complete muscle contraction.
For the patients whose neural pathways are blocked, a brain–computer interface (BCI) or brain–machine interface (BMI) has been proposed as an alternative communication pathway, bypassing the normal cortical-muscular pathway [13, 14]. BCI is a system that enhances neuromuscular output or provides a neural interface to substitute for the loss of normal neuromuscular outputs by enabling individuals to interact with their environment through brain signals rather than muscles [15, 16]. The signals that deliver user's communication or control intention are translated into an output, for example, cursor movement. The feedback on this output is received by the user through visual, auditory or tactile format; it in turn affects the user's brain activity and influences subsequent output. Recently there has been a great surge in research and development of brain-controlled devices for rehabilitation owing to increased societal interest and appreciation of the serious needs and impressive potential of patients with severe motor disabilities [16, 17].
7
1.3 Brain signal detection methods
Brain signals can be detected and measured in many ways, such as methods of recording electrical activities, magnetic activities or magnetoencephalography (MEG), functional magnetic resonance imaging (fMRI), functional near-infrared imaging (fNIR), and positron emission tomography (PET). However, due to the complex technical requirements, expense and real-time capabilities, MEG, fMRI and PET are not suitable for everyday use at their current stage. Only electrical field recording and fNIR [18] are likely to have practical value for clinical use in the near future.
Electrical activities of the brain can be recorded at the scalp (EEG), at the cortical surface (Electrocorticography or ECoG), or within the brain (local field potentials/LFP or spike train). Each method has its own advantages and disadvantages. ECoG and LFP methods have good topographical resolution and wide frequency ranges. The BCIs using invasive signal methods to record intracortical neuronal activities have shown great promise in direct brain control of external devices in primates, for example, to restore self-feeding by controlling a 3-D robotic arm [19]. However, they are invasive, requiring implantation of electrodes on the cortical surface or in the brain. The main concerns of invasive BCIs to be dealt with before clinical use include the following: long-term safety; the stability and duration of the signal; tissue reaction to the electrodes and whether it can outperform an alternative option such as a neuroprosthetic arm. Non-invasive EEG method has been
8
extensively explored because of its lower clinical threshold as well as the ease of use. But EEG recording is sometimes susceptible of being contaminated with electromyographic (EMG) or electrooculographic (EOG) activities from cranial muscles.
1.4 Challenges of EEG-based BCIs
In contrast to invasive methods, non-invasive methods feature an extremely low signal-to-noise (s/n) ratio, which is a major challenge in EEG based BCI development. Conventionally, s/n ratio can be improved by repeated averaging, for example, as in event-related potentials (ERPs), which can be obtained by averaging across trials time-locked to the stimuli. However, due to the requirement for repeated measurements, the communication speed is greatly reduced. An alternative method to improve s/n ratio for reliable BCI control is to train users to regulate their brain activity, such as by modulation of the slow-cortical potentials (SCP) [20] or the 8–12 Hz sensorimotor Mu rhythm [21]. Once people learn to effectively regulate their brain activity, reduction of the variance in the EEG signal can be expected and as a result, the s/n ratio is increased. However, due to the variance of spontaneous activity in EEG, long-term training is usually required for users to achieve effective and accurate regulation of either SCPs or sensorimotor Mu rhythms. The long-term training may require a couple of months to 1 or 2 years [22, 23]. Moreover, users may be easily fatigued from the sustained attention that is required to regulate their brain activities and as a result, render the BCI control unreliable.
9
Fatigue becomes serious in severely paralyzed patients who demonstrate not only reduced physical but also mental endurance [24, 25]. Recent pilot studies of BCI feasibility for ALS patients shows that they may not be able to learn the skills for effective regulation of brain activities because they are too weak to tolerate long-term training and/or active regulation with focused attention [26-28]. Although healthy persons or less severely paralyzed patients may operate current EEG based BCIs efficiently [29, 30], the performance of current BCIs in severely paralyzed patients with degenerative diseases such as ALS, however, was much lower because they were easily fatigued or could not tolerate long-term training. The accuracy was just over the random level for ALS patients, in contrast to the 90% accuracy level achieved in healthy subjects [23, 31]. Therefore, the inconvenience in operation may prevent current BCIs from practical clinical applications for severely paralyzed patients who are the users most in need of direct brain control of external devices to restore function.
1.5 Relevant studies by other groups
So far, systems based on EEG have been used to control a mouse on the screen [32], for communication like a speller [33, 34], an internet browser [35], or control a wheelchair [36-38]. The most commonly used feature in cursor or wheelchair control is event-related desynchronization (ERD) [39], a phenomenon of EEG amplitude attenuation during mental tasks indicating cortical activation. Through motor imagery of hand/foot movements by detecting spatially different ERD patterns, or through regulating brain rhythms to decrease
10
signal variability and increase SNR in order to discriminate control state ERD from non-control state baseline activity, users could achieve 1D, 2D cursor or wheelchair non-control [22, 38, 40-44]. Recently, 3D virtual helicopter control game [45] using intelligent control strategies [38, 44, 46-48] was reported, and 3D cursor control through right/left hand and foot motor imagery after a series of training sessions [49] has also been achieved. However, such kinds of methods usually require intensive user training. Approaches detecting only ERDs with left/right hand motor execution/imagery may experience insufficient decoding accuracy as there is evidence that during unilateral hand movement, ERD starts contralateral to the side of movement about 2s before movement onset and becomes bilateral at the time of movement onset [50-52]. Given that low detection error is more desirable in wheelchair control compared to applications in cursor control or computer games where speed is of higher importance and error tolerance is high, two questions arise: Is it possible to utilize new EEG features that may essentially provide higher separability among different mental tasks? Can we design a simple but effective paradigm to enhance the control accuracy and contribute in a fast attained 2D BCI for potential wheelchair control?
1.6 Preliminary studies by our group
In the preliminary studies of our group, we have identified that the human volition to move or cease to move associated with natural motor behavior can be reliably decoded online from EEG signals, where users do not need to learn vast training to regulate brain activities.
11
We found that the discrimination of ERD from ERS was much more reliable than the discrimination of ERD from background activities in conventional BCI methods [53, 54]. A short-lasting burst of EEG oscillation, termed as beta rebound or beta-ERS, has been observed in beta band (16–30 Hz) over human sensorimotor area after subjects produce a self-paced movement [39, 55, 56]. Although the beta rebound has been postulated as the result of afferent input [57], other studies show that the beta rebound does not necessarily depend on motor cortex output and muscle activation, and it may reflect a short-lasting state of deactivation or inhibition of the motor cortex [58, 59]. The feasibility of the beta rebound for BCI application derives from the fact that beta rebound may not only occur with real physical movement but also presents with motor imagery [60]. This comes into consideration since the patients who lose their voluntary muscle contraction may only imagine movement instead of producing real movement [53]. The beta rebound results in a strong synchronization, i.e. higher amplitude of rhythmic activities in beta band than background activities. As ERD features lower amplitude beta band activities, the discrimination of beta rebound or beta-ERS from beta-ERD is presumably more accurate than the discrimination of ERD from background activity. Furthermore, the beta rebound also features strict somatotopic organization [55], allowing for potential discrimination of different limb movements spatially according to human somatotopy. In 2008, our group implemented a synchronous sequential binary controls approach to decode EEGs to provide 2D control of a cursor on a computer screen, with simple threshold-based binary classification of band power readings taken over pre-defined time windows during subject right hand movement/motor imagery [53]. The following study, using spatial feature of the
12
beta rebound, supports a multi-dimensional BCI by reliable decoding of intentions to move individual limbs [61]. The beta-ERD and beta-ERS features associated with human natural motor control has also been further tested on six ALS or PLS patients in sequential binary control for 2D cursor control, and two patients further participated in direct two-dimensional cursor control in a single visit [62].
1.7 Aims of the doctoral study
In this doctoral study, further steps have been taken to explore the possibility of utilizing the ERD/ERS neurophysiological features to develop more advanced BCI systems that can better serve the potential users from multiple perspectives. The specific aims of this doctoral research are:
1. Design the prototype of a 2D virtual wheelchair control system and evaluate its
feasibility. To develop an effective and practical 2D wheelchair control strategy based on the improved 2D cursor control rationale; design a paradigm of virtual environment; conduct wheelchair control experiments on healthy subjects; and perform feature analysis and statistical analysis to evaluate the system performance.
2. Explore classification methods and enhance the EEG decoding accuracy. A
simulation will be done to set requirements for the decoding system. To achieve optimal classification performance, different parameters will be selected and tested
13
to optimize classification results, and recommendations will be made for the system according to the comparison result.
3. Enhance the usability of the wheelchair system with the final goal of achieving a
hybrid BCI system. A SSVEP electric circuit system will be designed and built, to provide visual stimulus with flashing LEDs of different stimulation frequencies. The SSVEP system will be combined with ERS/ERS system in the future. The SSVEP system will be tested with subjects in EEG experiments.
To achieve the above research purposes, the hypotheses provided in this research are as follows:
1. The control rationale for 2D cursor movement can be transplanted and further
improved into implementing a prototype of continuous wheelchair control, which subjects can quickly learn to operate with decent control accuracy and speed.
2. With intelligent control incorporated into the BCI system, requirements of EEG
decoding accuracy could be looser and properly selected classifiers can easily satisfy the requirements.
3. The hybrid BCI by including visual stimulus can provide additional information
14
expected to be comparable or superior with that of ERD/ERS BCI system, and the usability of the final hybrid system among the population should be enhanced.
15
CHAPTER 2
2D virtual wheelchair control 2.1 Experimental system
2.1.1 System hardware, software and electrodes set up
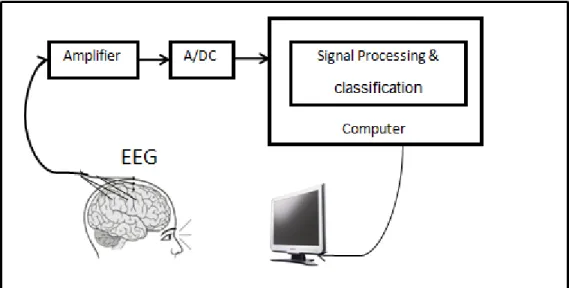
Figure 1. Experimental system. EEG signals were picked up from scalp and amplified, then were digitized through A/D convertor and sent to the computer for signal processing.
Figure 1 shows the system setup. A monitor was placed in front of the subject, presenting the experimental paradigm. Meanwhile, EEG signal was recorded from 27 (tin) surface electrodes attached on an elastic cap. Surface electromyography (EMG), which was used to monitor the movement and bipolar electrooculogram (EOG) above left eye and below right
16
eye were also recorded. The analog signals were amplified, and then digitized through A/D convertor. The digital signal was then sent to a computer for online processing.
Figure 2. Electrodes setup.
EEG was recorded from 27 (tin) surface electrodes (Figure 2. F3, F7, C3A, C1, C3, C5, T3, C3P, P3, T5, F4, F8, C4A, C2, C4, C6, T4, C4P, P4, T6, FPZ, FZ, FCZ, CZ, CZP, PZ and OZ) attached on an elastic cap (Electro-Cap International, Inc., Eaton, OH, U.S.A.) according to the international 10-20 system [63], with reference from the right ear lobe and ground from the forehead. Two surface EMG electrodes were taped over the right and left wrist extensors, used to monitor the hand movement. Electrodes for bipolar EOG above left eye and below right eye were also pasted. Total duration of preparation for obtaining
17
consent, explaining paradigm, and setting up electrodes took around 30 min to 1 hour. Signals from all the channels were amplified (g.tec GmgH, Schiedlberg, Austria), filtered (0.1-100 Hz) and digitized (sampling frequency was 256 Hz). All impedances were kept below 5kΩ. The digital signal was processed online using a custom-made MATLAB (MathWorks, Natick, MA) Toolbox: brain-computer interface to virtual reality or BCI2VR [53, 64]. The paradigms were programmed in the BCI2VR, to provide the visual stimulus for the calibration, 2D virtual wheelchair control game, and online processing of the EEG signal.
2.2 Subject selection
2.2.1 General subject Inclusion criteria:
Subjects were selected based on normal neurologic and psychiatric history and examination, as well as a willingness and ability to perform simple voluntary movements over a 2-hour time period. Subjects were admitted to the protocol regardless of gender, race or ethnicity. Children were excluded as the movement parameters used in this study is less established in subjects under the age of 18. All subjects in this study were healthy volunteers.
2.2.2 Subject exclusion criteria:
We would exclude subjects who are unable to perform simple voluntary movement with both hands and subjects who have any neurological or psychiatric conditions. Ethnic origin
18
and race would not be a basis for inclusion or exclusion. We would strive to obtain a population sample that best represents the breakdown of this local area.
2.2.3 Potential risks
The risks of EEG and MEG are minimal. Subjects may feel uncomfortable while the electrodes are attached to their scalp, and they may not like the smell of the paste or the glue remover. The conductive gel sometimes causes some mild irritation. The substances used to remove the glue have quite a strong odor, but do not have any harmful effects when used for a short period of time. If human movement intention is predictable, future interventions can then be directed at using these EEG potentials to control prosthetic devices (brain-computer interfaces). This study would contribute to the understanding of how our brain prepares for movement and this may eventually lead to clinical applications; therefore, we believe that the benefits outweigh the minimal risk.
For the 2D virtual wheelchair control study, five right-handed healthy subjects (S1-S5, 2 females and 3 males) age 23 to 30 participated in. S2 had 6 hours BCI experience half a year ago for another irrelevant study; S1, S3-S5 had no previous BCI experience. All the subjects were participating for the first time in this study.
19
All the subjects gave informed consent before the studies, and both protocols were approved by the Institutional Review Board.
2.3 Experimental paradigm
2.3.1 Online wheelchair control paradigm
Figure 3 shows a set of small screen images (a-h) which demonstrate a sequence of steps in one target reaching task during the virtual wheelchair control. The converted real size of the simulated scenario is 20 by 20 square meters. The relative size of the targets on any of the four sides is 6 by 1 square meters. Each run began with the wheelchair at the center, and terminated when the wheelchair either hit the target (success) or at any time hit the edge elsewhere (failure). Subjects could inform the investigator to stop the experiment at any time; the investigator monitored the signal quality and EMG activity throughout the experimental procedure. The wheelchair moving speed was set to 0.4m/s, with a rotating speed of 27s per 360 degrees, within the common wheelchair speeds [65]. The wheelchair could move forward only in the direction of the blue bar, which always faced upwards at the beginning of each run. The wheelchair rotated with the square in its center as the axis. The square also served as the color cue; its color changes synchronized with the external auditory cues in different frequencies, reminding subjects of different task periods. Section 2.3.2 explains in detail how the wheelchair was controlled by performing mental tasks and
20
Figure 3. Screen shots of virtual wheelchair control in one run. (a) wheelchair started at the center of the screen-Stop State; (b) wheelchair started to move upward along the blue bar direction after receiving Go/Stop Command-Running State; (c) wheelchair started to make right turn after receiving Right Turn Command-Rotating State; (d) wheelchair stopped rotating and started to move along blue bar direction after receiving Go/Stop Command-Running State; (e) wheelchair stopped moving and started to make right turn after receiving Right Turn Command-Rotating State; (f) wheelchair stopped rotating and started to move along blue bar direction after receiving Go/Stop Command-Running State; (g) wheelchair reached the target-Stop State; (h) simulation of wheelchair control restarted-Stop State.
2.3.2 Wheelchair control strategy
Figure 4 shows the expected EEG power changes with execution of four mental tasks separately (in four rows). The performing of each task together with expected EEG power changes and output control command is visualized in Figure 4, and also summarized in Table 1. Take the top row for example. This is a “Go/Stop” command or “GS” for short. Task began with the T1 time window (0-1.5s), indicated by the color change of the color cue (the square in the center of the wheelchair changed to green) which occurred simultaneously with the first auditory cue onset. When this happened, subjects performed
21
right wrist extension or motor imagery (refer Table2). When the color cue changed to blue, T2 time window (1.5-4s) began and subject heard the second auditory beep as well. In this period, subjects continued performing right wrist extension or motor imagery until the end of T2 window, when the color cue changed to white and the third auditory cue onset. Movement intention was decoded and control action was taken: in this “GS” case, the virtual wheelchair started to move forward from the original stop state.
Figure 4. Strategy of wheelchair control. (a)-(d) follow the time sequence. (a) In stop state, the wheelchair is keeping still. (b) In the first cue period T1, subjects start any of the motor tasks; from top to bottom are the four situations: right wrist extension-left hemisphere ERD pattern, right wrist extension-left hemisphere ERD pattern, left wrist extension-right hemisphere ERD pattern or no motor task-Idle/baseline activity. (c) In the second cue period T2, subjects continue with the task: continue right wrist extension-left hemisphere ERD pattern, stop right wrist extension and relax-left hemisphere ERS, stop left wrist extension and relax-right hemisphere ERS, or no motor task-baseline activity. (d) Movement intention is decoded and wheelchair is driven to move forward (or stop when moving), turn right, turn left or keep current moving status. Inter-trial interval (the end of T2 to the beginning of next T1) is 2s.
22
Table 1. Wheelchair control commands, associated motor tasks, detected EEG patterns and output control actions
Specifically:
1.Go/Stop Command (‘GS’): characterized by the bilateral ERD in both T1 and T2 windows, i.e. when users want the wheelchair to move forward, or stop the wheelchair when it is moving, they perform (imagined) right wrist extension continuously in both T1 and T2 windows. This command will make one of the following three possible state changes:
I. Switch from Stop State to Running State, wheelchair will start moving;
II. Switch from Running State to Stop State, wheelchair will stop moving;
III. Switch from Rotating State to Running State, wheelchair will stop rotating and start
to move.
Control Command
Associated Motor Task
Detected Activity in T2
Control Actions T1 T2 Current
State Next State Go/Stop Right wrist
extension
Continued right
wrist extension Bilateral ERD
Stop Running Running Stop Rotating Running Right Turn Right wrist
extension Relaxation Left hemisphere ERS Stop Rotating Running Rotating
Left Turn Left wrist
extension Relaxation Right hemisphere ERS Stop Rotating Running Rotating Idle State No motor
task No motor task
Idle/resting
23
2. Right Turn Command (‘RT’): characterized by the bilateral ERD in T1 window
and ERS on the left hemisphere in T2 window, i.e. when users want to make a right turn, they perform (imagined) right wrist extension in T1 window and stop the (imagined) movement at the beginning of T2 window. This command will make the following state change:
I. Switch from Stop State or Running State to Rotating State, wheelchair will start to
rotate to the right.
3. Left Turn Command (‘LT’): characterized by the bilateral ERD in T1 window and
ERS on the right hemisphere in T2 window, i.e. when users want to make a left turn, they perform (imagined) left wrist extension in T1 window and stop the (imagined) movement at the beginning of T2 window. This command will make the following state change:
I. Switch from Stop State or Running State to Rotating State, wheelchair will start to
rotate to the left.
The Idle (‘ID’)/non-control state is the natural state when subjects do not want to change moving state; whenever the computer detects ‘ID’ state, no control command will be sent out and thus the wheelchair keeps its current state. The involvement of ‘ID’ state in this study renders the continuous control and makes the control process easier.
24
2.4 Experiment procedure and Signal processing for decoding movement intention
For either physical or motor imagery session, each subject performed 25min of calibration, containing 96 ‘ID’ tasks and 32 each of the other tasks (‘GS’, ‘RT’, ‘LT’), with a 5min break in the middle. This created the models based on which subjects performed two sets of online wheelchair control games; each set had 8 runs/target reaching, two for each target location, with targets showing up pseudo-randomly. 1-5 minutes breaks were given in between games or runs.
2.4.1 Spatiotemporal filtering and feature selection
The online data were processed through three steps to decode the movement intention: (1) spatial filtering, (2) temporal filtering and (3) feature selection and classification.
The spatial filter applies a transformation matrix that is determined under certain constraints to the EEG signal so that the filtered signal may have a better signal-to-noise ratio for identifying the changes of the underlying neuronal sources. This procedure is similar to beam-forming, which can increase the gain in the direction of the task-related signals and decrease the gain in the direction of interference and noise. As a result, the spatial filter may improve classification accuracy. The signal from electrodes was directly fed into the temporal filter.
25
Surface Laplacian derivation (SLD) was applied as the spatial filter. SLD performs surface Laplacian transformation on multi-dimensional EEG signals. Realistic Laplacian transformation usually requires a head shape model, which can be constructed from brain imaging [66]. We employed a simple method, which is also called a ‘reference-free’ method so that the signal is independent of which electrode is used as reference. The EEG signal from each electrode was referenced to the averaged potentials from four orthogonal nearby electrodes [67]. SLD operation enhanced the spatial resolution of local EEG potentials by reducing the volume conduction effect. It applies a high-pass filter to suppress low-spatial frequency components along with volume conduction components so that the local synchronizations, in particular, their radial components, have increased spatial
specificity [68] and as a result, the spatial difference following hand movements might be
more discriminable.
Temporal filtering was done through the power spectral density (PSD) estimation of the spatially filtered EEG signal in the T1 and T2 window. According to the visual inspection of time–frequency plots of ERD and ERS after the calibration session, one period from T1 and one period from T2 were extracted in order to obtain the strongest ERD/ERS. PSD estimated power spectral densities of the spatial filtered signal using the Welch method. A Hamming window was employed to reduce side lobe effect. The FFT length was set to 0.256 s resulting in a frequency resolution of approximately 4 Hz. Power spectral densities were smoothed from segments with 50% overlapping. A number of PSD estimation
26
methods have been used in the signal processing literature, each of which varies in resolution and variance of the estimation. Periodogram or modified periodogram has higher spectral resolution, but the resulting variance is also larger than that of the Welch method [69]. The multitaper method provides a solution to balance the variance and resolution [70]. However, an optimal multitaper method permits the trade-off between resolution and variance to usually be data-dependent [71]. We did not employ parametric methods, for example, using autoregressive model coefficients [72]. The parametric model requires determining model order. Further, the model coefficients for classification are also indirect to frequencies, which are difficult for general neurophysiological analysis.
The spatially and temporally filtered EEG signals provided high-dimensional features; for example, 27 EEG channels with 16 frequency bins produced 432 features. Because of the noisy nature of EEG, such high-dimensional features may bias the classification model producing a low testing accuracy. A compact subset of features needs to be determined for achieving a robust classification. The subset feature selection can be determined either empirically or ‘data-driven’. Because of the high dependence among features, the empirical approach usually does not provide a good solution. The exhaustive search method is one of the optimal feature selection methods, which evaluates all possible subsets to determine the best subsets. For example, the exhaustive search of a subset of 3 features from 432 features results in more than ten million combinations. It is impractical to perform this due to the computational burden. In the precious study, we adopted a sub-optimal method of genetic algorithm-based search, which is a stochastic search in the
27
feature space guided by the idea of inheriting, at each search step, good properties of the parent subsets found in previous steps [73]. Because of the large number of features, the convergence speed under GA was still very slow.
For the purpose of faster convergence and less risk of local minima, we proposed an approach of pre-feature selection to pre-select features having larger Bhattacharyya distance between two task conditions. The Bhattacharyya distance is the square of mean difference between two task conditions divided by the variance of the samples in two task conditions [74]. The Bhattacharyya distance was calculated on each feature (univariate) in feature pool indexing the feature separability between two task conditions, which was somewhat similar to ANOVA statistic test by evaluating the volume of the pooled covariance matrix of the class relative to the separation of their means. As Bhattacharyya distance indexes the separability directly, it is preferable for feature selection with comparison of other indexing methods, for example, the Fisher Score which indexes the similarity. The features were sorted in descending order according to their Bhattacharyya distance; the first 100 features were retained for subsequent multivariate feature selection.
Assuming that movement intention associated cortical activities occur over the motor cortex, we empirically reduced the channel number from 27 to 16, which covered both left and right motor areas (channels CZA, C3A, CZ, C1, C3, C5, CZP, C3P, PZ, P3, C4A, C2, C4, C6, C4P, P4). Furthermore, we extracted alpha and beta band (8–30 Hz) activities for modeling and classification. Consequently, the total number of extracted features was 8
28
(frequency bins) × 16 (channels) = 128 features. Bhattacharyya distance provides an index of feature separability for binary classification, which is proportional to the inter-class mean difference divided by intra-class variance [75]. The empirically extracted features were ranked by the Bhattacharyya distance for further classification.
2.4.2 Two-step modeling/classification
As Figure 5 shows, the first step was to identify whether the signal belonged to control commands (true positive or TP) or non-control commands (true negative or TN), as we wanted to keep false triggering / false positive rate (FPR) as low as possible and true positi ve rate (TPR) sufficiently high. For modeling using the calibration dataset, we first grouped all three active tasks (‘GS’, ‘RT’, ‘LT’) into one category as control signals, leaving ‘ID’ tasks as another category, i.e., non-control signals. We applied Mahalanobis linear distance (MLD) classifier to find the prototype centers of the two categories. For each sample in the training set, we calculated the distance between itself and each center and then took the difference
d
to finally get d for all the training samples. By applying a series of thresholds to
separate d, we could classify the samples under different accuracies, we then got the ROC
plot [76] for all thresholds on testing samples. We selected an optimal threshold under which FPR was lower than 10% and TPR higher than 80%, or sub-optimal threshold which was close to the left upper corner of the ROC curve and applied that threshold in the online wheelchair control to separate Idle from Active.
29
If it was Idle, the computer did not send out any control command, instead, the wheelchair kept current moving; if classified to Active, the second step was a 3 -class classification, to further determine whether it was a ‘GS’, ‘LT’ or ‘RT’ command. In each step, the features (power data extracted from T1 and T2 windows over different frequency bins and electrode locations) were ranked by the Bhattacharyya distance and the ones with higher ranks were used for classification by a MLD classifier.
Figure 5. Demonstration for the two-step classification. Step 1 is a binary classifier, separating Idle from Active; Step 2 is 3-class classifier, further determine which Active command the sample belonged to.
30
2.5 Experimental results
Table 2 shows that except for S1 who quit due to sleepiness, the other four subjects who finished all physical and imagery sessions finally got 100% target hit rate in the second set of games (Game 2) with motor imagery, with time generally shorter than Game 1 (except for S4), due to fewer misdetections in Game 2. This shows that subjects became familiarized with the BCI operation and learnt to cooperate with the BCI system and improve their sense of kinesthetic imaginary. Notice that Game 2 in the physical session also took a shorter time than that in Game 1 (t=5.03, df=39, p-value<0.001*), which can be considered evidence that the subjects started to learn.
Taking a closer look at the target reaching time in the second imaginary game, we found that 58.6s was the average time for subject 2,3,4 and 5 to reach a target 10m away. 5.9s/m reflected a reasonable speed for a wheelchair used by paralyzed patients [65].
Both binary and 3-class classification affected subjects’ control performance; binary classification was of more importance as non-control states (Idle tasks) accounted for 46.9% of all tasks. This was in accordance with another study conducted by Pfurtscheller’s group [77] where the subject “walked” straight in a virtual environment using two signals, IC (intentional control) and NC (non-control) in order to reach avatars. As they pointed the drawback of their design was that the subject was forced to stop at the avatar for a
31
minimum 1s NC period, but the actual subjects' stopping time was very short with the mean 0.47s, which means the false triggering (FP) was inevitable.
In our imaginary movement, no values for TP and FP can be given, for the same reason as the study mentioned above. Using their evaluation method, for S2, S3, S4, and S5, TPR in motor imagery would be 63/64=98.4% and missed hits (false negative rate/FNR) =1/64=1.6% (calculated from Table II); FP and true negative (TN) cannot be evaluated. However, since target reaching time for motor imagery was comparable to that for physical movement, we can calculate TPR and FPR (shown in Figure 6) by monitoring the EMG activity in physical movement.
Table 2. Hit rate and average target hit duration in each game
Hit rate (%) & Duration (s)
physical imaginary
Game1(8runs) Game2(8runs) Game 1(8runs) Game 2 (8runs) S1 100 (85.8) 87.5 (52.0) * * S2 100 (40.8) 100 (34.8) 100 (43.0) 100 (41.5) S3 100 (63.3) 100 (63.0) 100 (59.5) 100 (39.5) S4 87.5 (67.0) 100 (58.0) 87.5 (70.9) 100 (88.0) S5 100 (50.5) 100 (49.8) 100 (75.3) 100 (65.5)
TPR is the sensitivity, indicating the active command recognition rate. For all subjects, TPR ranged from 64.3% to 100% (mean 84.3%) which was much higher than chance value
32
53.1% (percentage of active command). FPR is the false triggering rate ranging from 3.8% to 43.5% (mean 19.0%) which means specificity (TNR or 1 -FPR) was much higher than chance value 53.1% (percentage of active command). FPR is the false triggering rate ranging from 3.8% to 43.5% (mean 19.0%) which means specificity (TNR or 1 -FPR) was 81.0%, much higher than chance value 1-53.1% or 46.9%.
For physical movement, average target hit time was 56.5s, obtained from Table 2. With the calculation above, one run took about 9.5 commands to hit the target, about 0.89 Idle was detected as active (1 false triggering) and (5.31-4.48=0.83) active commands were detected as Idle (1 insensitivity). This calculation gave us a general idea for motor imagery control which took an average 60.4s for each target hitting. Under this detection rate, subjects reported good sense of control.
Figure 6. True positive rate (TPR or active command recognition rate), and false positive rate (FPR or the ratio of ‘Idle’ command recognized as active command) for all subjects in two physical games.
33
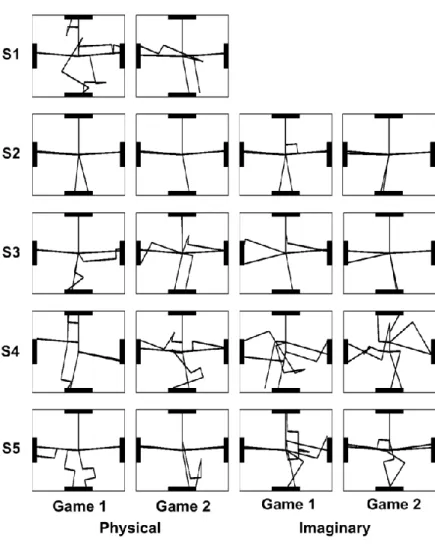
Figure 7 shows the traces for all the games in physical and imaginary sessions for each subject. We can see that S2, with several hours’ previous exposure to other BCI studies, was more comfortable than the other subjects even from the first run and also displayed good performance in motor imagery. S3, although a naive BCI user, caught up very quickly and over performed S2 in the last motor imagery game.
Figure 7. Traces of all physical and motor imagery games for each subject. Each game had eight runs/target reaching.
34
Table 3 shows the best EEG features used for each subject in physical and binary wheelchair control games, in terms of electrodes and frequency bins (4Hz bin width). We notice that frequency bins for binary classification more often appeared in alpha and lower beta bands (bin 3-6 or 9-24Hz); for 3-class classification, bin 7 and 8 (25-32Hz) were involved more often. This proved the fact that for 3-class classification, ERS, which occurred mostly in beta band, played a significant role. The best channels for binary classification more often appeared in C3 and C4; for 3-class classification, channel C1 and C2 were also involved for some subjects, which may indicate that ERS in central motor area was stronger for some subjects and its contrast with ERD contributed much in discrimination of GS/RT/LT.
Figure 8 is an illustration showing the ERD/ERS of S2 and S3 in motor imagery. Best electrodes were selected (C3 and C4 for S2, C1 and C4 for S3). As can be seen, during the Idle state, subjects thought about nothing, baseline activity exhibited throughout all frequency bands. In 0-1.5s of the active tasks where subjects imagined wrist extensions, ERD (blue) occurred most of the time, at around 10-20Hz frequency band, bilaterally distributed. During 1.5-4s, subjects either continued imagined movement where ERD still sustained or stopped motor imagery where ERS (red) showed up. ERS occurred mainly on the contralateral hemisphere. For S3, ERS appeared at higher frequency band than S2, and more towards central electrodes. From the plots we can see that the spatial and and
35
temporal EEG signal differences among different motor tasks can be reflected from ERD/ ERS patterns associated with movement intention which can be decoded by analyzing the data in T1 and T2 time windows.
Table 3. EEG features (specific frequency bins at specific electrodes) that were used for binary classification (Idle/Active) and 3-class classification (GS/RT/LT) in physical /motor imagery session for each user
Electrode (frequency bin) Physical Imaginary User Binary 3-class Binary 3-class
S1 C3,C4 (5,6) C3,C4 (5,6) C3,C4 (4,5) C3,C4 (4,5) S2 C3 (5,6) C3,C4 (4,5) C3 (5,6) C3,C4 (3,4) S3 C3,C4 (6,7) C1,C3 (7,8) C3,C4 (4,5) C1,C3 (7,8) S4 C3,C3P (5,6) C3,C4 (6,7,8) C3,C3P (4,5) C3,C4 (6,7) S5 C3,C4 (4,5) C1,C4 (6,7,8) C3,C4 (4,5) C1,C2 (7,8)
To answer why involving ERS as opposed to ERD could potentially enhance detection accuracy, we need to quantitatively examine ERD/ ERS in the three mental tasks. Figure 9 shows ERD/ERS values at C3 and C4 for S2-S5 in physical movement (top two) and imagined movement (bottom two), under the left turn (LT), right turn (RT) or Go/Stop (GS) tasks. The left side describes the T1 window and right side describes the T2 window.
36
First, it is obvious that ERD/ERS power distribution in the physical and motor imagery sessions is quite similar, except that power in motor imagery session is much weaker than that in physical session, which is consistent with our previous reports. Second, as we can see in the T1 window (Figure 7), for all three tasks, both C3 and C4 generally exhibit negative values because of the bilateral ERD distribution during left/right hand (imagined) movement. Conventional rhythmic regulation is largely based on an ERD approach, however, due to the fact that ERD could be difficult to be detected from baseline because of the variance and the similarity that exists among different mental tasks (p-value=0.8227 for physical and p-value=0.5207 for motor imagery), intensive training may be necessary before stable control could be attained.
In contrast, the proposed novel design makes the most of spatial and temporal difference of EEG features during mental tasks, as it involves spatially focal ERS associated with cessation of mental tasks in the T2 window, which essentially enhances the difference among mental tasks. As can be seen in the T2 window, positive power values generally exhibit on the contralateral hemisphere for RT and LT tasks while, in contrast, negative power values bilaterally exhibit for GS tasks. Three tasks can be classified easily in the physical session value=0.0002*) and less easily in the motor imagery session (p-value=0.0856).
37
Figure 8. Illustration of time-frequency plots for S2 and S3 in motor imagery tasks. X axis represents time. Specifically, in non-Idle tasks, from 0-1.5s subjects performed imagined right wrist extension (GS/RT) or left wrist extension (LT) and from 1.5s-4s, either continued imagined extension (GS) or stopped and relaxed (RT/LT). Y axis indicates frequency. Red means power increase and blue is power decrease, with green the baseline.
Figure 9. ERD/ERS amplitude at C3 and C4 for subject S2-S5 in physical movement (top two) and imagined movement (bottom two). Left side describes T1 window and right side describes T2 window
38
For each subject, the best electrode locations and frequency bins used for control signals were provided by Bhattacharyya distance. Figure 10 is an example where Bhattacharyya distance was used in binary classification to separate active tasks from Idle. One of the best frequency bins were selected to illustrate each subject's performance. As subjects exhibited variant performances in motor tasks, we usually selected two or three major channels/frequency bins for each subject as the best ones. As can be seen, S2 was more familiar with BCI than the other three, and therefore the pattern was more stable (less noisy in the surrounding electrodes) than others. Compared with S2, S3 had the best electrodes more focal, evenly on both hemispheres. S4 had C3 and C3P both on the left hemisphere, as the best electrodes for binary classification and S5 had a few ideal electrodes providing good separability, similar with S2.
Figure 10. Head topography plots of Bhattacharyya distance for binary discrimination for the 4 subjects in motor imagery tasks. Dark red areas indicate highly distinguishable and dark blue means the opposite. Best frequency bins and channels for each subject differ.
39
2.6 Discussion
In this study, we have presented an effective and practical paradigmof a continuous
EEG-based BCI for virtual wheelchair control of subjects in their first visit. The wheelchair could be operated to turn left or right, to go straight or stop, with all the basic motion functions that a real wheelchair has. The prominent induced power decrease (ERD) and power increase (ERS) associated with imagined natural movements allowed the reliable discrimination of movement intentions, and therefore improved control accuracy and increased the degrees of freedom of the wheelchair control system. The result showed that a high hit rate (87.5%-100%) could be achieved by controlling the simulated wheelchair continuously moving in a 2-D plane when subjects imagined hands’ movements. It should be noted that subjects achieved the reasonable control performance in their first visits.
Compromise is always needed when optimizing control accuracy and speed. While control accuracy is satisfying, increasing the wheelchair’s movement and rotation speed is also of key interest. As we have noticed, it took time for the correction of wheelchair overshoot which can be observed in Figure 6 from the sharp turn of the trajectories. This was caused by the unresponsive detection periods T1 and T2. However, as T1 and T2 are essential for ERD and ERS to happen, they are indispensable for the proposed strategy. Thus, to optimize the length of the detection window to make a more flexible, yet reliable wheelchair control is our next step.
40
Moreover, reduction of the number of electrodes could be performed with the expectation of comparable results, as we found through analysis that subjects exhibited stable features in several electrodes, namely C1-C4, and occasionally C3P and C4P. Fewer electrodes would reduce setup time and undoubtedly will aid the spirit of the subjects. As this was the subjects’ first visit, we asked them to perform physical movement first. On one hand, it allowed us to examine their movement execution and ERD/ERS features before motor imagery and on the other hand it allowed them to find the right way to perform motor imagery tasks.
EMG contamination from facial muscles may possibly cause serious problems in BCI development [78]. Throughout the experiment, EMG signal was monitored for all subjects, to make sure correct movements were performed and no EMG occurred during motor imagery. Further, feature analysis showed that beta activities restricted to motor areas were used for classification. Therefore, EMG contamination was not a concern in this study.
Compared with our previous study where users performed step by step discrete 2 -D cursor control, which is stable but slow, the current study is taking a major step forward in trying to apply the rationale to wheelchair control, by involving non-control state and continuous control strategy as a part of our user friendly design. Specifically, subjects imagined human natural hand movements. Imagined left hand movement in T1 window sent out
41
control command for left turn; imagined right hand movement in T1 window sent out control command for right turn; imagined right hand movement in both T1 and T2 window sent out Go/Stop command. It is in a manner similar to driving, when people want to start the engine, finish turning and go straight, or stop during emergency, they step firmly on the accelerator or brake for a period. Drivers hold this state when they don’t want to change direction or stop, which is similar to the non-control state in this study where subject remained relaxed. This gave subjects 2-4.5s intervals between two active commands which allowed them to take a break and get prepared for the next movement. For the condition that they kept moving/ turning, the non-control state allowed even longer relaxation time for the subjects, or for the potential paralyzed patients. The current design aimed at ease of use for the potential user while keeping a reliable sense of control, with good control speed.
Another aspect of user friendly design is that the paradigm fixed the initial facing direction of the wheelchair upwards in each run while changing target directions, in order to mimic the real world target reaching tasks, where users may need to turn the wheelchair by different angles and then move forward. In the typical setting as we did here: moving forward, turning left/ right and to the opposite directions, we had a good chance of examining all combinations of commands, such as non-control & control, move forward & stop, turn & move forward, just as in real wheelchair control or car operation. Yet, the current virtual wheelchair design is adopted to be most user friendly in a virtual scenario. Once the approach is fully validated and the system performa nce is optimized in a virtual