Abstract
A comparison of Small Form Factor (SFF) fiber optic connectors is presented for LC, MT-RJ, SC-DC, and VF-45. Multimode and singlemode jumper cables were tested using industry standard test procedures and bench marked against the industry standard SC duplex connector. Initial loss data as well as stress testing was performed. Variations were found in the performance of the connectors types and between connectors of the same type from different suppliers. In some cases the connectors out performed the SC duplex on some tests but no connectors out performed the SC duplex on all tests with the mechanical stress tests of axial and off-axial pull being the most difficult to exceed. These connectors are rapidly developing and are at different levels of maturity but none of them tested out to be a fully mature replacement for the SC duplex connector yet.
Introduction
Conventional duplex fiber optic connectors, such as the SC Duplex[1], achieve the required alignment tolerances by threading each optical fiber through a precision ceramic ferrule. The ferrules have an outer diameter of 2.5 mm, and the resulting fiber-to-fiber spacing (or pitch) of a duplex connector is approximately 12.5 mm. Since the outer diameter of an optical fiber is only 125µm, it should be possible to design a significantly smaller optical connector. Smaller connectors with fewer precision parts could dramatically reduce manufacturing costs and have the potential to open up new applications such as fiber to the desktop. Smaller connectors and transceivers would also permit more ports to be added to fiber optic switches and communications equipment without increasing the size and cost of these devices[2].
Recently, a new class of small form factor (SFF) fiber optic connectors have been introduced with the goal of reducing the size of a fiber optic connector to one-half that of an SC Duplex connector while maintaining or reducing the cost[3]. Several different designs have been proposed by different manufacturers, but there is currently no consensus in the industry or the standards bodies on which connector types are best suited for different applications. In this paper, we present for the first time an independent, side-by-side technical evaluation of the major SFF optic connectors for both multimode and singlemode applications.
Description of the SFF connectors
There were four SFF optical connectors evaluated in this report: LC[4], MT-RJ[5], SC-DC[6], and VF-45[7]. Table 1 gives a comparison of the different features of the connectors.
A brief description of each connector and it’s alignment method is given followed by a discussion of the distinguishing characteristics and their impact on the connector and transceiver.
Table 1 : Comparison of SFF connector features
RJ - top latch SC push pull RJ - top latch RJ - top 2 latch coupled Latch cleave & polish socket plug + coupler plug + coupler & socket plug + coupler Field term: Socket Not Avail pre-polished stub pre-polished stub pot & polish Field term: Plug GGP polymer coated duplex or ribbon duplex or ribbon duplex Fiber cable 12.1mm X 8mm X 21mm 11mm X 7.5mm X 12.7mm 7.2mm X 5.7mm X 14mm 11.1mm X 5.7mm X 14.6mm Trx opening: (width X height X length) None φ 2.5mm 2.5mm x 4.4mm φ 1.25mm Ferrule Size V-grove Rail and ferrule Pin and ferrule Bore & Ferrule Align-ment None Plastic Plastic Ceramic Ferrule material 0 1 1 2 # of ferrules 4.5 mm 0.75 mm 0.75 mm 6.25mm Fiber spacing VF-452 SC-DC1 MT-RJ LC
There are several different design approaches to reducing the dimensions of a fiber optic connector. One approach is to use a single ferrule with multiple fibers; this is the concept behind the SC-DC and MT-RJ connectors. The SC-DC (dual connect) and SC-QC (quad connect) use a standard SC connector body and latching mechanism with an offset key, but a new round plastic ferrule design which
2 VF-45 is a trademark of 3M 1
SC-DC is a trademark of Siecor
Performance Comparison of Small Form Factor Fiber Optic Connectors
Jean Trewhella, IBM T.J. Watson Research Center, PO Box 218, Yorktown Heights, NY 10598
Casimer DeCusatis, IBM Corp. 522 South Road, Poughkeepsie, NY 12601
John Fox, Computer Crafts Inc. 57 Thomas Road, Hawthorne, NJ 07507
incorporates either 2 fibers (750µm pitch) or 4 fibers (250µm pitch) in a linear array. Alignment is provided by semicircular grooves in the sides of the SC-DC ferrule, which mate with corresponding ribs in the receptacle. The MT-RJ uses the same rectangular plastic ferrule concept as the multifiber MTP connector, with 2 fibers on 750µm pitch and a latching mechanism based on the RJ-45 connector. Alignment in this case is provided by a pair of metal guide pins in the connector, which mate with a corresponding pair of holes in the receptacle; this feature makes the MT-RJ the only small form factor connector with distinct male and female connector ends.
The most radical, and innovative, approach for a smaller connector is to eliminate ferrules altogether; this is the case for the VF-45 connector. In this connector, a pair of optical fibers are aligned using injection molded thermoplastic V-grooves; the fibers are cantilevered in free space on 4.5 mm pitch, and protected by the connector outer body. When plugged into a receptacle, the fibers bend slightly in order to achieve physical contact; better performance is achieved when using optical fibers which have a special strength coating in addition to the outer jacket.
A fourth, more evolutionary, approach involves simply shrinking the standard SC duplex connector, maintaining a single fiber in each of the ceramic ferrules and using conventional alignment techniques applied to the ferrules. The LC connector uses this approach and shrinks the ferrules to 1.25 mm in diameter with a fiber pitch of 6.25 mm (duplex). LC is the only small form factor connector which can be either simplex or duplex.
In a comparative analysis of the different connectors the first feature with striking differences is the fiber pitch. The connectors can be broken up into two classes: small (0.75 mm) and large (> 4.5 mm) fiber pitch. The tight pitch presents challenges to the transceiver design for cross talk and space transforms for use with optoelectronic devices packaged in standard φ 5.4 mm TO cans. Suppliers are also breaking away from the hermetic TO can to non-hermetic silicon optical bench (SiOB) technology which may increase risk.
The small pitch connectors also have both fibers in a single ferrule while the large pitch connectors have the fibers in separate ferrules or without ferrules in separate v-grooves. The number of ferrules is significant because the ferrules are precision made parts (µm tolerances) and are traditionally the most costly part in the connector. Ferrule material as well as the quantity of material is also an issue. The plastic ferrule connectors should have a cost advantage over the ceramic ones and this advantage should increase as the manufacturing volume increases. However, the ceramic ferrule technology is more mature and the prices are currently falling due to market pressures. New lower cost glass ceramic ferrules are currently being produced. The plastic ferrules are newer and are currently controlled by a limited number of suppliers, resulting in current prices being twice the cost of two of the standard ceramic ferrules. The plastic ferrules are both made with the same, glass filled, thermoset material which must be
transfer molded. Transfer molding is generally slower than injection molding but more accurate some ferrule suppliers are beginning development of low cost injection molded ferrules.
The alignment schemes vary for the connector types and this reflects on the complexity of the transceiver. For the LC connector each ferrule requires a precision bore (5µm/<1µm tolerance for MM/ SM fiber) on the transceiver which may add cost to the transceiver. The single ferrule connectors require two precision pins (0.25µm tolerance) or rails placed at a precision (3µm tolerance) separation, which may eliminate any cost advantage to the transceiver of one fewer bore. The SC-DC connector may have an advantage over the MT-RJ in that it can use either pins or molded plastic rails which may be fabricated as a single unit decreasing both the component and assembly costs. However, for single mode applications the SC-DC may also require metal pins to achieve the high precision required. The VF-45 connector eliminates ferrules; this connector may have ultimate cost advantage over all of the other connectors. However, the transceiver’s optical coupler design does require V-grooves for fiber alignment to the OE devices whose roughness may have tight tolerances especially for single mode applications.
The alignment process in the assembly of the transceiver optical coupler(s) can also be a source of differentiation for the small and large pitched connectors. The two connectors with a single ferrule may have a potential cost advantage in that a single optical alignment may be possible. Even in the case of the VF-45 connector with no ferrule two separate alignments are necessary, one for each v-groove. With a small pitched single ferrule connector it may be possible to reduce the number of parts in the transceiver by placing both transmitter and receiver in a single package and aligning them simultaneously with a single X,Y,Z,θ alignment. The large pitch connectors do not have the fibers placed accurately with respect to each other and therefore require two separate packages for transmitter and receiver and two separate alignments (X,Y,Z). It should be recognized that the alignments may in some cases be reduced to passive alignment which may reduce the cost benefit of having one ferrule.
The transceiver opening is a major concern because of the small form factor transceiver dimensional constraints of 14 mm width, 9.8 mm height, and 31 mm length. The MT-RJ connector requires the least volume in the transceiver, use of the space around the connector is questionable so a key dimension is the length into the transceiver. SC-DC is the shortest, MT-RJ and LC are close behind and VF-45 is the longest. The single ferrule connectors have an added space burden part of the transceiver volume may be necessary to space apart the devices from the small fiber pitch to avoid electrical and optical cross talk in SiOB packages and to accommodate devices packaged in TO cans.
The fiber cable is really only an issue in the case of the VF-45 where 3M claims that the reliability will be much
higher with their special GGP polymer coated fiber cable. All other connectors use standard glass in either ribbon or standard duplex construction.
Field termination can be an important issue for some applications. The ceramic ferrule connectors have standard pot and polish field termination kits so the time and cost to terminate the connectors should not change from standard duplex SC. The single ferrule field termination is accomplished using a pre-polished stub connector with index matching gel. This is available for the SC-DC and planned for the MT-RJ connectors 1Q99. This approach does have the potential to have shorter installation time. The VF-45 connector has a disadvantage because there is no field terminated plug so a jumper must be scrapped if the end is damaged, however if it is used in an environment which necessitates plugs and sockets it does have a simple cleave and polish plug termination where the other connectors all use the plug along with a bushing instead of a socket. Mechanical
High mechanical accuracy of the ferrule alignment surfaces relative to the fiber position is a necessary condition for a connector which uses a ferrule. The "ferrule" of each optical connector was investigated. Samples of five to ten multimode connectors of each type were measured for fiber position in ferrule with respect to alignment reference. Since each one of the connector types is different the measurements are also unique, however all were done with a Nikon QC-4000 measurement system.
The LC ferrule outside diameter was measured at 1.249 mm with a sigma of 2.3 µm. The eccentricity of the fiber to the outside LC ferrule was 4 µm with a sigma of 2.6 µm. The fiber protrusion was 1.1 µm with a signal of 0.5 µm.
The SC-DC connector has a single ferrule and requires that the center to center spacing between the fibers must be very accurate. The measurements showed 0.7501 mm with a sigma of 0.0007mm. The alignment guide diameters and the position of the fibers in the x and y plane with respect to the alignment guide centers was also measured though there is more error in the SC-DC measurement than the equivalent MT-RJ measurement because there is only half of a circle from which to measure the guide center. The guide diameters were measured as 0.695 mm with a sigma of 0.006 mm the x offset was 4.1µm with a sigma of 7.9µm and the y offset was 0.26µm with a sigma of 1.7µm. There was no significant fiber protrusion measured.
The MT-RJ ferrule has similar key mechanical features to the SC-DC. The fiber spacing was measured as 0.752 mm with a sigma of 0.001 mm. The pin hole diameter was extremely accurate; 0.6998 mm with a sigma of 0.8 µm and a pin separation of 2.6005 mm and sigma of 0.9 µm. The X fiber offset was 1.0µm with a sigma of 1.0 µm and the Y fiber offset was 0.6µm with a sigma of 0.5 µm. The MT-RJ ferrule did show an average 1.3 µm fiber protrusion with a sigma of 0.68 µm for connectors from one supplier but no fiber protrusion was measured on connectors from another supplier.
The VF-45 has no ferrule so there weren't comparable measurements to be made. In general all of the ferrules of the connectors were mechanically precise and meet or exceed their specifications. Fiber protrusion varied between connector types and manufacturers. Presently there are open issues in the industry on the correct amount of protrusion and the acceptable effects of environment and plugging on these protrusions.
Functional Test Plan
Pre-assembled 62.5um multimode fiber cables were obtained from the manufacturers of MT-RJ, SC-DC, VF-45, and LC. While every effort was made to request sample cables which were representative of volume production, there is no way to insure that this was the case. The sample size of 30-40 cables from each supplier was chosen in order to allow us to complete 13 industry standard tests on cables from 7 different sources in a reasonable amount of time. Because of the relatively small number of cables tested from each supplier, the resulting data may not be representative of typical product performance; this is reflected by the quality of our Gaussian curve fit to the data (in some cases, we measured values that fell outside the expected 3 sigma limits for our curve fit). For this reason, the data should be viewed as a relative comparison between the different connector designs, rather than as an absolute or production level specification test.
After initial and ship shock testing the cable population was split between the four legs of the test plan presenting different typical datacom stresses. The stresses included axial pull, off-axis pull, plug repeatability, temperature and humidity accelerated aging, temperature cycling, twist, flex, and impact, as outlined in Table 2. Table 2 : Test Plan Outline
CONNECTION LOSS EIA-455-171 Method B, 0.5 dB Max.
SHIP TEST
EIA-455-71, Max. Loss 0.6 dB, -40 to 60 C, 10 cycles CONNECTION LOSS
RANDOM CONNECTION LOSS Loss per EIA-455-171, 0.7 dB Max.
TEMP CYCLE 10 to 60 C 3/hr 500cy CONNECTOR TWIST EIA-455-36 10 cyc. 2.5 kg 500 X INSERTION EIA-455-21 0.5 dB Max. INSERT/ WITHDRAW 80 NT Max. CONNECTOR FLEX EIA-455-1 300 cyc./ 0.5 kg OFF AXIS PULL 1 cyc. 20 N/ 1 m HEAT AGE/ HUMIDITY EIA-455-4B, 5B 336 h 85 C 95 % CONNECTOR IMPACT EIA-455-2 method B, light AXIAL PULL EIA-455-6 90 N min/ 1 m INSERTION WITHDRAW IBM Test Gauge
80 NT Max.
Standard industry test procedures were followed when applicable and are referenced in Table 2. Random connection loss, insertion/ withdrawal, temperature cycle and off axis pull do not have industry standard test procedures. Their test procedures are given below. These additional tests simulate common stresses that are found when connectors are used in the field under raised floors, in racks of equipement and even on the wall outlets.
Ÿ
Random Connection Loss Testing10 random cable assemblies were mated with 10 random couplers to make 10 random cable/coupler assemblies. Each of the 10 cable/coupler assemblies were then mated to each of the remaining cable assemblies (Fig.1). In the case of VF-45 testing the cable/coupler assemblies were replaced with 10 different wall socket assemblies. Assembly losses were measured and recorded for each connection.
Ÿ
Off Axis Pull Testing25% of the samples were mated to a coupler / jumper or wall outlet / jumper and were positioned such that the assembly is placed under tension 45 degrees to it’s connector body (Fig.2).
A 20 cm mandrel is positioned one meter from the back end of the connector (not including the boot) to provide a gentle force application. The connector is then rotated 360 degrees about it’s center while maintaining the 45 degree cable to connector angle. A pull force of 20 N was applied every 45 degrees of rotation ramping from 0 N to 20 N in 5 seconds, holding at 20 N for 5 seconds, and then relaxing to 0 N in 5 seconds. A reference attenuation was taken in the fixture before any stress was applied. The attenuation was recorded at the beginning of the load ramp, at the top of the load ramp, at the end of the 5 second hold time, and at the bottom of the load ramp. Each of the assemblies were stressed for one 360 degree counter clockwise cycle and one 360 degree clockwise cycle. The reported losses are the change from the initial unstressed connection loss reference.
Ÿ Insertion / Withdrawal Testing
Insertion and withdrawal forces required to mate and unmate a cable assembly to an empty coupler or wall outlet were measured on 25% of each connector type by attaching a coupler to a slide rail force gauge. The load was increased at a rate slow enough to accurately measure the force required to latch and extract the connector. The same assemblies were measured both before and after heat and humidity testing.
Ÿ
Thermal Cycling TestJumper / coupler / jumper or wall outlet / jumper / wall outlet assemblies were placed in a temperature cycling chamber. The chamber was cycled between 10 C and 60 C with a maximum rate of 3 complete cycles per hour. A dwell time of 5 minutes must be achieved at each temperature extreme. Assemblies were measured for attenuation at the beginning of test and at the end of every one hundred cycles, until 500 cycles were complete.
Some clarification of the standardized testing is also necessary. For instance the 500 X insertion test was done with a separate populated coupler for the majority of the matings to preserve the test lead coupler for all other testing. The axial pull test procedure included the mandrel wrap holding mechanism and the data was taken as an increase in loss while the load was applied.
The limits of these tests are set by the application specifications; performance which is adequate for fiber-to-the-desktop, for example, may not be adequate for a mainframe or supercomputer environment. The intent of many of the SFF connectors was to replace the SC duplex and thus to have the same or better quality and performance as the SC duplex but half the size. Here we have used the SC duplex test data as the bench mark against which to measure the new SFF connectors. Typical SC duplex manufacturing specifications are placed for reference in the test column in the data tables.
The VF-45 connector offered no coupler which is required to follow the industry standard test procedures so an alternate procedure recommended by the manufacturer was used. Basically it involves measuring the loss of a reference cable, zeroing the instruments and then cuttingthe cable and field terminating sockets to both ends of the connectors reference cable. Measurements are then made by inserting
Figure 1: Random Connection Loss
Source EMS Coupler Detector
SM 62.5 um MM 100 um Coupler
cable 1 (2,3..10)
Source EMS Coupler Detector
Coupler cable 11,12...40 Coupler cable 1 (2,3..10) Test: Reference:
Figure 2: Off-axis pull test set up.
1 m 360 DEGREE ROTATION 45 DEG FROM TEST EQUIPMENT FORCE EXERTED 20 NT 1.22 m DUPLEX COUPLER TO TEST EQUIPMENT CABLE UNDER TEST WRAPPED 2X AROUND A 20 CM DIAMETER MANDREL
the cable under test between the two ends of the reference cable. The two test procedures are shown schematically in figure 31.
The alternate measurement technique makes it difficult to get absolute readings because the test setup can never be re-zeroed so any drifting of the instruments can not be compensated. It also complicates the comparison to industry standard tests which were performed on all other connector types. One proposal is to divide the VF-45 data in half because there are two sockets. That proposal was thought to be too optimistic and masked the situation where a particularly high loss connection was coupled to a particularly low loss connection.
The relationship between the two test procedures was investigated. SC duplex jumper cables were measured using the standard test procedure and re-measured using the alternate test procedure except with couplers instead of sockets. Figure 4 is a plot of the results for each connector using the alternate test procedure versus the standard test procedure.
If the relationship between the alternate and standard measurement techniques was strictly 2X then the SC duplex data would fall on the line. Data above the line is where the standard method gave a loss of less than 1/2 of the alternate method result. Interestingly most of the connectors fell in this region where the 2X method gives this pessimistic measurement of loss. Overall, however no correlation was found between the two measurement techniques.
Results for multimode jumper cables
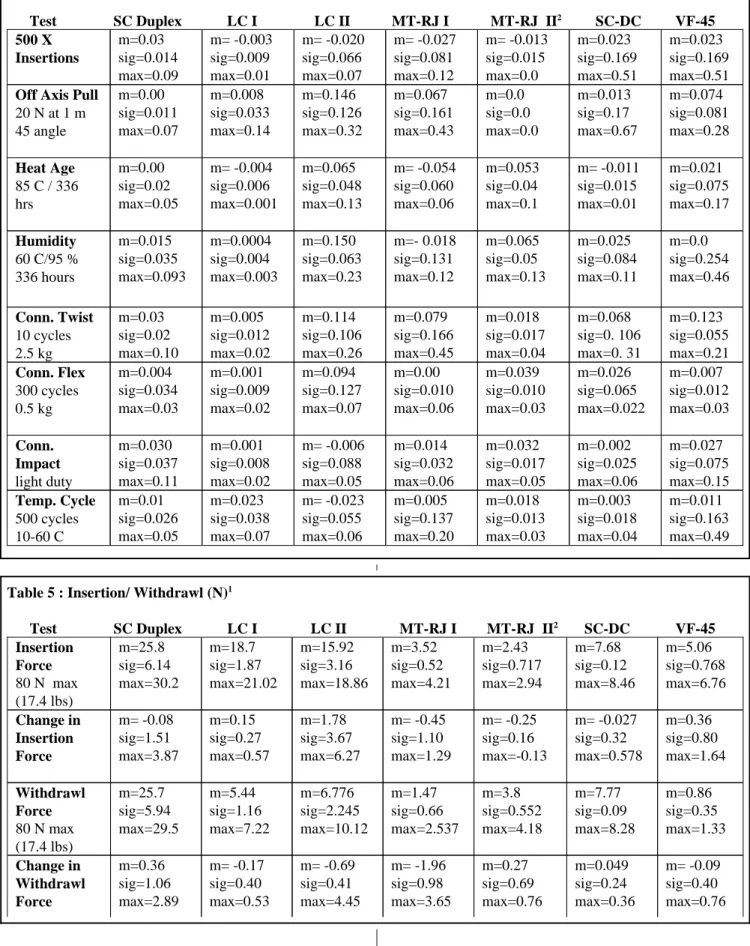
The data was fitted to lognormal curves to estimate median performance and a distribution sigma about the median for the population of connectors tested. These results are summarized in tables below. As a reference SC duplex data is shown. Table 3 shows the total loss data including points taken before during and after the particular stress test. The numbers are absolute values of loss except in the mated axial pull, off-axis pull, twist, and flex where the cables were values reported are excess loss over the unstressed loss of each cable. Data represented in this way shows an average value of how the cables would perform continuously in the field while stresses occurred. Another way to look at the data is to look at the change in the loss before and after the cable was stressed. This data is shown in table 4 and is used to assess the deterioration or possible improvement to the connector by the stress applied.
When available more than one suppliers' cables were evaluated. If the results from two suppliers were similar they were grouped together otherwise they were separated into different columns. SC-DC and VF-45 connectors could only be obtained from a single source. MT-RJ I is data from cables of a single supplier but is representative of data from three different suppliers’ cables. MT-RJ II is data of cables from a single supplier. LC I data is representative of cables from two different suppliers and LC II data is representative of cables from a single supplier.
LC I and LC II cables had the same connector parts but were assembled by two different suppliers. The results show a big difference depending on the assembly process. A small sample of cables assembled by a third supplier tested similarly to the higher performing LC I. The improved performance is attributed to novel polishing technique, use of low eccentricity bulk fiber, and fiber with a harder jacket material in the LC I products.
MT-RJ I cables were not only different assemblies but were different connector designs as well. Two suppliers used the same parts and different assemblies but the third supplier also used different parts. All three suppliers provided cables which performed similarly to the MT-RJ I data. However one of the three suppliers later provided a few cables with design modified parts which improved the cables performance dramatically in all aspects except axial pull which decreased to only 16 N.
The dramatic differences between suppliers is shown in figure 5. In some cases, the gaussian curve fit does not accurately illustrate the performance of the connector. The
1 EMS is equalization mode simulator for MM test in SM tests M/F : Mode Filter is in it's place
.
Standard
Source EMS Coupler Detector
SM (62.5 um/ MM 100 um)
Source Coupler Coupler Detector
Under test EMS EMS Alternate Source Detector SM (9 um/ MM 62.5 um) EMS Coupler Cut here and terminate
Detector
Under test
Socket Socket
Source
EMS Coupler
Figure 3: Standard and alternate connection loss test
Figure 4: Comparison of data from 10 SC duplex cables measured by standard and alternate methods
0.00 0.05 0.10 0.15 0.20 0.25 0.30 0.35 0.0 0.1 0.2 0.3 0.4 0.5 0.6 0.7
Data below line 2X method is optimistic Data above line
2X method is pessimistic
SC duplex data 2X approximation
Loss measured with alternate method (dB)
Loss measured with standard method (dB)
tight distribution of connector loss for the LC I and SC-DC connectors, compared to the rather large and even bi-modal distributions found in the VF-45 and the MT-RJ I connectors. Significant differences were measured for different connector types for the assembly loss, plug repeatability, off-axis pull, and axial pull tests. LC I and MT-RJ II both showed lower losses than the SC duplex and the SC-DC matched the SC duplex for connection loss, random connection, and ship shock. Without the 2X interpretation of the VF-45 data the VF-45 cables were on the high side of the SC duplex performance. Performance of VF-45 connectors were improved slightly by cleaning the connectors before every plug although this is not representative of field conditions. The MT-RJ I and LC II losses were also higher than the SC duplex. A few MT-RJ I cables had high flier points in the 500X insertion test which exceeded 0.6 dB.
Off axis pull showed a small increase in the losses for the connectors as expected but there were high fliers in all but the MT-RJ II which had a smaller sample size. A failure
mode that was observed on a few VF-45 connectors was a very high loss (> 1 dB) due to fibers popping out of the V-grooves.
Axial pull testing was a very interesting area. Both the SC-DC and VF-45 connectors were designed to disengage from the receptacles under an applied pull force above 45 N. The SC-DC samples we tested only held 25. The coupler has been redesigned and should now hold 45 N. The axial pull data shown was taken under these conditions; the connectors unplugged as designed under the 90 N pull force limit of SC duplex. Some MT-RJ I connectors and all LC connectors held 90 N axial pull force, with very little margin, while the MT-RJ II connectors held only 16 N. The magnitude of the pull force is a requirement which will vary depending on the application, however it is essential for all the applications that the cable unplug before the loss increases. All the connectors passed this except for one version of MT-RJ I which actually remained plugged up to 90 N but increased loss by 2 dB.
1 Sample size MT-RJ II : 9 jumper cables total
Table 3 : Comparison of Multimode Small Form Factor Connectors: Total loss
Test SC Duplex LC I LC II MT-RJ I MT-RJ II1 SC-DC VF-45 m=0.445 sig=0.14 max=0.59 m=0.02 sig=0.015 max=0.055 m=0.063 sig=0.016 max=0.09 m=0.241 sig=0.086 max=0.39 m=0.109 sig=0.072 max=0.30 m=0.039 sig=0.032 max=0.09 m=0.028 sig=0.015 max=0.06 Temp. Cycle 500 cycles 10-60 C 0.6 dB max m=0.008 sig=0.012 max=0.070 m=0.017 sig=0.067 max=0.60 m=0.009 sig=0.011 max=0.03 m=0.015 sig=0.033 max=0.10 m=0.047 sig=0.095 max=0.07 m=0.0008 sig=0.007 max=0.05 m=0.004 sig=0.03 max=0.09 Conn. Flex 300 cycles 0.5 kg 0.6 dB max m=0.109 sig=0.057 max=0.21 m=0.062 sig=0.10 max=0.37 m=0.014 sig=0.013 max=0.04 m=0.228 sig=0.078 max=0.36 m=0.084 sig=0.084 max=0.26 m=0.012 sig=0.012 max=0.03 m=0.03 sig=0.02 max=0.10 Conn. Twist 10 cycles 2.5 kg 0.6 dB max 45 N m=0.457 sig=0.276 max=1.22 25 N m=0.06 sig=0.106 max=0.29 16.5 N m=0.007 sig=0.005 max=0.01 45 N m=0.046 sig=0.093 max=0.13 90 N m=0.071 sig=0.146 max=0.49 90 N m=0.069 sig=0.141 max=0.57 90 N m=0.043 sig=0.024 max=0.12 Axial Pull 90 N at 1 m 0.6 dB max m=0.106 sig=0.112 max=0.38 m=0.11 sig=0.242 max=0.80 m=0.001 sig=0.003 max=0.01 m=0.057 sig=0.129 max=0.43 m=0.158 sig=0.119 max=0.48 m=0.009 sig=0.055 max=0.62 m=0.035 sig=0.021 max=0.13 Off Axis Pull
20 N at 1 m 45 angle 1 dB max m=0.350 sig=0.187 max=0.74 m=0.003 sig=0.069 max=0.51 m=0.02 sig=0.018 max=0.09 m=0.150 sig=0.141 max=0.39 m=0.134 sig=0.068 max=0.32 m=0.004 sig=0.006 max=0.02 m=0.038 sig=0.02 max=0.12 500 X Insertions 0.5 dB max m=0.404 sig=0.194 max=0.86 m=0.035 sig=0.019 max=0.09 m=0.047 sig=0.017 max=0.07 m=0.194 sig=0.130 max=0.45 m=0.158 sig=0.119 max=0.48 m=0.008 sig=0.008 max=0.07 m=0.04 sig=0.023 max=0.09 Random Connection 0.7 dB max 3s <0.6 dB m=0.394 sig=0.200 max=0.74 m=0.054 sig=0.033 max=0.31 m=0.048 sig=0.009 max=0.06 m=0.197 sig=0.127 max=0.41 m=0.102 sig=0.085 max=0.29 m=0.006 sig=0.009 max=0.04 m=0.036 sig=0.024 max=0.09 Ship Shock -10 to +40 C, 10 cycles max. 0.6 dB m=0.445 sig=0.175 max=0.72 m=0.046 sig=0.028 max=0.12 m=0.044 sig=0.005 max=0.05 m=0.183 sig=0.128 max=0.38 m=0.111 sig=0.096 max=0.46 m=0.01 sig=0.011 max=0.05 m=0.03 sig=0.021 max=0.10 Connection Loss 0.5 dB max.
1 MT-RJ II sample size: 9 cables -0.8 -0.7 -0.6 -0.5 -0.4 -0.3 -0.2 -0.1 0.0 0 5 10 15 C) VF-45 count Loss (dB) -0.8 -0.7 -0.6 -0.5 -0.4 -0.3 -0.2 -0.1 0.0 0 100 200 300 A) SC Duplex count Loss (dB) -0.8 -0.7 -0.6 -0.5 -0.4 -0.3 -0.2 -0.1 0.0 0 20 40 B) SC-DC count Loss (dB)
Figure 5 - The SC Duplex, SC-DC, VF-45, MT-RJ I , MT-RJ II1, LC I and LC II connection loss graphs.
-0.8 -0.7 -0.6 -0.5 -0.4 -0.3 -0.2 -0.1 0.0 0 10 20 E) MT-RJ II count Loss (dB) -0.8 -0.7 -0.6 -0.5 -0.4 -0.3 -0.2 -0.1 0.0 0 10 20 D) MT-RJ I count Loss (dB) -0.8 -0.7 -0.6 -0.5 -0.4 -0.3 -0.2 -0.1 0.0 0 20 40 60 80 100 F) LC I count Loss (dB) -0.8 -0.7 -0.6 -0.5 -0.4 -0.3 -0.2 -0.1 0.0 0 5 10 15 G) LC II count Loss (dB)
2 Sample size: 9 jumper cables 1
Negative is decrease / positive is increase
Table 4 : Change in loss after stress: Multimode1
Test SC Duplex LC I LC II MT-RJ I MT-RJ II2 SC-DC VF-45 m=0.011 sig=0.163 max=0.49 m=0.003 sig=0.018 max=0.04 m=0.018 sig=0.013 max=0.03 m=0.005 sig=0.137 max=0.20 m= -0.023 sig=0.055 max=0.06 m=0.023 sig=0.038 max=0.07 m=0.01 sig=0.026 max=0.05 Temp. Cycle 500 cycles 10-60 C m=0.027 sig=0.075 max=0.15 m=0.002 sig=0.025 max=0.06 m=0.032 sig=0.017 max=0.05 m=0.014 sig=0.032 max=0.06 m= -0.006 sig=0.088 max=0.05 m=0.001 sig=0.008 max=0.02 m=0.030 sig=0.037 max=0.11 Conn. Impact light duty m=0.007 sig=0.012 max=0.03 m=0.026 sig=0.065 max=0.022 m=0.039 sig=0.010 max=0.03 m=0.00 sig=0.010 max=0.06 m=0.094 sig=0.127 max=0.07 m=0.001 sig=0.009 max=0.02 m=0.004 sig=0.034 max=0.03 Conn. Flex 300 cycles 0.5 kg m=0.123 sig=0.055 max=0.21 m=0.068 sig=0. 106 max=0. 31 m=0.018 sig=0.017 max=0.04 m=0.079 sig=0.166 max=0.45 m=0.114 sig=0.106 max=0.26 m=0.005 sig=0.012 max=0.02 m=0.03 sig=0.02 max=0.10 Conn. Twist 10 cycles 2.5 kg m=0.0 sig=0.254 max=0.46 m=0.025 sig=0.084 max=0.11 m=0.065 sig=0.05 max=0.13 m=- 0.018 sig=0.131 max=0.12 m=0.150 sig=0.063 max=0.23 m=0.0004 sig=0.004 max=0.003 m=0.015 sig=0.035 max=0.093 Humidity 60 C/95 % 336 hours m=0.021 sig=0.075 max=0.17 m= -0.011 sig=0.015 max=0.01 m=0.053 sig=0.04 max=0.1 m= -0.054 sig=0.060 max=0.06 m=0.065 sig=0.048 max=0.13 m= -0.004 sig=0.006 max=0.001 m=0.00 sig=0.02 max=0.05 Heat Age 85 C / 336 hrs m=0.074 sig=0.081 max=0.28 m=0.013 sig=0.17 max=0.67 m=0.0 sig=0.0 max=0.0 m=0.067 sig=0.161 max=0.43 m=0.146 sig=0.126 max=0.32 m=0.008 sig=0.033 max=0.14 m=0.00 sig=0.011 max=0.07 Off Axis Pull
20 N at 1 m 45 angle m=0.023 sig=0.169 max=0.51 m=0.023 sig=0.169 max=0.51 m= -0.013 sig=0.015 max=0.0 m= -0.027 sig=0.081 max=0.12 m= -0.020 sig=0.066 max=0.07 m= -0.003 sig=0.009 max=0.01 m=0.03 sig=0.014 max=0.09 500 X Insertions
Table 5 : Insertion/ Withdrawl (N)1
Test SC Duplex LC I LC II MT-RJ I MT-RJ II2 SC-DC VF-45 m= -0.09 sig=0.40 max=0.76 m=0.049 sig=0.24 max=0.36 m=0.27 sig=0.69 max=0.76 m= -1.96 sig=0.98 max=3.65 m= -0.69 sig=0.41 max=4.45 m= -0.17 sig=0.40 max=0.53 m=0.36 sig=1.06 max=2.89 Change in Withdrawl Force m=0.86 sig=0.35 max=1.33 m=7.77 sig=0.09 max=8.28 m=3.8 sig=0.552 max=4.18 m=1.47 sig=0.66 max=2.537 m=6.776 sig=2.245 max=10.12 m=5.44 sig=1.16 max=7.22 m=25.7 sig=5.94 max=29.5 Withdrawl Force 80 N max (17.4 lbs) m=0.36 sig=0.80 max=1.64 m= -0.027 sig=0.32 max=0.578 m= -0.25 sig=0.16 max=-0.13 m= -0.45 sig=1.10 max=1.29 m=1.78 sig=3.67 max=6.27 m=0.15 sig=0.27 max=0.57 m= -0.08 sig=1.51 max=3.87 Change in Insertion Force m=5.06 sig=0.768 max=6.76 m=7.68 sig=0.12 max=8.46 m=2.43 sig=0.717 max=2.94 m=3.52 sig=0.52 max=4.21 m=15.92 sig=3.16 max=18.86 m=18.7 sig=1.87 max=21.02 m=25.8 sig=6.14 max=30.2 Insertion Force 80 N max (17.4 lbs)
The LC connectors had a high insertion force compared with the other connectors but is still lower than the SC duplex. Most SFF connectors insertion force is around 5 N., while the LC was nearly 16 N. This is still within many application specifications and may be due to it's being a coupled pair of simplex connectors.
All of the different small form factor connectors passed the insertion / withdrawal force testing, heat and humidity accelerated aging, temperature cycling (500 cycles, 10-60 C), temperature shock (-10 to 40 C), and mechanical twist, flex, and impact of the connectors; without difficulty.
Results for singlemode jumper cables
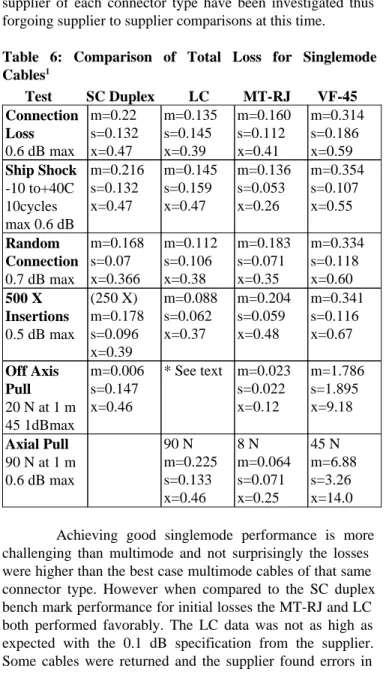
Suppliers were asked to furnish 40 production singlemode jumper cables for testing. The total loss data for the singlemode cables is summarized in table 6. Although singlemode cables were available from more than one supplier for the LC and MT-RJ connectors, cables of only one supplier of each connector type have been investigated thus forgoing supplier to supplier comparisons at this time.
Table 6: Comparison of Total Loss for Singlemode Cables1 Test SC Duplex LC MT-RJ VF-45 45 N m=6.88 s=3.26 x=14.0 8 N m=0.064 s=0.071 x=0.25 90 N m=0.225 s=0.133 x=0.46 Axial Pull 90 N at 1 m 0.6 dB max m=1.786 s=1.895 x=9.18 m=0.023 s=0.022 x=0.12 * See text m=0.006 s=0.147 x=0.46 Off Axis Pull 20 N at 1 m 45 1dBmax m=0.341 s=0.116 x=0.67 m=0.204 s=0.059 x=0.48 m=0.088 s=0.062 x=0.37 (250 X) m=0.178 s=0.096 x=0.39 500 X Insertions 0.5 dB max m=0.334 s=0.118 x=0.60 m=0.183 s=0.071 x=0.35 m=0.112 s=0.106 x=0.38 m=0.168 s=0.07 x=0.366 Random Connection 0.7 dB max m=0.354 s=0.107 x=0.55 m=0.136 s=0.053 x=0.26 m=0.145 s=0.159 x=0.47 m=0.216 s=0.132 x=0.47 Ship Shock -10 to+40C 10cycles max 0.6 dB m=0.314 s=0.186 x=0.59 m=0.160 s=0.112 x=0.41 m=0.135 s=0.145 x=0.39 m=0.22 s=0.132 x=0.47 Connection Loss 0.6 dB max
Achieving good singlemode performance is more challenging than multimode and not surprisingly the losses were higher than the best case multimode cables of that same connector type. However when compared to the SC duplex bench mark performance for initial losses the MT-RJ and LC both performed favorably. The LC data was not as high as expected with the 0.1 dB specification from the supplier. Some cables were returned and the supplier found errors in
production of poor polish and ferrules tuned 180 degrees off their proper alignment. The supplier shipped 5 new samples which performed within their 0.1 dB specification but time did not permit testing a statistically valid sample size. The VF-45 data was taken in the manner described above and so theirs is not a direct comparison to the SC Duplex. The losses for the VF-45 singlemode to the VF-45 multimode however are very consistent with little degradation for the initial tests.
The singlemode connectors showed difficulty with the same tests as the multimode connectors, namely the axial and off-axial pull tests. The VF-45 showed high data on both of those tests. The LC connectors showed a high loss of over 2 dB in the off axis pull which varied depending on pull angle. This is being investigated to see if it is a coupler or a connector problem. The MT-RJ cables performed well on the off axis pull test but the axial pull test showed a disconnection at only 8N (2lbs.) This problem was found to be coupler dependent and the axial pull test results went up to 90N with a different suppliers MT-RJ coupler but the connection loss was higher with that coupler. The LC again held the full 90N of axial pull.
Conclusions
In comparison to the SC duplex connector some of the LC and MT-RJ connectors meet or exceed the SC duplex connector performance over most tests for multimode and singlemode. The SC-DC multimode connectors matched the performance of the SC duplex. The VF-45 connectors were difficult to compare directly but are somewhat higher loss in general than the SC duplex standard. All of the connectors we evaluated would benefit from changes to either the design or production methods in order to meet or exceed the SC duplex, particularly with respect to axial and off-axis pull testing. In the case of axial pull users may need to loosen their requirements for most connector types.
Many of the connectors are undergoing minor design revisions to improve performance and tightening up of assembly procedures across multiple suppliers. The data shows that none of the connectors is a fully mature replacement for SC duplex for both SM and MM performance across all the tests and the different suppliers today.
We found that the connector properties can vary depending on the cable assembly process. Differences in assembly procedure presented different results in the LC thus representing low cost/performance options arising from connector assembly procedures. The MT-RJ I and MT-RJ II differences stem from improvements to the connector design. Both of these results show that high performance is possible with these connector systems but that connectors of various performance levels will be on the market for each type.
Acknowledgments
Our thanks for work on the measurements go out to our lab specialists for their many hours of testing: Rich Huegi and Jim Migliore of Computer Crafts, Sam Thomas of Penn
State Univ. (a summer student at IBM), and Dianne Lacey of IBM T.J. Watson Research Center.
References
[7]
R. Selli et al, "A Novel V-Groove Based Interconnect Technology", Optical Engineering, Vol.37 No 12, Dec.98, pp. 3134. AND TIA FOICS 7.[6]
K. Wagner, SC-DC/SC-QC Connector, Optical Engineering, Vol.37 No 12 , Dec. 98 pp.3129. AND TIA FOICS 11.[5]
Y. Tamaki,et al., "Compact and Durable MT-RJ Connector", Proc 49th Electronic Components andTechnology Conf, San Diego, CA, June 1999 and TIA FOICS
12.
[4]
M.A. Shahid, et al., "Small and Efficient Connector System", Proc 49th Electronic Components and TechnologyConf, San Diego, CA, June 1999 and TIA FOICS 10.