Experiences Evaluating Student Attitudes in an Introductory
Programming Course
Stephen H. Edwards
1, Godmar V. Back
1, and Michael J. Woods
11
Department of Computer Science, Virginia Tech, Blacksburg, VA, US
Abstract—This experience report describes using a val-idated survey instrument to measure changes in student attitudes toward computing across a CS1 course. The choice of the survey instrument is described, with links to online resources for several existing instruments. The setup of a within-subjects design using pre- and post-tests at each end of a semester-long programming course allows changes in attitudes to be assessed. Results from analyzing 197 surveys received over a two-semester period are presented. Most at-titude measures were quite high. The only significant change was an increase in the perceived importance of computing among the students. However, student aversion scores were a significant predictor of student success. Lessons learned are presented along with future plans.
Keywords:Perceptions, Computer Attitudes Survey, CS1
1. Introduction
As at many other institutions, our faculty are constantly striving to recruit a broader population of students, encour-age those with an affinity for computer science to stay in the discipline, and offer them learning opportunities that students find satisfying. This is particularly true in our introductory courses where attrition is the highest. While a student’s decision to major in computer science depends on a number of factors, his or her freshman year—including their first college-level class in computer science (CS1)—plays a crucial role [13].
At the same time, however, it is important to employ appropriate strategies for measuring progress and assessing effectiveness. This experience report describes the methods used and results obtained when trying to assess the impact of curricular changes on student attitudes toward computing in the CS1 course at Virginia Tech.
Recently, our department introduced a new approach to the programming activities and assignments in our CS1 course in order to appeal to a broader, more diverse student audience. Rather than using canned problems from mainstream text-books, we looked to several recurring themes to increase the appeal of computer science [12], [6], [3]: usingreal-world problemsthat are relevant in a student’s life; using problems that show thesocial and societal impactof our discipline; creating solutions that are meaningful to others outside the classroom; employing modern interaction techniques
(such as web-based GUIs and graphical output); and giving
students more creative control and more flexibility in the solutions they create.
The underlying rationale overarching these themes can be stated simply: Students are more interested in solving problems that they find personally relevant, so looking for ways to increase the relevance of assignments across multiple dimensions is important for attracting a broader and more diverse population. We chose to employ new educational materials that allow the use of state-of-the-art Web 2.0 technology in CS1, enabling a new generation of programming activities that combine all of the themes described above. Our hope was to improve the recruitment and retention of computer science students, and to give students in our CS1 course a more positive view of our discipline and its impact.
As part of our plan to evaluate the impact of these changes, we were interested in whether or not there was a significant (positive) change in the attitudes our students hold toward the field of computing. In addition to exploring retention data, course success rates, and changes in student demographics, exploring possible changes in their attitudes will allow us to investigate whether our curricular changes might be giving students a more positive view of our discipline.
This paper reports our initial experiences in gathering and analyzing student attitudinal measures during two semesters of the CS1 course at Virginia Tech. Section 2 outlines CloudSpace, the Web 2.0 infrastructure that makes web-based programming assignments easy in CS1. Related work on instruments to measure attitudes toward computing are discussed in Section 3. Our study design is presented in Section 4, and results are presented in Section 5. The paper concludes with lessons learned over the first two semesters of this evaluation task.
2. Background: CloudSpace
As described in Section 1, the modifications to our CS1 course focus on linking computer science education to real-world contexts that illustrate the social and societal impact of computer science. We also believe that students should be given creative control to produce personally relevant applications that also are usable by others in a meaningful way. Emerging technologies that underlie new Web 2.0 applications and the sleek interaction techniques they enable
create a unique opportunity to provide such relevant context for the teaching of computer science concepts.
Capitalizing on this idea is difficult, however, because most tools for producing Web 2.0 applications are aimed at professional programmers and are not “student friendly.” They presume one has already mastered programming, and are not level-appropriate for use in an introductory course like CS1.
To address this shortcoming, we designed and built Cloud-Space [14], a web development platform that brings Web 2.0 application production down to the level where CS1 students can take advantage of modern techniques while still learning the basics of programming. Using CloudSpace, students can write plain old Java code, and then write a user interface using XHTML with a few custom tags. Student Java code then executes on the CloudSpace server, and the student’s XHTML is automatically transformed into an interactive, direct-manipulation-based, AJAX-style web interface viewable in most modern web browsers.
Through the CloudSpace server, all of the support in-frastructure necessary to take advantage of modern Web 2.0 features is completely encapsulated and hidden from students. The mechanics of the interface layer are completely transparent, so that students need only learn Java (on the programming side) and HTML plus a few custom tags (on the user interface side).
CloudSpace runs every student’s individual web applica-tion in a separate virtual machine, providing full access to basic Java features such as file system access, console output, and exception diagnostics, just as one would have when running Java code locally from the command line. Student code can be run locally and even unit tested in the same way as other plain Java code, and then "skinned" with a modern web-based interface by adding a separate XHTML file. This approach minimizes the number of additional concepts students must learn in order to develop web applications. Beyond regular CS1-level Java programming, they primary addition is learning XHTML and some basic CSS styling— concepts the students are already eager to engage, in many cases.
With CloudSpace, virtually any conventional Java as-signment can be given a web interface. For example, a simple body mass index calculator can be given a web-based facelift, deployed as an interactive web page that dynamically updates its results as different numbers are typed into text boxes. This has the added benefit of deploying the program in a way so that the student can show it off to anyone, including family, friends, or classmates in other courses.
But CloudSpace really shines when it is used to create assignments that speak more directly to the web-based world where students spend time every day. For our CS1 course, we have developed a number of assignments centered on building and extending the features common to many social
networking sites, such as Facebook. We were originally in-spired by an assignment presented at the Nifty Assignments special session at SIGCSE 2008, where Mehran Sahami presented a Facebook-inspired assignment from Stanford University. With CloudSpace, students can build live social networking applications with dynamic AJAX-based features easily, using simple CS1-level Java programming.
Giving students activities with this style of program-ming is important because these web-based applications increasingly determine the public face of computer science because of their ubiquity and their large number of users. We have been using this approach to programming activities successfully in CS1 at Virginia Tech for two years. However, the question of whether these types of assignments affect student attitudes toward the discipline of computing remains, driving the evaluation activities described in the remainder of this paper.
3. Related Work
There is a wide body of research literature on alternative mechanisms for measuring one’s attitudes toward computing that goes back decades. Most such research has traditionally been performed in the field of education rather than com-puter science. However, much of this research is valuable for CS education researchers and is readily available for application in CS courses.
Most often, attitudes towards computing are measured using self-reported answers on a survey instrument. Many such instruments exist; Christensen and Knezek provide an overview of many [1]. Of these, The Computer Attitude Scale (CAS) developed by Loyd and Gressard [10] is one of the most widely used. In addition to providing a measure of general attitudes toward computers, the CAS also provides four subscales measuring one’s anxiety when dealing with computers, confidencein dealing with computers, liking or enjoyment of dealing with computers, and perception of
usefulnessor proliferation of computers on future jobs. The CAS has been used by other CS educators to in-vestigate student attitudes as an indicator for success in a CS1 course. In study at Saint Joseph’s University, re-searchers studied the use of Alice [11], a 3D programming environment, to teach students with a high risk of failure in a CS1 course the basics of software development. In the study, students were grouped into three categories: high risk students who took the Alice course, high risk students that did not take the Alice course, and low risk students that did not take the Alice course. Students were scored using grades, retention to the computer science department, and attitude surveys. Their evaluation results showed that the Alice course offering was an effective educational tool for rasing student’s grades and retaining these high risk students in the computer science department. However, use of Alice did not result in any significant changes in attitude measures on the CAS subscales between pre- and post-test values.
Farkas and Murthy also applied the CAS to measure changes in attitudes across a computer literacy course with an introductory programming component [4]. Students in the course were given the CAS survey at four evenly spaced points ranging from the beginning of the semester to the end of the semester. The study results indicated a statistically significant decrease in positive attitudes toward computing during the first two-thirds of the course, when programming activities were present. The authors concluded that the course did not “seem to be successful in creating a positive attitude towards computers.”
Other CS education researchers have sometimes devel-oped their own instruments. Stuart Hansen and Erica Eddy [5] developed a short survey for use with the computer sci-ence projects at the University of Wisconsin to evaluate the level of engagement and frustration experienced by students. The researchers theorized that a higher level of engagement would correlate with a low amount of frustration. Instead, they found that engaging projects did not result in lower levels of frustration. On further inspection of their results, they did see a correlation between engaging projects and the student’s attitude towards the project’s subject matter.
In education, other instruments are used in some situa-tions. Among them, one is particularly interesting. Knezek and Christensen developed the Teachers Attitudes Towards Computing questionnaire (TAC) by aggregating all or part of a number of other survey instruments with strong track records [1], [2]. The TAC included all of the questions in the CAS instrument. They were particularly concerned with drawing on the best existing work, using validity and internal reliability measures to identify the best-performing instruments. With an initial version containing 284 ques-tions and 32 separately identifiable subscales, the TAC was experimentally assessed for validity[2]. The analysis showed that the 284 question survey actually measured between 4-22 subscales out of 32. Over time, the TAC has been succes-sively refined to remove redundancy and retain subscales with the highest reliability. After reducing the TAC down to 16 subscales, and then ten, recent research is focusing on the seven-factor version of the questionnaire. These factors in-clude enthusiasm, anxiety, avoidance, email, negative impact on society, teacher productivity, and semantic perception of computers. Since its creation, the TAC has been used in multiple studies around the world.[8], [7], [9].
For other CS education researchers, the research web site hosted at the Texas Center for Educational Technology provides electronic access to several independently validated survey instruments for measuring attitudes toward com-puting: http://www.tcet.unt.edu/research/. Complete copies of several versions of the TAC, the Computer Attitude Questionnaire, and several related instruments are available, including full question sets, survey descriptions, lists of references, and scoring procedures.
4. Method
While using the CAS to measure student attitudes is common, we were interested in exploring other potential factors, including perceptions of the field as a viable future vocation. In exploring alternative survey instruments, how-ever, the TAC was particularly attractive, since its developers had focused on subsuming and then refining the best of available instruments into a better composite. However, the TAC did pose three problems. First, some versions of the TAC are quite long, which can be detrimental to survey response rates. Second, the TAC includes some subscales aimed specifically at teachers (e.g., attitudes toward teacher productivity, use of e-mail in classroom management, etc.). Third, as the TAC as evolved and the number of subscales (and questions) has been reduced, many subscales appropri-ate for students (e.g., attitudes toward computing as a future career) have been dropped as being of less interest when surveying teachers.
As a result, we chose to employ a customized version of the TAC that includes subscales we are most interested in, omits subscales specific to teachers, and keeps overall survey length to a practical size. The resulting instrument, which we can call "TAC-lite", includes the entire CAS question set plus six additional subscales. Giving this survey provides the following twelve measures:
• CAS Anxiety indicates one’s anxiety in dealing with computers.
• CAS Confidence indicates one’s confidence in dealing with computers.
• CAS Liking indicates one’s degree of enjoyment when dealing with computers.
• CAS Usefulnessindicates one’s perception of the utility of computers and their prevelance in future occupations. • CAS Overall Score is a combination of the four sub-scales and indicates one’s general attitudes toward com-puters overall.
• Importanceindicates how important you perceive com-puters to be to in your future occupation or work life. • Anxiety is the TAC subscale indicating one’s anxiety
towards computers.
• Acceptance indicates one’s acceptance of (or, alterna-tively, desire to avoid) using computers.
• Vocation indicates one’s perception of computing as a future occupation area.
• Aversionindicates one’s negative opinions about people in the computing field.
• Relevance indicates one’s perception of computing as a relevant topic for study and educational pursuits. All questions included in this TAC-lite survey were Likert-scale questions. Except for the Importance subscale, all questions were answered on a 5-point scale ranging from Strongly Disagree to Strongly Agree. The Importance subscale questions used a 4-point scale without a
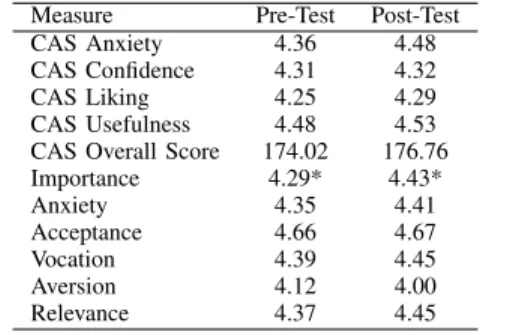
neu-Table 1: Summary of Measures for Fall 2009/Spring 2010
Measure Pre-Test Post-Test
CAS Anxiety 4.36 4.48
CAS Confidence 4.31 4.32
CAS Liking 4.25 4.29
CAS Usefulness 4.48 4.53 CAS Overall Score 174.02 176.76
Importance 4.29* 4.43* Anxiety 4.35 4.41 Acceptance 4.66 4.67 Vocation 4.39 4.45 Aversion 4.12 4.00 Relevance 4.37 4.45
tral/undecided value. The scoring procedure for the TAC was used for all subscales.
After narrowing the TAC to these specific subscales, the corresponding questions were published along with basic demographic questions in an on-line survey. During the fall semester 2009 and spring semester 2010, all students in our CS1 course were given an opportunity to complete the on-line survey once at the beginning of the semester, and again at the end of the semester. A total of four sections of the course were offered each semester, consisting of approxi-mately 200 students in total. The survey instrument is avail-able electronically at http://cloudspace.cs.vt.edu/computer-attitude-survey/.
Participation in the survey was optional for all students. Since our CS1 course is a lab course and lab attendance is mandatory, the opportunity to complete the survey was included as an optional part of the lab activity during the second week and again during the final week. Collecting both pre- and post-test answers to the survey allows a within-subjects comparison to look for changes in each individual’s self-reported attitude data.
5. Results and Discussion
Response rates for the survey were approximately 50%, with slightly more students electing to complete the survey at the beginning of the course, and slightly fewer electing to complete it at the end of the course. A total of 197 completed surveys were received. All subscales except for the CAS Overall Score produce results on a 1-5 scale where 1 is most negative/undesirable and 5 is most positive/desirable. In particular, "negative" subscales, such as Anxiety and Aversion, follow this same pattern (e.g., an Anxiety score close to 5 indicates low anxiety, while a score close to 1 indicates much stronger anxiety). The CAS Overall Score gives results on a 40-200 point scale, where 40 is most negative and 200 is most positive. Table 1 summarizes the scores on the pre- and post-tests.
The most notable aspect of this result is that both the pre-test and post-test attitudes are very positive towards computing compared to most other published studies. This is likely due to the population. About three quarters of
Table 2: Summary of Course Scores by Aversion Level
Aversion Level Proportion of Students Mean Score
>= 4.93 6.7% 89%
>= 3.33 84.0% 70%
< 3.33 9.3% 63%
the students enrolled in our CS1 course are CS majors or prospective majors, and a substantial portion of the remainder are intent on or considering a CS minor. As a result, the incoming population already has definite opinions about the field. It is reassuring to see that their views are so positive. In many other studies, the subject pool is much broader (literacy courses, high school students, introductory courses taken for general education credit by students from many majors, etc.).
To examine changes from pre-test responses to post-test responses, a within-subjects model was chosen so that each student’s post-test answers would be compared against their corresponding pre-test results. We performed an analysis of variance on each subscale using the semester and the pre- or post timing as independent factors. From the point of view of the changes made to our assignments, however, only one indicator shows a significant change between pre- and post-test values at the p = 0.05 level. The Importance subscale shows a small but significant increase in post-test values. The standard deviation for this subscale was 0.51, so the net increase of 0.14 is only 27% of one standard deviation. While statistically significant, the size of this shift is minor. Since our students responded extremely positively on both pre-tests and post-tests, it appears that they already had very positive attitudes toward computing on all of the instrument’s measures coming into the course. Fortunately, the results do not indicate that our programming activities contributed to a more negative perception of computing, as in Farkas and Murthy’s study [4].
Because the responses on all scales were so positive, we also investigated the smaller proportion of students who responded somewhat less positively on the survey. After eliminating all students in the top half of respondents, we repeated the statistical test to see if the lower half of respondents showed any significant changes from pre-test answers to post-test answers. The results were the same, suggesting that trends in the lower half and upper half of the respondents did not diverge.
In addition to examining changes between the pre- and post-test, we also examined whether any of the pre-test scores were useful as predictors of success in the class. Student responses on the pre-test were matched with student final scores in the course. Then a stepwise regression was performed with the score as the dependent variable and the entire set of subscales as the potential factors.
Of all the factors, only one had a statistically significant predictive relationship with final course score: the Aversion subscale. Understandably, students who rated themselves as
being more averse—that is, holding more negative opinions about people in the computing field—were more likely to score lower. Students who rated themselves as less averse were more likely to score higher. Applying an optimal partitioning algorithm revealed three distinct clusters to the students. An upper threshold of 4.93 (out of 5) on the Aversion subscale (indicating someone who has little aversion and a very positive attitude) characterized the top 6.7% of respondents on this subscale. Those students averaged final cumulative scores of 89% (an A- or B+ grade). A lower threshold of 3.33 (out of 5) on the Aversion subscale (indicating someone who is undecided or who has a more negative attitude toward people in the computing field) characterized the bottom 9.3% of respondents on this subscale. Those students averaged final cumulative scores of 63% (an F grade, or a possible course drop/withdrawal).
6. Lessons Learned and Conclusions
We have only begun the process of evaluating the impact of the changes made in this CS1 course, and changes in student attitudes are only one outcome. Since this is a common issue facing many CS educators, however, this experience can be useful in outlining a possible path for others. It has also revealed a number of potential lessons.
One important suggestion for other CS educators is to consider the set of existing instruments when undertaking an attitude survey. Using an instrument that has been published and that has been checked for validity and internal reliability is very helpful, when many researchers cannot afford the time and effort it takes to perform this foundational research on their own custom instruments. There are multiple instru-ments to choose from, and using a common instrument may allow you to consider other published work as a basis for comparison.
It is also important to consider your subject pool. In our case, the incoming students already had very positive attitudes toward computing. It may not be practical to set a goal of increasing their attitudes significantly, since there is so little room for improvement relative to the standard deviations of the measures. However, you will never know where your population truly lies until you measure. In this respect, the effort that we put into the attitude surveys has revealed that students (well, those who elect to complete the final survey) leave the course with very positive attitudes, which is consistent with our goals. Also, there is no evidence that student attitudes weaken (among those who completed the final survey), which is an important concern.
One question this raises, however, is related to attrition. What about students who choose to leave the course (drop the course, withdraw, or just give up and stop attending)? In practice, those students are unlikely to complete the final survey, since they likely have left the class before the last week. This necessarily limits our post-test data to the (voluntary) responses of students who stayed in the course. A
more pro-active mechanism using some kind of "exit survey" for those who drop or withdraw would be an important addition. After all, it is those students who are most likely to have negative changes in their attitudes, but they are also to most likely to skip the final survey.
This evaluation project is a work in progress, and this experience report only describes the results so far based on the first two semesters of survey data. In the future, a more comprehensive analysis that includes retention re-sults (which students progress to the next course, data on dropped/withdrawn students, separate predictor analyses for tests and for programming activities, etc.) will extend this work. As other CS education researchers approach similar problems, however, sharing experiences is the best way to learn from each other’s successes (and speed bumps).
References
[1] R. Christensen and G. Knezek. Internal consistency reliabilities for 14 computer attitude scales. Journal of Technology and Teacher Education, 8(4):327–336, 2000.
[2] R. W. Christensen and G. A. Knezek. Construct validity for the teach-ers’ attitudes toward computers questionnaire.Journal of Computing in Teacher Education, 25(4):143–155, 2009.
[3] J. P. Cohoon. An introductory course format for promoting diversity and retention. In SIGCSE ’07: Proceedings of the 38th SIGCSE technical symposium on Computer science education, pages 395–399, New York, NY, USA, 2007. ACM.
[4] D. Farkas and N. Murthy. Attitudes toward computers, the introduc-tory course and recruiting new majors. InGroup, Sussex University, pages 268–277, 2005.
[5] S. Hansen and E. Eddy. Engagement and frustration in programming projects. InSIGCSE ’07: Proceedings of the 38th SIGCSE technical symposium on Computer science education, pages 271–275, New York, NY, USA, 2007. ACM.
[6] D. Hendrix, D. Umphress, and J. H. Cross. Designing a first-year project course to engage freshman software engineers: An experience report. In Software Engineering Education and Training, 2006. Proceedings. 19th Conference on, pages 25–34, 2006.
[7] G. Knezek, R. Christensen, E. L. Gilmore, H. Kim, A. D. Magoun, C. Owens, C. Morales, B. Moonen, and J. Voogt. Teacher and student attitudes toward information technology in four nations. In J. Price, J. Willis, D. A. Willis, M. Jost, and S. Boger-Mehall, editors, Proceedings of Society for Information Technology and Teacher Ed-ucation International Conference 1999, pages 916–918, Chesapeake, VA, 1999. AACE.
[8] G. A. Knezek and R. W. Christensen. Attitudes toward information technology at two parochial schools in north texas. Technical Report 97.2, Texas Center for Educational Technology, 1997.
[9] G. A. Knezek and R. W. Christensen. Instruments for Assessing Educator Progress in Technology Integration, page 19. 2000 Institute for the Integration of Technology into Teaching and Learning, 2000. [10] B. Loyd and C. Gressard. Reliability and factoral validity of com-puter attitude scales. Educational and Psychological Measurement, 44(2):501–505, 1984.
[11] B. Moskal, D. Lurie, and S. Cooper. Evaluating the effectiveness of a new instructional approach. InSIGCSE ’04: Proceedings of the 35th SIGCSE technical symposium on Computer science education, pages 75–79, New York, NY, USA, 2004. ACM.
[12] L. Rich, H. Perry, and M. Guzdial. A CS1 course designed to address interests of women. InSIGCSE ’04: Proceedings of the 35th SIGCSE technical symposium on Computer science education, pages 190–194, New York, NY, USA, 2004. ACM.
[13] E. Seymour.Talking About Leaving: Why Undergraduates Leave the Sciences. Westview Press, 2000.
[14] M. Woods, G. Back, and S. Edwards. An infrastructure for teaching CS1 in the cloud. In ASEE Southeast Section Annual Conference, 2010.
![Analysis of necessary evolution of the regulatory framework to enable the Web-of-Cells development : [ELECTRA]](data:image/gif;base64,R0lGODlhAQABAIAAAP///wAAACH5BAEAAAAALAAAAAABAAEAAAICRAEAOw==)