National and International Employment
Opportunities for Post School Education and
Training (PSET) School Leavers
By Sina Mualia and Easter Manila-Silipa
Human Resource Development Policy Division
TABLE OF CONTENTS
Executive Summary 3
Introduction 5
1. Employment Opportunities in the local labour market Samoa
2. Employment Opportunities in the international labour market 14
American Samoa 14
New Zealand 16
Australia 20
Other Pacific Island Countries 24
3. Conclusion 25
4. Recommendations 27
5. Appendices 28
Appendix 1:
International Labour Organization Classification of Occupations List Appendix 2:
Table 6(a): Specific local vacancies advertised in local newspapers by Occupational groups for 2006 (excluding company vacancies)
Table 7(a): Specific company vacancies advertised in local newspapers by Occupation groups for 2006
Table 7(b): List of companies that advertised vacancies in local newspapers for 2006 Appendix 3:
Table 9(a): Total vacancies and growth in highly skilled occupations in Zealand (Sept 2006- Sept 2007)
Table 9(b): Total vacancies and growth in skilled occupations in New Zealand (Sept 2006 - Sept 2007)
Table 9(c): Total vacancies and growth semi- skilled occupations in New Zealand (Sept 2006 - Sept 2007).
Appendix 4:
EXECUTIVE SUMMARY
As part of the Samoa Qualifications Authority’s on-going research activities on the Post School Education and Training (PSET) sub-sector in Samoa, a study was conducted on employment opportunities for leavers of Post School Education and Training Institutions in Samoa.
This research on employment opportunities for PSET will be a first for the Samoa Qualifications Authority. The study is written in a readily accessible format to make the data useful for policy decisions, identify trends in employment opportunities and increase the public’s understanding of changes that occur within the labour market.
The objective of the study is to find out what employment opportunities currently exist for school leavers coming out of the Post School Education and Training Institutions in Samoa both nationally and internationally.
It focuses mainly on employment opportunities occurring within the 2006-2007 period due to difficulties in accessing good data from relevant government agencies and foreign diplomatic posts. Where information prior to 2006 has been able to be obtained, such information is also included in the research to help give a bigger picture of the labour market situation over a longer period of time.
The study was conducted mainly through local newspapers, interviews, desk and internet research.
The main findings from the study are as follows:
• Technical and Associate Professional Occupations which include jobs such as lab
technicians, administrative secretaries, bookkeepers, travel consultants and debt collectors accounted for the highest number (i.e., 22%) of local newspaper vacancies in 2006.
• Immediate employment opportunities for PSET school leavers occurred under Groups 4, 5, 7
and 8 of the International Labour Organization’s Occupations Classification List. When combined, these groups accounted for 27% of the total number of 2006 local newspaper vacancies. Jobs under these categories include sales and shop assistants, waiters, cooks, receptionists, record clerks, skills in the trades and drivers.
• Service, Shop and Market Sales Workers are some of the most demanded for occupations in
American Samoa. These include jobs such as waiters, cook and chefs, retail assistants and baby sitters.
• The most demanded for jobs in New Zealand for a 12 month period leading up to September
2007 occurred in the semi skilled areas. A sales assistant produced the highest number of vacancies (i.e., 4111) when compared to other occupations during the specified period.
• The New Zealand Quota Scheme benefited our people in terms of employment in areas such
as personal care, sales horticulture, forestry and fishing.
• The Migration Occupations in Demand List (MODL) as at July 2007 revealed that Australia
currently demands skilled and highly skilled workers.
• Associate Professionals showed the highest employment growth rate (i.e., 8.5%) during the
12 month period leading up to May 2007 in Australia.
• Employment opportunities in Forum Island Countries lie mainly in the hospitality, healthcare
and education areas.
• Citizens of Forum Island Countries which include Samoa are more than likely to seek
employment opportunities in more developed countries such as New Zealand, Australia and the United States.
It is clear from the study that there are quite a few employment opportunities out there for PSET school leavers from Samoa. Work experience and further training can open up even more opportunities.
The study has proven to be somewhat successful in investigating employment opportunities for leavers of PSET Institutions in Samoa.
It is hoped for that continuity of such a study would be undertaken in the future as findings clearly indicate the importance of the post school education and training sector in keeping up with the demands and the rapid changes occurring within the labour market.
INTRODUCTION
The Government of Samoa greatly values the contribution made by the Post School Education and Training (PSET) sub-sector in supporting national and development goals. It has assisted various Post School Education and Training Institutions through the provision of grants that have to a great extent helped the Providers of PSET maintain on-going operations, given the necessity of having a knowledgeable and skilled workforce.
With the establishment of the Samoa Qualifications Authority in 2005, an Agency mandated to coordinate and strengthen the PSET sub-sector, it is therefore necessary to keep Government informed of the investment they have made to PSET within the Education sector. In addition, up to date information needs to be made available to both Government and the Education sector on how the PSET sub-sector is performing. Where it concerns our study, how the sub-sector quickly reacts to labour market signals.
Previous research conducted by the Authority in 2006 revealed that during the period between 2000-2005, student demand for enrolling for programs or courses in PSET institutions continues to increase. 1 The research findings revealed poor results from Providers overall in terms of completion numbers. However, what remains important is whether or not there are enough employment opportunities out there to cater for the mass number of school leavers coming out of these Institutions, regardless of whether they complete their studies or not.
The objective of this study is to basically find out what employment opportunities currently exist for school leavers coming out of the Post School Education and Training Institutions in Samoa both nationally and internationally.
The study will be split into three parts. The first part will look at job opportunities in Samoa. The second part will look at job opportunities in the international labour market, the focus being specifically on American Samoa, New Zealand and Australia as these countries are identified as being countries where most of our people migrate to. An analysis of the data collected will be included under the appropriate sections and a conclusion and recommendations will be given in the end.
1
1. Employment Opportunities in Samoa
This section of the study will look at job opportunities that currently exist in the local labour market. Data presented in this section of the report has been obtained mainly from The Ministry of Commerce, Industry and Labour’s registers of employers and job seekers and research conducted by the Samoa Qualifications Authority’s HRD Policy Unit on 2006 newspapers vacancies, desk and the internet.
Private Sector Employment
Private sector employment in Samoa is quite unpredictable.
The Ministry of Commerce, Industry & Labour (MCIL) is responsible for providing advice and information on employment within the private sector.
The Labour Market Information Unit within MCIL maintains registers for both employers and job seekers and provides a job referral and placement service whereby those who are looking for jobs are referred onto employers who need workers.
The Ministry’s register of employers is updated every 6 months as employers are required to submit half-yearly reports. There are currently 700 - 800 active employers on this register whereas the number on the job seekers register varies from time to time as it mainly depends on the number of people enquiring within the Agency about job vacancies.
For the year 2007 alone, preliminary data indicates a total of 124 names were entered on the ‘job seekers’ register. The range of ages of those that have been on the register has varied between 18 to above 36 since 2002.
Table 1 below indicates the number of people who have registered as job seekers by age group for the years 2002 -2007 with the Ministry.
Table 1: No. of people registered as job seekers with MCIL by age group (2002 -2007)
Age Numbers entered
Below 22 yrs 55 21 - 25 years 227 26 - 30 years 196 31 - 35 years 110 36 and above 208 TOTAL 796
It can be seen from the table that the majority of people enquiring about jobs with MCIL during the last 6 years are within the ages of 21 to 25. This category represents approximately 29% of the total number of people that have registered as job seekers. This is closely followed by the ‘36 and above’ age category with 26% while those in the ‘below 22 years’ age bracket have produced the least number of entries (i.e. 7%) on the register.
The job referral and placement service offered by MCIL works on the principle of matching ‘skills’ and the Ministry currently follows the International Labour Organization’s (ILO) Classification of Occupations List.
Labour market survey reports obtained from the Ministry reveal that the ‘skills’ matching exercise has not always been successful as employers have identified a number of positions that could not be filled due to skill shortages and work attitudes.
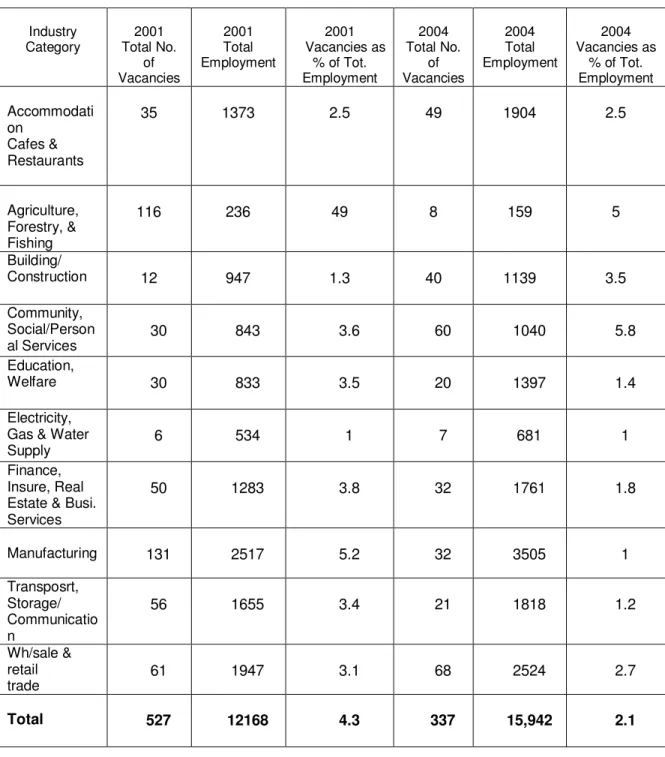
The two published labour market surveys of ‘Private Sector Employers in Samoa’ conducted in 2000 and 2004 revealed employment opportunities in terms of the number of vacancies by industry as well as a proportion of total employment for the years 2000 and 2004.
A total of 554 employers participated in the 2001 Survey whereas 749 employers agreed to take part in the 2004 Survey. Table 2 that follows gives us a look at these vacancies by industry for the two years mentioned.
Table 2: Vacancies by Industry for the years 2001 and 2004 Industry Category 2001 Total No. of Vacancies 2001 Total Employment 2001 Vacancies as % of Tot. Employment 2004 Total No. of Vacancies 2004 Total Employment 2004 Vacancies as % of Tot. Employment Accommodati on Cafes & Restaurants 35 1373 2.5 49 1904 2.5 Agriculture, Forestry, & Fishing 116 236 49 8 159 5 Building/ Construction 12 947 1.3 40 1139 3.5 Community, Social/Person al Services 30 843 3.6 60 1040 5.8 Education, Welfare 30 833 3.5 20 1397 1.4 Electricity, Gas & Water
Supply 6 534 1 7 681 1
Finance, Insure, Real Estate & Busi. Services 50 1283 3.8 32 1761 1.8 Manufacturing 131 2517 5.2 32 3505 1 Transposrt, Storage/ Communicatio n 56 1655 3.4 21 1818 1.2 Wh/sale & retail trade 61 1947 3.1 68 2524 2.7 Total 527 12168 4.3 337 15,942 2.1
As can be seen from Table 2:
For 2001
- vacancies represented 4.3% of total employment positions in the private sector
- Agriculture, Forestry & Fishing (AFF) revealed the highest vacancy rate of 49% as a percentage of total employment, with one employer being identified as needing all 116 workers in the areas of copra cutting and copra collectors.
- Manufacturing followed with the second highest vacancy rate as a percentage of total employment of 5.2% whereas Finance, Insurance and Business Services came third with 3.8% closely tailed by Community, social and personal services in forth with 3.6%.
- In terms of the total number of vacancies alone, Manufacturing offered a lot of job opportunities followed by Agriculture, Forestry & Fishery and Wholesaling & Retailing.
For 2004
- vacancies represented 2.1% of total employment positions in the private sector
- Community, social and personal services took over from AFF, revealing the highest vacancy rate as a percentage of total employment (i.e. 5.8%) followed closely by AFF with 5% and Building and Construction with 3.5%.
- In terms of the total number of vacancies alone, Wholesale and Retail Trade lead with 68, followed closely by Community and Social Services with 60 and Accommodation, Cafes and Restaurants with 49.
Comparison between 2001 and 2004
A proper comparison between the two years cannot presently be made given the number of employers that agreed to take part in the surveys for both years. A comparison of data would thus be misleading and in this instance will not be looked at.
Apart from information provided through these published surveys, latest information from MCIL’s job referral and placement service reveals the following.
The following table provides the latest information from MCIL’s Job Referral and Placement Service during the period of July 2005 to June 2006.
Table 3: Job Referral & Placement Service (Jul 2005 – Jun 2006)
Jul – Dec 05 Jan – Jun 06 Total
Registration 57 89 146
Referrals 22 72 94
Placement 8 25 33
Table 3 shows that 146 people registered as ‘job seekers’ with the Ministry during the period of July 2005 to June 2006. Ninety four (94) people from this total number were referred (i.e., 64%) and only 33 received placements, thereby accounting for approximately 23% of the total number of people registered.
Table 4 below breaks data in Table 3 even further into the Classifications of Occupations List MCIL has adopted from the ILO.
Table 4: Referrals & Placements by Occupational Groups for July 2005 - June 2006 period
GROUP OCCUPATION REFERRALS PLACEMENTS
1 Legislators, Senior Officials and Managers - -
2 Professionals - -
3 Technicians and Associate Professionals - - 4 Clerical & Related
Workers
38 15
5 Service workers & Shop and Market Sales Workers
6 1
6 Skilled Agriculture & Fishery Workers - - 7 Craft & Related Trades Workers 14 4 8 Plant & Machine Operators & Assemblers 9 5
9 Elementary Occupations 27 8
10 Armed Forces - -
TOTAL 94 33
The table above indicates that the majority of referrals during the period July 2005 to June 2006 fell within Group 4 of the Occupations Classification (i.e., 26% of the total number of people registered as ‘job seekers’). This was followed by Group 9 accounting for 18% of total job seekers which included jobs such as domestic helpers, cleaners and transport labourers with Group 7 coming in third 10% with jobs in the crafts and trades occupations.
The ‘placements’ column of the table also appears to be similarly ranked when viewing the figures given.
Currently MCIL’s registers are undergoing review as the Ministry is also looking into establishing a possible labour market information system.
A copy of the ILO classification of occupations list used and adopted by MCIL is attached in Appendix 1.
2006 Samoan Newspaper Vacancies
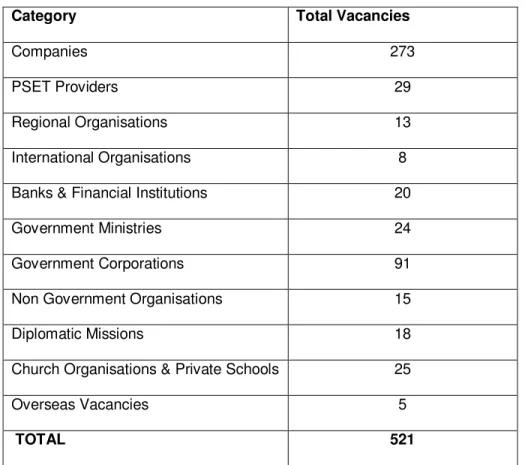
MCIL presently does not compile information on the labour market from local newspapers. Hence the HRD Policy Unit conducted research on local newspapers namely Newsline, the Savali and the Samoan Observer, which produced the following information in Table 5 for 2006.
Table 5: 2006 vacancies in local newspapers by category
Category Total Vacancies
Companies 273
PSET Providers 29
Regional Organisations 13
International Organisations 8 Banks & Financial Institutions 20
Government Ministries 24
Government Corporations 91
Non Government Organisations 15
Diplomatic Missions 18
Church Organisations & Private Schools 25
Overseas Vacancies 5
TOTAL 521
As indicated from the Table 5 above, companies were found to use the newspaper as the medium for advertising their vacancies more than any of the other categories. It occupied more than half (i.e. 52%) of the total number of vacancies for 2006 newspapers whereas government corporations came in second with 17% and PSET Providers in third with 6%.
Table 6 that follows collapses information shown in Table 5 further into the classification of occupations list. However, overseas vacancies have been omitted from Table 6 given the focus of this section of the report on ‘local’ employment opportunities only.
Table 6: Local vacancies advertised in local newspapers by occupational groups for 2006
GROUP OCCUPATION No. of Vacancies
1 Legislators, Senior Officials and Managers 41
2 Professionals 112
3 Technicians and Associate Professionals 139
4 Clerks 83
5 Service workers & Shop and Market Sales Workers
73 6 Skilled Agriculture & Fishery Workers 1 7 Craft & Related Trades Workers 37 8 Plant & Machine Operators & Assemblers 25
9 Elementary Occupations 5
10 Armed Forces -
TOTAL 516
As indicated from Table 6, the majority of local job opportunities lie within the Group 3 category. This equates to 27% of the total number of local vacancies advertised in the newspapers for the year 2006. Group 2 follows closely with 22% and Group 4 in third with 16%.
Such findings as indicated in Table 6 reveal quite a different picture when compared with MCIL’s referral and placement service data given in Table 4. Again, a proper comparison cannot be made given the differences in time frames. However, whereas occupations in Groups 4, 9 and 7 seem to dominate the list in Table 4, occupations in Groups 3, 2 and 4 are much more demanded in Table 6.
Findings from previous research also conducted by the HRD Policy Unit reveal that the majority of students were employed by companies or individuals. Table 7 maps out 2006 vacancies by companies only by occupational groups.
From 74 companies (plus individuals) that advertised vacancies in the newspapers with reference to Table 7, it can be seen that the majority of job opportunities fall within Group 5. This accounts for 22% of the total number of ‘companies’ vacancies which included jobs such as cooks, waiters, kitchen hands, shop assistants, baby sitters and housekeepers. Group 3, in second place with 21% comprised of jobs such as lab technicians, administrative secretaries, bookkeepers, travel
consultants and debt collectors while Group 4 in third place with 18% included jobs such as cashiers, receptionists, telephone operators, shopkeepers and accounts clerks.
Table 7: 2006 newspaper vacancies advertised by companies by occupational groups
GROUP OCCUPATION No. of
Vacancies
1 Legislators, Senior Officials and Managers
21
2 Professionals 31
3 Technicians and Associate Professionals
56
4 Clerks 49
5 Service workers & Shop and Market Sales workers
58 6 Skilled Agriculture & Fishery Workers 1 7 Craft & Related Trades Workers 32 8 Plant & Machine Operators &
Assemblers
23
9 Elementary Occupations 2
10 Armed Forces -
TOTAL 273
Again, quite a different picture is portrayed in Table 7 when the ‘companies’ category is mapped out separately from the other categories shown in Table 5. What can thus be determined from Tables 6 and 7 is that whereas in Table 6, Group 3 type occupations appear dominant in numbers when viewing all of the categories together, Table 7 separating the main category (i.e., companies) reveals that Group 5 dealing with services workers and the like are much more in demand.
In concluding with this section of the report, evidence suggests that the research conducted on newspaper vacancies indicate that Samoa is need of skilled and highly skilled workers. Such vacancies give a bigger and much clearer picture of our country’s labour market situation.
2. Employment Opportunities Overseas
From the period of 1999 - 2005, more than 50,000 Samoans travelled abroad annually for various reasons. Statistics from the Ministry of Finance reveal that during the period 1999 – 2004, approximately 24,381people migrated abroad purely for employment purposes.
Figures for the latest statistics show that for the year 2004 alone, 2,240 people left Samoa for this reason. This number fell by 48% from the previous year with figures revealing a total of 4,334. It is not presently known whether the declining trend continues as Immigration Services had removed relevant information from departure cards that would avail us to capture the figures pertaining to employment and education statistics for 2005 to the present time. However, through collaboration with the Statistics Division within the Ministry of Finance, a push will be made to re-introduce such information on these departure cards as of next year.
This section of the study will look at job opportunities in the international labour market.
Our concentration will rest mainly on American Samoa, New Zealand and Australia as they have been identified as countries where most of our people migrate to for employment purposes. Information has been obtained mainly through the internet with the inclusion of interviews with locals whom have had work experience overseas, and a manager of work program schemes.
(a) American Samoa
Canned tuna processing is by far the largest private-sector employment in American Samoa. The tuna canning industry provided direct employment for more than 4600 workers in 2006 with the majority of workers hailing from Samoa and Tonga, though an exact figure for Samoans alone could not be found. 2
As there are three canning companies in American Samoa, the demand for workers continues to grow given the huge amount of shipments to markets overseas every year.
Immediate employment opportunities currently exist for our PSET school leavers in the canning industry. This remains evident given the number of requests for local workers through advertisements in our local newspapers as well as the employers themselves coming over to look for potential workers earlier on this year.
Other employment opportunities have been identified in the area of childcare or ‘baby sitting’ as it is commonly referred to locally. Interviews held with local women who have returned from working in American Samoa have indicated job opportunities in this area.
However, as quite a few of our people that have been successful with these sorts of jobs, through sheer lack of being properly educated and informed about their employment rights and the
2
p.17 Economic Report, The minimum wage in American Samoa, 2007; US Department of Labour, Employment Standards Administration, Wage and Hour Division, May 2007
obligations of their employers explained that the wages they received from employers could not justify the additional responsibilities they were requested by their employers to carry out in the course of their primary job.
Other job opportunities exist within the tourism and hospitality areas. Vacancies obtained through the classifieds section of American Samoa’s local newspaper Samoa News, revealed positions for cooks and waiters in restaurants, sales assistants for retail shops, bakers for supermarkets, housekeepers for individuals, and heavy machinery operators and labourers for the cargo and shipping areas.
Within the skilled and highly skilled areas, information obtained from local newspapers and through some connections in American Samoa indicate skills shortages in the ‘Trades’ areas, particularly electrical, electronics, air-conditioning, refrigeration and engineering. There have also been teaching opportunities, particularly at high school and Community College levels.
The following table gives information of what the American Samoa job market looks like on a given month from the Samoa News website.
Table 8: Samoa News Vacancies (American Samoa) for period 12/12/07 - 11/1/08
GROUP OCCUPATION No. of Vacancies
1 Legislators, Senior Officials and Managers -
2 Professionals 1
3 Technicians and Associate Professionals 3
4 Clerks 4
5 Service workers & Shop and Market Sales Workers
15 6 Skilled Agriculture & Fishery workers - 7 Craft & Related Trade Workers 7 8 Plant & Machine Operators & Assemblers 3
9 Elementary Occupations 10
10 Armed Forces -
As noted from Table 8, the majority of job opportunities available in American Samoa for the period of mid December 2007 to early January 2008 fall within the Group 5 category, accounting for 35% of the total number of vacancies. The bulk of the jobs indicated fell within the tourism and hospitality industry which comprised of cooks, waitresses and kitchen helpers.
Group 5 is closely followed by the Elementary Occupations under Group 9 with 23%. Job for this group included heavy equipment operators, drivers and labourers.
b) New Zealand
The Department of Labour in New Zealand has responsibilities in all the areas of government relating to employment, immigration, workplace safety and health, accident compensation, international labour issues, and labour market analysis and research.
Where it concerns our study, information relating to employment opportunities in New Zealand can be found in labour market reports published on the Department’s website.
Of particular interest is information obtained through the Job Vacancy Monitoring (JVM) Programme. The JVM Programme represents data from the Job Vacancy Monitor, a monthly analysis of job advertisements published in selected editions of 25 regional newspapers and on selected IT websites. It enables the Department to monitor the number of advertised vacancies in each occupational category over time. Analysis of the JVM suggests that it is an indicator of change in labour market tightness, or change in the degree of difficulty of recruiting staff. An increase in vacancies typically indicates increasing difficulty in recruiting staff and vice versa. 3
Jobs with High Vacancies
Table 9 lists the jobs with the highest numbers of vacancies, for all of New Zealand in the past 12 months leading up to September 2007. It also shows the occupations with the highest growth in vacancies as a percentage change and occupations with the largest numerical change in advertised vacancies.
3
Table 9: New Zealand’s top ranking vacancies and growth in all occupations in the 12 months to September 2007 (All vacancies)
Rank High Vacancy Occupations No of vacancies Top Percentage Growth Occupations Growth (%) Top Numeric Growth Occupations Growth 1 Sales Assistant 4111 Sheep Farmer, Sheep Farm Worker 143% Heavy Truck or Tanker Driver 236
2 Care Giver 2138 Structural
Engineer 120% Packer 224 3 Information Clerk and Other Receptionist
2113 Electrical Fitter 117% Carpenter
and/or Joiner 199 4 Cleaner 1958 English Language Teacher 91% Machine Tool Operator 196 5 General Clerk 1790 Other Mechanical Engineer 91% Care Giver 164 6 General
Labourer 1630 Sawmill Labourer 85%
General Labourer 160 7 Registered Nurse 1592 Machine Tool Operator 84% Cleaner 135 8 Secretary 1591 Building Control/Consents Officer 83% Fork-Lift Operator 121 9 Chef 1542 Farm Machinery Operator Contractor 79% Catering Counter Assistant 115
10 Waiter 1479 Animal Welfare
Worker 79%
Early Childhood Teacher
113
Source: Department of Labour, New Zealand
Note:
1. The ‘total’ number of advertised job vacancies relates to the total number appearing in the JVM sample, rather than the total number of advertisements placed in all editions of all newspapers. See the explanatory notes for further details.
2. The job vacancy counts are based on a three month moving average.
As shown in Table 9, sales assistants are the most demanded for people in New Zealand with vacancies totaling 4111 within the 12 month period up to September 2007, as a three month moving average. This is followed by care givers and information clerks with vacancies just above 2000.
For those jobs scoring high in the percentage growth occupations, sheep farmers are at the top of the list with 143%, followed by structural engineers at 120% and electrical fitters at 117%.
It should be noted that growth in vacancies compares the number of advertised vacancies in September 2007 with September 2006. Percentage growth figures are only included in the table if at least 24 vacancies were advertised in September 2006.
Top numeric growth occupations refers to the occupations that are only included in the table if there were at least 10 more vacancies for a particular occupation in September 2007 than September 2006. For the numeric growth occupations, heavy truck or tanker drivers produced a score of 236, followed closely by packers with 224 and carpenters and joiners at 199.
From looking at Table 9 overall, it can be concluded that the highly demanded for jobs in New Zealand during the 12 month period leading up to September 2007 within the three categories presented in the table fall mainly in the skilled and semi-skilled occupations.
To view total vacancies in New Zealand in terms of highly skilled, skilled and semi-skilled occupations, please refer to the Tables in Appendix 3.
To view job vacancies by skill level over a longer period of time so as to detect possible trends, Figure 1 below gives a picture of the skill demanded in New Zealand for the September month from 2003 to 2007.
Figure1: Total number of vacancies, by skill level Need to insert graph from the internet!
Figure 1 clearly reveals that as far back as 2003, for the month of September, New Zealand has demanded an enormous amount of semi skilled workers more so than skilled or highly skilled workers.
Clerks, sales people and plant and machine operators have been top of the agenda for many businesses when advertising for vacancies in the semi-skilled area during the month of September since 2003.
For those in the skilled area, people with experience in trades such as building, metal and machinery and in the professions of finance and sales also did well when job-hunting during this period whereas a mixture of professional expertise in fields such as science, engineering and teaching were some sought after by employers in the highly skilled category.
Table 10 in Appendix 4 shows the total monthly vacancies by occupation for the September month from 2003 to 2007 according to the skill level.
The New Zealand Quota Scheme
The Department also operates a ballot quota system under the Immigration Section of which Samoa has benefited from for quite a number of years. Many changes have been made to the Scheme over a period of time by the New Zealand government. Nonetheless, it has opened up opportunities for many of our people to gain employment in New Zealand and eventually become residents of the country.
People interested in employment opportunities under the New Zealand Quota Scheme must apply to the New Zealand Immigration Services of the New Zealand High Commission in Apia. Once registration is completed, the names of successful applicants are given numbers which then go into a draw and are entered into a computerized system. The system then automatically random selects numbers, the idea being to be fair to all applicants and hence enables each applicant to get a chance to get selected.
Because the Quota System is a working program, its impact is that migrants are able to be drawn from a cross section of Samoan society and not just the highly skilled.
Information obtained from the New Zealand Immigration Services Manager Ilaoa Lauano in Apia has revealed that the 1,100 placements awarded to Samoans each year usually fall short of the maximum. One positive impact is that it has allowed for New Zealand employers to travel to Samoa to do the recruitment of workers themselves.
For the last two years (2005-2006), the types of jobs people under the Scheme have been successful in obtaining include the following:
1. Sales and service station attendants (with BP Shell)
2. Meat process workers (with Canterbury Meat Products)
3. Bus Drivers (with Manna Coaches, nationwide)
4. Fish processors (with Talleys Fish Processing Company that specializes in processing mussels, seafood and fish packing)
5. Forestry workers (for a Forestry Company in Rotorua and Taupo)
6. Horticultural workers (in Kerikeri and throughout New Zealand) as well as
7. Care Givers (for a Care Giver Company called Radius Healthcare, nationwide)
c) Australia
The Department of Employment and Workplace Relations (DEWR) provides the government with high quality advice, programmes and services to achieve three outcomes:
1. Efficient and effective labour market assistance. 2. Higher productivity and higher pay workplaces. 3. Increased workforce participation.
DEWR, like New Zealand’s Department of Labour produces information obtained from job vacancies around the country. However, unlike New Zealand, DEWR focuses more on skilled vacancies, hence its name, ‘the Skilled Vacancies Index’ or SVI. The SVI concentrates on accumulating information for 18 skilled occupational groups for each State and the Northern Territory. However, because the DEWR’s published labour market updates do not list these jobs in detail, information on the Migration Occupations in Demand List (MODL) obtained from the Australian Immigration website allows us to view the types of skilled jobs identified by DEWR that are in short supply in Australia.
Table 11 below gives the total number of these specific types of skilled jobs in demand for migration purposes as at 30 July 2007. The skilled jobs are classified in accordance to the Australian Standards Classification of Cccupations (ASCO).
Table 11: Number of Specific types of Migration Occupations in Demand (MODL) as at 30 July 2007.
GROUP OCCUPATION No. of Vacancies
1 Legislators, Senior Officials and Managers 4
2 Professionals 47
3 Technicians and Associate Professionals 1
4 Clerks -
5 Service workers & Shop and Market Sales workers
-
6 Skilled Agriculture & Fishery workers - 7 Craft & Related Trade workers 46 8 Plant & Machine Operators & Assemblers -
9 Elementary Occupations -
10 Armed Forces -
TOTAL 95
As indicated from the table above, the majority of skilled level employment opportunities demanded for in Australia lie mainly in Groups 2 and 7. The ‘professionals’ group accounted for nearly half of the list (i.e., 49.5%) which included jobs for accountants, pharmacists, midwives, nurses, dentists, pathologists and quantity surveyors.
The ‘crafts and related trades workers’ group on the other hand accounted for 48% of the list’s total. Specific types of occupations demanded for under this group comprised of aircraft maintenance engineers, automotive electrician, bakers, boat builders and repairers, cooks, gasfitters, hairdressers, vehicle painters and wall and floor tilers.
Only child care coordinators under Group 1and chefs for Group 3 were the only occupations in demand during the July 2007 period.
In condensing the list above further, information obtained from the workpermit.com website reveals that as of November 2007, the following occupations listed below were the most demanded for in all Australian states. This thereby indicates that leavers of Samoan PSET Institutions who undertook ‘trades’ courses would do very well in Australia if employment opportunities were to be offered immediately by employers in Australia.
Most demanded for occupations in all Australian states.
1. Automotive Electrician 2. Fitter
3. Furniture Upholsterer 4. Metal Fabricator (boil maker) 5. Metal Mechanist (1st class) 6. Panel Beater
7. Sheet Metal Worker 8. Tool maker
9. Vehicle Painter 10. Welder
The Department of Employment and Workplace Relations’ website, (www.workplace.gov.au) also contains updated information on the Australian labour market. In particular, DEWR makes available to the public quarterly labour market (LM) updates intended to help people who may be looking at working in Australia on a temporary or permanent basis.
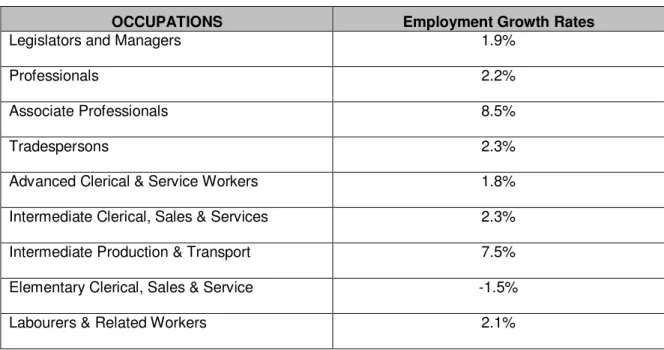
It is often easier for a job seeker to obtain a job in an occupation which is experiencing strong employment growth than one growing only slowly or declining. Information contained in Table 12 below extracted from the July 2007 Australian LM update shows the percentage growth rates in employment in Australia for a 12 month period up to May 2007.
Table 12: Percentage Growth Rates in Employment (May 2006- May 2007)
OCCUPATIONS Employment Growth Rates
Legislators and Managers 1.9%
Professionals 2.2%
Associate Professionals 8.5%
Tradespersons 2.3%
Advanced Clerical & Service Workers 1.8% Intermediate Clerical, Sales & Services 2.3% Intermediate Production & Transport 7.5% Elementary Clerical, Sales & Service -1.5%
As seen from the table, the largest increases in employment occurred for Associate Professionals with 8.5%. This accounted for an increase of 106, 500 jobs. Intermediate Production and Transport Workers followed with 7.5% (up by 62, 900) while Professional jobs increased by 43,000 thereby showing a growth rate of 2.2%.
Unemployment rates
The unemployment rate for occupational groups generally reflects skill levels. Highly skilled occupational groups experience lower rates of unemployment while higher unemployment rates are generally associated with less skilled occupations. The unemployment rates (for those who had worked for two weeks or more in the past two years) by occupational group are presented in descending skill order in Table 13 below.
Table 13: Unemployment Rates as at May 2007
OCCUPATIONS Unemployment Rate
Legislators and Managers 1.2%
Professionals 1.2%
Associate Professionals 1.5%
Tradespersons 2.1%
Advanced Clerical & Service Workers 0.7% Intermediate Clerical, Sales & Services 3.1% Intermediate Production & Transport 3.2% Elementary Clerical, Sales & Service 4.2%
Labourers & Related Workers 6.8%
Future Job Prospects
The LM update also contains information relating to future job prospects. Future job prospects depend on many factors, some of which are difficult to predict. Prospects differ between and within states and territories and can very quickly change.
Table 14 contains future job prospect ratings for the period to 2011-2012. The ratings are based on employment trends and projected growth, unemployment rates, SVI trends (where available) and other data. As the information is purely forecasted, information should therefore be used with caution.
Table 14: Future Job Prospects to 2011- 12 by Occupational Group Occupational Group Prospects to
2011-2012
Occupational Group Prospects to 2011-2012 Managers and Administrators Associate Professionals Child care Coordinators G Building, Architectural & Surveying Associates G
Finance Managers G Dental Therapists, Technicians & Hygienists
G
IT Managers G Enrolled Nurses G
Professionals Financial Deals & Brokers
G
Accountants G Medical Technical
Officers
G Chemical Engineers G Metallurgical
Technicians & Mine Deputies G Computing Professionals G Qualified Chefs G General Medicine Practitioners G Tradespersons Medical Imaging Professionals
G Bakers & Pastry Cooks
A Mining & Materials
Engineers
Bricklayers G
Occupational Therapists
G Cabinet Makers G
Pharmacist G Carpenters & Joiners G
Physiotherapist G Electricians G
Primary School Teachers
G Hairdressers G
Registered Nurses G General Mechanical Engineering Tradespersons A Registered Mental Health G Motor Mechanics G
Registered Midwives G Plumbers G
Secondary School Teachers
G Printing Machinists BA Social Workers G Refrigeration & Air
Conditioning Mechanics
G
Specialist Medicine Practitioners
G Textile & Footwear Machine Operators
BA
d) Opportunities in other Pacific Island nations
During the Forum Economic Ministers’ Meeting (FEMM) in July 07 held in Palau, it highlighted that labor movement has largely been from Forum Island Countries (FICs) to the more developed countries such as New Zealand, Australia and the U.S. Movement within the FICs has been largely based on the demand for workers outpacing supply, for example, in hospitality, healthcare and the teaching professions.4
The types of jobs demanded for in countries such as Fiji, Vanuatu and Tonga would be very similar to those indicated for Samoa’s labour market although scales would differ due to population differences.
4
CONCLUSION
Findings from this study have clearly identified the types of jobs and employment opportunities there exist in Samoa as well as abroad for our PSET school leavers.
For Samoa, evidence suggests that employers demand more skilled and highly skilled workers more so than semi-skilled and low skilled workers with the majority of employment opportunities lying within Group 3 of the Occupations Classification List. These include jobs such as lab technicians, administrative secretaries, bookkeepers, travel consultants and debt collectors
Immediate employment opportunities for PSET school leavers occurred under the semi-skilled to skilled area groups that include record clerks, sales and shop assistants, cooks, drivers, and those with skills in crafts and trades.
Job vacancies from 2006 local newspapers also give a bigger and much clearer picture of Samoa’s current labour market situation particularly as the registers maintained by the Ministry of Commerce, Industry and Labour offers only a job referral and placement type service.
For American Samoa, the majority of employment opportunities fall within the Service Workers & Shop and Market Sales Workers Occupations. These include jobs such as waitresses, cooks, kitchen hands and baby sitters.
A great demand is also noted for those within the trades profession such as electricians, engineers and tradespeople with skills in air conditioning and refigeration.
For New Zealand, information provided by their Department of Labour clearly indicates that the most demanded for jobs in New Zealand during the 12 month period leading up to September 2007 fell mainly in the semi-skilled occupations. Jobs with the highest vacancies for all of New Zealand for the 12 month period were sales assistants, care givers and clerks.
Sheep farmers, structural engineers and electrical fitters were the top occupations showing high percentage growths whereas heavy truck/tanker drivers, packers and carpenters and joiners produced were amongst the high numeric growth occupations.
The Quota Scheme also benefited our people in terms of employment. Areas included personal care, sales, forestry, horticulture and fishing.
For Australian, it was noted that the country was presently in need of skilled and highly skilled people. The Migration Occupations in Demand List (MODL) revealed Australia’s need for
‘professionals’ such as accountants, pharmacists, midwives, nurses, dentists, and quantity surveyors and ‘trades’ people such as automotive electricians, fitters, panel beaters, tool makers, welders and vehicle painters.
It was also interesting to find out that the Australian government also rated future job prospects. Jobs such as child care coordinators, IT managers, primary school teachers, nurses, dental therapists, and quite a few in the trades are occupations that were given a good rating in the future for job seekers.
For employment opportunities in other Pacific Island nations, discussion in relation to our study during the Forum Economic Ministers’ Meeting held in Palau in 2007 confirmed that Samoans are more than likely to move to more developed countries such as New Zealand, Australia and the U.S. in search of employment opportunities more so than to other Pacific Island nations.
The meeting also highlighted that demand for workers in Pacific Island nations occurred mostly in the hospitality, healthcare and the teaching professions.
Overall, the study has proven to be somewhat successful in finding out what employment opportunities currently exist for leavers coming out of Post School Education and Training Institutions in Samoa both nationally and internationally despite difficulties with accessing relevant data from good sources.
As mentioned earlier in the report, latest statistics for Samoa (2004) show that 2,240 people left the country for employment purposes overseas. The portion of this number that represents PSET school leavers cannot be determined due to the type of data collected by a few Government agencies. What remains clear is that this number will presumably grow if more opportunities for employment were made available to our people to migrate overseas, let alone PSET school leavers.
Evidence to suggest this is supported by the amount of Samoan people seen daily in the waiting area of the New Zealand High Commission’s Immigration services floor as well as the lists of names of people displayed outside the ground floor of the Government Building awaiting advice from the Prime Minister’s office regarding jobs under New Zealand’s recognized seasonal employment scheme (RES).
Immigration laws and current employment agreements or the lack thereof existing between countries can sometimes place barriers on our people gaining access to more employment
opportunities overseas. The local labour market currently cannot accommodate for the huge influx of students leaving school or PSET Institutions each year.
It therefore becomes necessary to explore ways to make this possible, particularly given high annual remittances of which have assisted Samoan families to a large extent. Some members of these families may include high school drop outs and those who have come out of PSET Institutions but cannot find work. How to go about this will possibly require another study.
RECOMMENDATIONS
However, at this point in time given the findings from the study, the following is recommended.
1. That this study be used as a basis for continuing research into employment opportunities for PSET leavers in the future. Perhaps the document can be updated on a bi-annual basis.
2. That the Authority work closely with the Ministry of Commerce, Industry & Labour to expand their Labour Market Unit’s services to include compiling and analyzing job vacancies from local and international newspapers and
3. For the Authority to explore avenues of having its qualifications be somehow recognized conjointly with PSET Institutions such as the Australian Pacific Technical College (APTC) to enable our local people become recipients of internationally recognized qualifications (i.e., in this case Australia) so as to improve their migratory chances overseas.