COTIPMO: A COnstructive Team Improvement Process MOdel
Pongtip Aroonvatanaporn, Supannika Koolmanojwong, and Barry Boehm Center for Systems and Software Engineering
University of Southern California Los Angeles, California, USA {aroonvat, koolmano, boehm}@usc.edu
Abstract—Team synchronization and stabilization are essen-tial – especially for large software projects. However, often little is done to assess and reduce the uncertainties and knowledge gaps that exist within the project. As the project progresses through its life cycle, the team can gain more information about the project and team’s capabilities. These necessary data can be obtained through performing assessments on the team and project. As these assessments procedures are often complex, discouraging, and difficult to analyze, an effective framework and tool support can greatly enhance the process. Hence, with improved assessment methods, software project teams can quickly gather the necessary data, determine the actions to improve performance, and result in an improved project outcome in the end. The COnstructive Team Improvement Process MOdel (COTIPMO) is a framework developed to effectively improve team synchronization and stabilization as well as project effort estimation and scoping by enabling software development teams to quickly track project progress, continuously assess team performance, and make adjustments to the project estimates as necessary.
Keywords-process model; cost estimation; continuous assess-ment; project planning; team synchronization and stabilization
I. INTRODUCTION
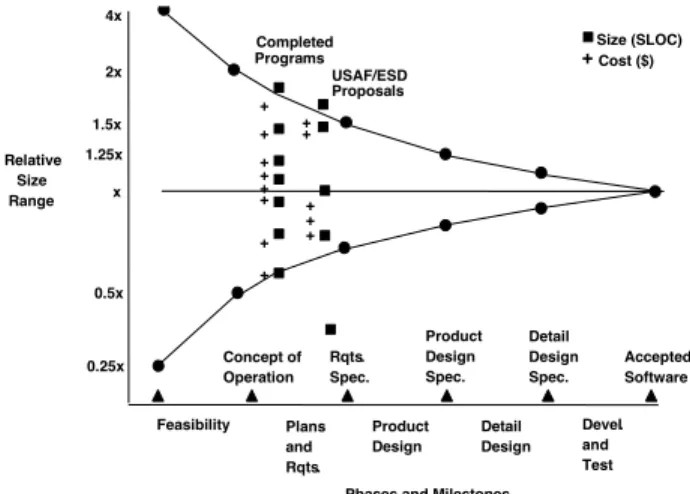
As defined in [1], the well-known software “cone of uncertainty” problem in Fig. 1 shows that until the product is delivered, there exists a range of product that the project can result in. Essentially, the wider the “cone of uncertainty” is for the projects, the more difficult it is for projects to ensure accuracies of products and timely deliveries.
For highly precedented projects and experienced teams, one can often use “yesterday’s weather” estimates of com-parable size and historical productivity data to produce fairly accurate estimates of project effort. More generally, though, the range of uncertainty in effort estimation decreases with accumulated problem and solution knowledge within a “cone of uncertainty”. For less experienced teams and unprecen-dented projects, however, these data are not readily available. To date, there have been no tools or data that effectively monitor the evolution of a project’s progression within the cone of uncertainty or to aid software development teams in narrowing the cone of uncertainty for their projects.
To address these problems, we have developed a routine, semi-automated framework and tool support called COn-structive Team Improvement Process MOdel (COTIPMO).
The framework helps track software project progress and reduce uncertainties as the project progresses through its life cycle by integrating the COCOMO II estimation models in [2], the Unified CodeCount (UCC) in [3], and continuous assessment concepts. Referring to the “Cone of Uncertainty” in Fig. 1, the focus of the assessment framework will be from the product design period onwards. Prior to this period, there are many factors that contribute to the uncertainties such as conceptual understandings, requirements volatility, technologies, and available resources. During the product design, we can assume that the requirements are stable to some extent; thus, the development teams contribute the majority of impacts to the uncertainties from this phase onwards.
II. TERMS ANDDEFINITIONS
For the scope of our research and this paper, we define the following terms as follows:
Development projectrefers to the type of projects where
the product must be developed from scratch. The develop-ment team must write the majority of the source code to implement the end user functionalities.
NDI-intensive project refers to the type of projects that
aim at integrating and/or tailoring either one or a set of nondevelopmental items (NDI) or commercial off-the-shelf (COTS) products. As defined in [4], this is when 30-90%
Size (SLOC) +Cost ($) + + + + + + + + + + + + + 4x 2x 1.5x 1.25x x 0.25x 0.5x Relative Size Range Completed Programs USAF/ESD Proposals Feasibility Plans and Rqts. Product Design Detail Design Devel. and Test Concept of Operation Rqts. Spec. Product Design Spec. Detail Design Spec. Accepted Software
Phases and Milestones
of the end user features and capabilities are provided by the NDI or COTS products.
Team synchronizationrefers to the level of consistencies
among the team members with respect to their awareness of each other’s understandings, knowledge, experience, and capabilities. The focus is on how well the team members work and coordinate with each other in unison.
Team stabilization refers to the level of uncertainties
that exists within the team and project. The focus is on the number of unknowns that could potentially prevent the team from performing effectively.
III. PROBLEMS ANDMOTIVATION
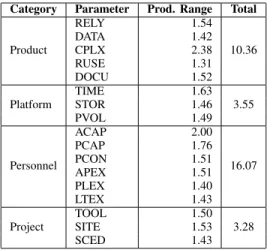
When software development teams lack the proper data and experience, they cannot accurately assess project sizes and team capabilities. These unknowns and uncertainties can typically be reduced with proper assessments as the project progresses. Unfortunately, team assessments are of-ten overlooked even though personnel uncertainties ofof-ten have significant influences on the cone of uncertainty. Table I shows the productivity range of the COCOMO II parameters representing their magnitudes of impact on estimations and schedules. It is clear that human factors have the most sig-nificant impact; therefore, synchronization and stabilization within the development team is essential.
A. Imprecise Project Scoping
Without proper data and experience, software develop-ment teams usually generate inaccurate estimates of the ef-fort required for the product to be developed. As a result, the teams are required to renegotiate with the clients to ensure that the product to be developed is within the scope achiev-able by the development team. This problem is apparent especially in the schedule-as-independent-variable (SAIV) development paradigm in [5] where project deadlines are fixed.
When projects begin with the initial overestimation of resources or effort required, the teams must negotiate with
Table I. COCOMO II PRODUCTIVITYRANGE Category Parameter Prod. Range Total
Product RELY 1.54 10.36 DATA 1.42 CPLX 2.38 RUSE 1.31 DOCU 1.52 Platform TIME 1.63 3.55 STOR 1.46 PVOL 1.49 Personnel ACAP 2.00 16.07 PCAP 1.76 PCON 1.51 APEX 1.51 PLEX 1.40 LTEX 1.43 Project TOOL 1.50 3.28 SITE 1.53 SCED 1.43
the clients to reduce the size of the projects. This often results in clients needing to throw away some of the critical core capabilities of the product, thus, losing some of the expected benefits they had hoped for from the completed project.
On the other hand, when projects underestimate the re-sources, the teams tend to over promise the goals that the project can achieve. As the project progresses to the end of its life cycle, the team may start to realize that the remainder of the project is more than they can manage to complete. When this happens, one scenario is they try to satisfy the client by attempting to complete the project as quickly as possible, while the quality of the project may suffer greatly from this attempt and result in higher long-term maintenance costs. Another scenario is they end up delivering a project that is not complete; thus, leaving the clients with unusable or unsustainable products.
B. Project Estimations Not Revisited
During the initial estimation for software projects, the teams, especially for inexperienced teams and unprecen-dented projects, typically do not have sufficient data to carefully analyze and perform the necessary predictions. These missing pieces of information include aspects and characteristics that are specified in the COCOMO II cost drivers and scale factors. In most cases, the project estima-tion turns into a constant value at the time that the project enters the development phase.
Usually, the only estimation activities that are done for the project are based on early assessments with insuf-ficient information. As the projects proceed through the development phase, the status and progress of the projects are not assessed and re-assessed by the team in order to analyze the accuracy of the initial estimates. Although the project status maybe reviewed by the stakeholders during the major milestones, the team usually does not perform minor assessments throughout the project life cycle as discussed in [6]. There are significant levels of uncertainties at the beginning of the project as there are instabilities in concepts, requirements, choices of COTS products and cloud services, and directions that the project can proceed on.
C. Manual Team Assessments are Tedious
The tasks of manually assessing the project progress are tedious and discouraging to the team due to the amount of effort required and complexity. In order to collect enough information to have useful assessment data, the teams often need to perform various surveys and reviews to determine how well the team had performed in the previous iterations [6]. In processes with high maturity level ratings such as CMMI levels 4 and 5, development teams already must constantly go through various quantitative and qualitative assessment tasks to ensure high level of quality and
perfor-mance. These procedures can take up significant amount of time and effort to perform effectively.
Furthermore, to accurately report the progress of software development projects in traditional processes, the teams are required to carefully count the number of source lines of code (SLOC) they have developed at major milestones, analyze the logical lines of code, and compare them to the estimates that they had created initially. These tasks require significant amount of effort to collect the necessary information to evaluate the initial estimations performed for the project and to identify how well the team is actually performing.
Traditional assessment methods can discourage the team from constantly performing assessments of the project status due to tedious and complex work. This usually leads to inability to effectively detect issues and inconsistencies within the team and project. As a result, teams may waste significant amount of effort working in inconsistent states. D. Limitations in Software Cost Estimation
Regardless of what software cost estimation technique is used, there is little that the technique can compensate for the lack of information and understanding of the software to be developed. As clearly shown in [2], until the software is delivered, there exists a wide range of software products and costs that can affect the final outcome of the software project. Without proper understanding of the parameters in the software cost estimation models, software development teams would end up providing values they “think” are correct or simply done by guessing.
In addition to the fact that the initial estimations lack the necessary information to achieve accurate estimates, the software design and specifications are prone to changes throughout the project life cycle as well, especially with an overenthusiastic client or in a more agile software engineer-ing environment. Software cost estimation models cannot automatically adapt, or compensate, to these unknowns and changing environments.
E. Overstating Team’s Capabilities
When teams are inexperienced in the use of software estimation models, they fail to understand all the parameters that exist in those models even after coaching, mentoring, and tutorials. In COCOMO II, the 17 cost drivers and 5 scale factors require thorough understanding in order to correctly specify the values for them. Project planners often end up with unrealistic values for the parameters or may end up guessing the values instead. These result in unrealistic estimations of the software projects.
Furthermore, from the business point of view, people tend to be over optimistic about their estimations. Team’s capabilities are misrepresented in project proposals causing wide gaps between what business customers want versus what the team can deliver. This again introduces problems discussed in section III-A.
IV. RELATEDWORK
A. Software Sizing and Estimation
In agile development, sizing is commonly done using story points in [7] and assigning weights to each story. The story points are then used in determining the team’s velocity. At the end of each iteration, the team can evaluate its velocity and correct the errors in estimation for future iterations. Re-estimation is done only when developers feel that story sizes have changed, not when development takes longer than expected. Planning poker in [8] is also another common method for planning each iteration; however, in order to plan effectively, it requires expert opinions and analogies.
The Program Evaluation and Review Technique (PERT) sizing method in [9] focuses on sizing the individual com-ponents. The estimation technique requires the developers to provide the optimistic, most likely, and pessimistic sizes of the software. The PERT method reduces the bias towards overestimation and underestimation, although people tend to choose the “most likely” estimates towards the lower limit, but the actual product sizes cluster towards the upper limit. Based on [1], this underestimation bias is due to the following reasons:
• People are optimistic and have the desire to please. • People do not have complete recalls of past experiences.
• People are not familiar with the entire software job. The Wideband Delphi Technique in [1] is an alternative method to the Delphi Technique in [10] to broaden com-munication bandwidth among team members to address any uncertainties. However, the process requires experts’ knowledge extensively. The estimations are presented to the experts to discuss on places where estimations vary.
The COCOMO-U covered in [11] extends the COCOMO II model to allow estimating with uncertainty by using the Bayesian Belief Network. It enables estimations to be done with COCOMO II even when there are unknown parameters. However, the method also relies heavily on expertise of its users in specifying the uncertainties of the cost drivers and scale factors appropriately.
B. Project Tracking and Assessment
To date, there are many project tracking and assessment methods. Presented in [12], PERT is well-known for han-dling large and complex projects as it places emphasis on the time involved to complete tasks instead of specific start and end dates. The PERT network chart allows project teams to manage the uncertainties within the project because critical paths can be identified and updated making the progress of the project visible to the stakeholders. However, considering the number of tasks and potential dependencies within the project, the network charts can grow large and unusable fairly quickly. Once the charts grow too large, they are often disregarded for project management.
Another popular approach for progress tracking and mea-surement is the Goal-Question-Metric (GQM) in [13]. The GQM captures the progress from the conceptual, operational, and quantitative levels allowing the method to align with the organization environment as well as project context. However, the GQM is only useful when used correctly by specifying the appropriate goals, questions, and measure-ments to be monitored. Otherwise, the measuremeasure-ments can be meaningless and impractical.
Furthermore, the Earned-Value Management (EVM), burn up, and burn down charts in [14] are good for capturing the project progress based on team’s velocity and completed features. However, these approaches are not effective at responding to major changes during each iteration.
V. THECOTIPMO FRAMEWORK
The COTIPMO framework consists of 3 sub-frameworks that together aim to improve project tracking, project estima-tion, team synchronizaestima-tion, and team stabilization through-out the project life cycle.
A. Project Progress Tracking
The first part of the framework is to help unprecedented projects and teams track their progression through the project life cycle. This helps the project teams reduce the uncer-tainties of estimations and achieve eventual convergence of the estimated and actual effort spent on the project. For development projects, the framework integrates the UCC tool and the COCOMO II model to allow quick progress tracking and estimation based on the amount of source code developed. Details of the model can be found in [15]. This framework enables the team to track the progress of the project based on the actual work done and computes new estimations based on those data.
Furthermore, for NDI-intensive projects, the framework utilizes the Application Point model of COCOMO II in [2] for effort estimation and progress tracking. Instead of tracking the number of lines of code written, the model would track the number application points developed, which include the number of screens, reports, and third-generation language (3GL) components.
B. Continuous Team Assessment
Team synchronization and stabilization are essential to successful project outcomes because knowledge gaps and inconsistencies among the developers are common problems in team projects. The second framework is an assessment technique to aid in reducing those gaps in order to help sta-bilize the team and project understandings. The methodology is based heavily on the IBM Self-Check concept in [16], a survey-based approach effective for detecting and narrowing the knowledge gaps among the team members.
We have developed a method to assess team’s perfor-mance in the following areas:
• Requirements engineering
• Business case analysis
• Architecture and design development
• Planning and control
• Feasibility evidence
• Personnel capabilities • Collaboration
Questions have been developed focusing on identifying team’s strengths, weaknesses, and issues in order to help synchronize team understandings and stabilize team per-formance. The survey questions do not contain right or wrong answers; however, they ask each developer for their opinions and their perspectives on the team’s capabilities and performance. Similar to the IBM Self-Check approach, each team member would answer the survey questions individually. The deviation and mismatches in the answers are used to determine weak and inconsistent areas and the team must identify actions to resolve those issues.
The COTIPMO assessment framework currently consists of 42 questions. We utilized 2 approaches to develop the survey questions. The first approach was to analyze the USC Software Engineering graduate student projects by conducting team assessments for individual team members to evaluate their team’s strengths, weaknesses, and issues focusing on the various areas mentioned earlier. The assess-ment was done with the software engineering projects during the 2009 and 2010 academic years. These assessment data were then analyzed and the critical ones were picked out and categorized into their respective categories. The questions were developed to address the knowledge gaps and potential issues that commonly occurred within these assessment data. Since the questions were derived from teams’ strengths, weaknesses, and issues, they are focused mainly to help resolve team issues and stabilize team performance.
In the second approach, we adopted questions from [17]. The research consists of 2 frameworks - SE Performance Risk and SE Competency Risk - which show that the effectiveness of software engineering practices can be as-sessed both by the performance of systems engineering (SE) functions and the competency of the personnel performing those practices. Both frameworks are currently used in the industry for assessing and analyzing the capabilities of the project personnel and for identifying potential risks and weaknesses that should be addressed. The questions adopted from these frameworks focus on evaluating the capability of the team as a whole as well as the individual members. This is to establish that the major concerns are identified and addressed by ensuring that the project team has sufficient capabilities and experience.
Moreover, since the SE Performance Risk and SE Com-petency Risk frameworks cover various aspects of systems and software engineering practices, we use them to verify and validate the questions derived in the first approach. Because the first approach focused specifically on team
synchronization and stabilization, we were not able to adopt the questions directly from the SE risk frameworks as they were geared towards analyzing performance and competency of personnel. However, we compared the various aspects of the performance and competency risks with our set of custom questions to make sure that the risks and concerns in software engineering practices are properly addressed. This is to ensure that the all of the assessment questions that we use are consistent with the industry practices.
C. COCOMO II Estimation Adjustment
As mentioned in section III-B, using the COCOMO II estimation model often does not reflect the actual project situations because planners do not have the necessary un-derstandings of the estimation model. The third framework aims to help development teams adjust their COCOMO II estimates to reflect reality. This can be done through the survey-based assessment framework described in the previous section and in [6] because answering series of questions is a more effective means of reflecting the actual project status compared to simply providing values for the COCOMO II parameters.
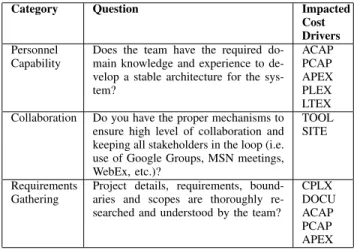
The questions developed for the survey-based assessment method contain correlations to the COCOMO II cost drivers and scale factors. Each question impacts either one or multiple COCOMO II parameters where some may impact certain parameters more than others. As team members answer the survey questions, the framework analyzes the answers and provides suggestions on changes to be made to the team’s COCOMO II estimates to reflect the way they answered the survey. Table II shows a selected set of sample assessment questions and the corresponding COCOMO II cost drivers that are impacted. Detailed discussions of all the assessment questions are beyond the scope of this paper.
To determine the relationship and impact factor between the survey questions and the COCOMO II parameters, we use expert’s advice by surveying a group of COCOMO II experts and experienced users. For each survey question, the expert would identify the COCOMO II parameter that is impacted. Weights were applied to the level of expertise and experience of the person surveyed in order to justify valuable inputs and reduce bias. These data were then combined and averaged resulting in the weight, or impact factor, that each survey question has on the COCOMO II parameters. Based on these impact factors, the COTIPMO framework analyzes the assessment data and computes the adjustments that should be made to the COCOMO II ratings.
VI. USING THECOTIPMO FRAMEWORK
In the COTIPMO framework, the project assessment is expected to be done consistently throughout the project life cycle to help development teams monitor their progress, while reducing any uncertainties and knowledge gaps within
Identified issues and actions Estimated
PM
Framework data Sub-method Review survey results Perform survey assessment Development project estimation NDI-intensive project estimation Re-iterate Re-iterate Adjust COCOMOII parameters Activity Legend:
Figure 2. Workflow of the COTIPMO framework
the team. The duration between each assessment, or itera-tion, can be specified based on the team’s preferences or as necessary. The monitoring mechanism can help teams ensure the feasibility of the project timeline and encourages the team to re-negotiate or re-scope the requirements, features, or budget if needed. Figure 2 shows the workflow of the COTIPMO framework. The development projects and NDI-intensive projects utilizes different methods for computing the estimated effort as discussed in section V-A. The differ-ent approaches are discussed later in this section. However, both types of project follow the same assessment method and team synchronization process of the framework for performance and estimation improvements.
A. Framework Support for Development Projects
For development projects where the majority of the source code needs to be written by the development team, the COTIPMO framework relies on the UCC tool to help track project progress and compute new project estimates. As discussed in section V-A, the integration of the UCC tool allows for development teams to quickly view their progress based on the source code developed, and the framework uses
Table II. SAMPLE ASSESSMENT QUESTIONS WITH CORRESPONDING
CO-COMO IICOST DRIVERS
Category Question Impacted
Cost Drivers
Personnel Capability
Does the team have the required do-main knowledge and experience to de-velop a stable architecture for the sys-tem? ACAP PCAP APEX PLEX LTEX Collaboration Do you have the proper mechanisms to
ensure high level of collaboration and keeping all stakeholders in the loop (i.e. use of Google Groups, MSN meetings, WebEx, etc.)?
TOOL SITE
Requirements Gathering
Project details, requirements, bound-aries and scopes are thoroughly re-searched and understood by the team?
CPLX DOCU ACAP PCAP APEX
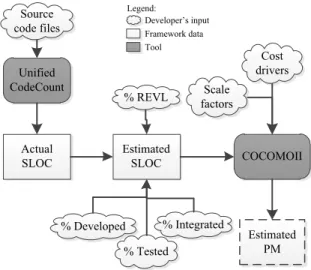
those data to compute updated, more accurate estimates for the project as shown in the workflow process in Fig. 3.
Based on the information known at the beginning of the project, the development team specifies the modules to be developed and all of the corresponding COCOMO II driver ratings for each module. As the project progresses, the development team can make adjustments to the estimated source lines of code (SLOC) and COCOMO II parameters as necessary. However, once the source code development has begun, the team can utilize the benefit of the UCC tool, which automatically counts the total number of logical lines of code for each source code file. The framework uses the accumulated SLOC and converts it into equivalent effort using the COCOMO II model. The developers then provide the percentage developed, tested, and integrated for each module. All of these data are used to compute the new estimated effort required to complete the project.
For each iteration, the development team is required to assess the team’s performance and status by performing survey-based assessments. Each team member fills out and submits the surveys individually without knowing each other’s answers. This is to prevent any bias in the answers. The standard deviation is computed to detect any inconsis-tencies between the answers for each question. Since each survey question has been designed to focus on the individ-ual’s view on the team’s performance and project status, a high deviation in answers means that there exist differences in opinions or understandings within the team. Flags are triggered for questions with high answer deviation raising issues for the team to discuss. The team then develops actions to take in order to resolve those issues in the next iterations as prolonged inconsistencies and differences in understandings among the developers can result in critical problems later in the project.
Finally, based on the survey results, the COTIPMO frame-work provides the team with suggestions on the adjustments that should be made to the COCOMO II parameters. The suggestions are reflective of the consolidated answers given by each team member, and since each survey question has different levels of impact on each of the COCOMO II parameters, these suggestions are computed based on the relationship discussed in section V-C. The adjusted parameters create more realistic estimations for the project. B. Framework Support for NDI-Intensive Project
With the integration with the UCC tool to help track actual project progress, the COTIPMO framework is highly beneficial to development projects. However, the framework also has strong support for NDI-intensive projects as well. Conceptually, the use of the COTIPMO framework is the same as with the development project. Instead of providing the detailed information for modules, source code, and COCOMO II parameters, the development team provides the number of application points – screens, reports, and
third-Unified CodeCount Actual SLOC Estimated SLOC COCOMOII Estimated PM Source code files % REVL % Developed % Tested % Integrated Scale factors Cost drivers Developer’s input Framework data Tool Legend:
Figure 3. Workflow for development projects
Actual NAP Estimated NAP COCOMOII Application Point Estimated PM # Screens % Developed % Tested Developer’s input Framework data Tool # Reports # 3GL Components Productivity Rate Developer’s experience and capability ICASE maturity and capability Legend:
Figure 4. Workflow for NDI-intensive projects
generation language (3GL) components – as well as their experience and tool support levels. Using the COCOMO II Application Point model, the effort required to complete the project is computed based on these information. Figure 4 shows the process workflow that NDI-intensive projects follow for tracking and estimating the effort.
For each iteration, the development team provides the number of application points developed up to that point as well as the corresponding percentages developed and tested respectively. The survey-based assessment is also required to be completed individually by the team members, which is exactly the same as that for the development projects. However, based the results of the survey, the COTIPMO framework provides adjustment suggestions for the developer’s capability and experience and the integrated computer-aided software engineering (ICASE) maturity and experience levels. These are the two dynamic parameters that affect the productivity rate of the team and the estimations
of the project. C. Tool Support
Having an effective tool to support the framework is essential in enabling software teams to utilize the framework to its potential. The COTIPMO tool has been developed using the IBM Jazz technology in [18] to support the framework. The Jazz platform has been chosen for its capabilities and extensibility including support for team and user managements as well as high collaborative environment. Detailed discussion of the tool is beyond the scope of this paper.
VII. OBTAINING THEDATA
The application of the framework was done in a classroom environment using the data obtained from the keystone team project graduate software engineering course sequence CSCI577ab at USC. In the course, students learn through experience how to use good software engineering practices to develop software systems from the exploration to the operations phases.
Each year, teams of five or six on-campus and one or two off-campus students are formed to develop projects for real-client. The on-campus students generally come directly from undergraduate programs with less than 2 years of working experience. Nearly all off-campus students are full-time professionals with at least 5 years of experience. The clients are primarily various USC departments, neighbor-hood corporations, and nonprofit organizations. Typically, the on-campus students act as operational concept engineers, requirements engineers, software architects, UML modelers, coders, life cycle planners, and feasibility analysts, while the off-campus students act as Integrated Independent Verifica-tion and ValidaVerifica-tion (IIV&V) personnel, quality assurance personnel, and testers.
The course consists of both development projects and NDI-intensive projects. Depending on the scopes and com-plexities, the projects are completed either within a 12-week (1 semester) or 24-12-week (2 semesters) schedule. After the teams gathered and negotiated their requirements, they used the COTIPMO tool to define number of iterations and milestones. We specified the length of each iteration to be one week long, while the milestones correspond to the Incremental Commitment Spiral Model milestones in [4]. The teams used this tool weekly to report the development progress as part of their progress report. For each week, each team member answered a general project progress survey. For each milestone, a more in depth survey is generated in order to assess the milestone achievements and performances. As the projects progressed in the semester, the teams continuously recalibrate the cost and schedule estimations based on the improvements suggested by the COTIPMO tool in order to reflect the teams’ statuses and performances.
The COTIPMO framework and tool have been deployed at USC during the Fall 2011 semester. The semester con-sisted of 79 graduate students making up 13 project teams of which 5 were development projects and 8 were NDI-intensive projects. By the end of the semester, 4 projects were completed with products completely delivered to the clients, while the remaining projects continued onto the next semester. The students were surveyed to observe the feedbacks and effectiveness of the use of the framework and tool.
VIII. ANALYSIS
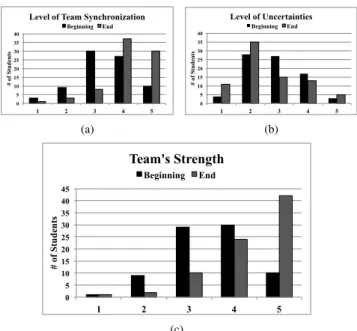
Fig. 5 shows the results of the 79 graduate students surveyed. The surveys focused on the way the students reflected on their teams in the aspects on synchronization, stabilization, and strengths. We asked the individual team members to rate his/her own team on the following cate-gories:
• Level of team synchronization in understanding and knowledge
• Level of uncertainties in project
• Team’s strength and performance
• Level of effort reduction in resolving risks, team incon-sistencies, and project issues
As shown in Fig. 5(a) and Fig. 5(b), the majority of the team members felt that their teams had been much more synchronized as the project progressed through the semester, while the levels of uncertainties that existed within the teams and the projects had reduced. Additionally, with better synchronization and stabilization process, Fig. 5(c) clearly shows that the teams’ strengths had significantly increased at the end of the semester compared to the beginning. Of all the students surveyed, 80% of them said that they were more satisfied with the team and the project at the end of the semester, 13% were indifferent, and 7% were less satisfied possibly due to unresolvable issues among the team members. Currently, we only focused on how the framework improved the members’ perspectives on their team’s status and project performance over time. We have yet to compare these results with the historical data.
Furthermore, Fig. 6 shows that effort required by the teams to resolve project related issues have been remarkably reduced as the teams continued to use the COTIPMO tool throughout the semester. The students were asked to evaluate the level of effort required to address and resolve issues in the areas of a) risk resolution, b) communication and understandings, and c) project issues and defects. The as-sessment method of COTIPMO allowed the teams to quickly identify problems that existed within the teams as well as gaps in knowledge and understandings that existed among the team members. It allowed the teams to address those issues more effectively because they could be detected early before becoming critical problems.
0 5 10 15 20 25 30 35 40 1 2 3 4 5 # of S tu d en ts
Level of Team Synchronization Beginning End (a) 0 5 10 15 20 25 30 35 40 1 2 3 4 5 # of S tu d en ts Level of Uncertainties Beginning End (b) 0 5 10 15 20 25 30 35 40 45 1 2 3 4 5 # of S tu d en ts Team's Strength Beginning End (c)
Figure 5. Survey results of 79 students (13 projects). (a) shows the level of synchronization within the teams (1 = unsynchronized, 5 = highly synchronized). (b) shows the level of uncertainties that existed within the team (1 = low uncertainties, 5 = high uncertainties). (c) shows the level of team strengths (1 = low, 5 = high).
0 5 10 15 20 25 30 35 No
reduction reduction Little Average reduction More reduced Greatly
# of S tu d en ts Effort Reduction
Risk resolution Team synchronization Project issues
Figure 6. Reduction of effort required to address/resolve 1) risk resolution, 2) team synchronization, and 3) project issues
In addition to the positive feedback received from the Fall 2011 students, we have also compared the use of the COTIPMO tool with the previous years during Fall 2009 and 2010 semesters when the tool was not utilized. For every week during the project life cycle, each team member was required to report the effort, in hours, they spent on the project activities in the following categories: 1) operational concepts development, 2) requirements engineering, 3) de-sign and architecture, 4) planning and control, 5) feasibility evidence analysis, 6) quality management, 7) testing, 8) communication and synchronization, and 9) performance control. Shown in Fig. 7 is the average effort spent by each person on the project during each week in the semester. The effort required for the projects in Fall 2011 was significantly
0.00 5.00 10.00 15.00 20.00 25.00 30.00 35.00 40.00 1 2 3 4 5 6 7 8 9 10 11 12 H ou rs Week #
Average Effort Distribution Fall 2009 Fall 2010 Fall 2011
Figure 7. The average effort by week
0.00 10.00 20.00 30.00 40.00 50.00 60.00 70.00 80.00 Oper ation al C once pts D ev. Requ ireme nts En ginee ring Design and A rchitec ture Dev . Plan ning an d Con trol Feas ibili ty Evi denc e Anal ysis Quali ty M anage ment Testing Comm. an d Syn c. Perfor man ce C ontrol H ou rs
Average Effort by Activities Fall 2009 Fall 2010 Fall 2011
Figure 8. The average effort by activities
reduced in each week compared to that of the previous years. Moreover, we also analyzed the average of the total effort spent on each of the activities shown in Fig. 8. In many of the activities such as operational concepts development, require-ments engineering, planning and control, and feasibility ev-idence analysis, the average effort spent were slightly lower than the previous years. Since the amount of work required to perform these activities remain the same across all three years, it is expected that the average efforts only show some slight reduction. However, the most significant reduction in the average effort was in the areas of communication and synchronization. The level of effort required for the team members to synchronize with each other and to stabilize the team’s knowledge and understanding had greatly decreased. The COTIPMO tool and framework provided the teams with an effective mechanism to detect inconsistencies within the team and help reduce knowledge gaps that existed. With this, the teams could quickly resolve those issues and focus more attention on completing the project instead having to waste effort in trying to work in an unsynchronized team.
Finally, the clients were surveyed at the end of each semester for their satisfactions on the teams and the projects. Based on their evaluations, more clients were satisfied with the project overall in Fall 2011 compared to the previous years. More importantly, one project in Fall 2011 was
initially planned for a 24-week schedule, but based on the progress tracking and re-estimations reported by the COTIPMO tool, they were able to determine that the project only required half the resources and could be completed within a 12-week schedule instead. The project immediately proceeded with the development and the product was de-livered to the client with 100% of end user functionalities implemented. In the previous years, when projects had to switch from a 24-week to 12-week schedule, they required major re-scoping of features and capabilities in order to meet the new deadlines.
IX. THREATS TOVALIDITY
Representativeness of projects. Most projects were
small-sized e-services projects, which may not represent the industry at a larger scale. Nonetheless, the projects were done for real clients with real fixed schedules and costs. Also, all projects followed the same incremental development process and project activities that are used in the industry.
Representativeness of personnel. The majority of the
student project teams consisted of members with less than 2 years of industry experience. Although the on-campus students may be less experienced, the off-campus students and clients were working professionals. Furthermore, the verification and validation processes were done by the off-campus students to help ensure the integrity of the project artifacts.
Validity of assessment data.Since many of the survey
questions were derived from strengths, weaknesses, and issues observed from software engineering students, the assessed data may not be valid in the industry. We will be verifying the assessment questions with the experts in the industry as part of our future work.
Changes in life cycle process from 2009 - 2011. The
life cycle process remained largely the same from 2009 to 2011. A minor change in the requirement negotiation process was introduced during the Fall 2011 semester with the use of a new negotiation tool and Planning Poker concept in the requirement prioritization process. However, the core process and practice were still based on the WinWin process in [19], [20], and [21].
Additionally, the team size had reduced to 6 team mem-bers instead of 7 memmem-bers from the previous years. This may have slightly affected the level of synchronization required among the team members. However, observing the level of effort reduced in communication and synchronization, we feel that the decrease in 1 team member would not have had such significant impact.
X. CONCLUSIONS ANDFUTUREWORK
We have developed a team improvement framework for continuous assessment to aid in the team synchronization
and stabilization process by reducing the levels of uncertain-ties that exist in the project and among the team members. The unknowns and uncertainties in the project can be greatly reduced with the use of proper assessment mechanisms. However, since team assessments can be tedious, labor intensive, and require high level of expertise and time for data analysis, they are often overlooked as effective means for team improvements.
The COnstructive Team Improvement Process MOdel, or COTIPMO, was introduced to help software development teams reach a higher level of synchronization and stabi-lization without having to go through complex processes. It consists of three main parts:
1) Project progress tracking 2) Continuous team assessment 3) COCOMO II estimation adjustment
The process framework provides mechanisms for the team to quickly track their project progress based on the amount of development completed and to detect issues and knowledge gaps within the team through its quick assessment method. As the team continuously performs the assessment through-out the project life cycle, uncertainties are reduced, while team and project understandings increase. Additionally, the framework provides suggestions to the adjustments that should be made to the COCOMO II estimations created by the team. This allows the development team to continuously monitor the accuracy of their project estimates and make rational adjustments to them as necessary.
The framework provides strong support for both develop-ment projects and NDI-intensive projects. For developdevelop-ment projects, the COTIPMO framework relies on the UCC tool to report the project progress based on the SLOC developed and uses the COCOMO II estimation model for effort con-versions. For NDI-intensive projects, on the other hand, the framework uses the COCOMO II Application Point model to track the number of screens, reports, and 3GL components completed by the developers. The assessment framework of COTIPMO analyzes the team’s survey assessment data and provides improvement suggestions to the parameters used for estimation calculation in both COCOMO II models.
We introduced the COTIPMO framework and deployed the tool to the USC’s graduate software engineering course consisting of 79 graduate students and 13 projects. As shown in our analysis, the utilization of the COTIPMO framework and tool provided the teams with the mech-anism to effectively synchronize and stabilize the teams in various areas such as communications, understandings, and performance. With simple and effective assessments, the teams’ performance had greatly improved with reduced uncertainties, while the effort required for the project had substantially decreased. With better estimates and effec-tive project tracking mechanisms, the teams were able to constantly monitor the progress and the feasibility of their projects ensuring that the scopes can be delivered within the
available resources. The teams were able to spend less effort towards the project in order to achieve equivalent or higher level of quality of work compared to the previous years.
Our primary target for future work is to explore additional approaches to perform effective measurements on the team’s performance. Some of the potential methods that can be used include the Personal Software Process in [22] and the Team Software Process in [23]. Both of these processes provide practical ways to measure the time spent on each activity and their effectiveness. They would allow our framework to utilize the collected data to determine the productivity rates of the team and the members. Additionally, the processes would help in determining the capabilities of the team and its personnel. These data can be used to enhance our assessment framework and help in future estimations and team performance analysis.
Another target for our future work is to experiment the COTIPMO framework and tool in the industry to observe the validity of the framework. The survey assessment framework will be verified and validated by experts in the industry, and the whole framework will be tested with projects of different sizes and domains. Since the majority of USC’s projects were e-services projects with maximum of 7 team members, it would be valuable to observe the effectiveness of the COTIPMO framework used in larger teams where team synchronization and stabilization tend to be much more complex.
ACKNOWLEDGMENTS
The authors wish to thank Bhargav Rajagopalan and Sergio Romulo Salazar for their effort in helping with the COTIPMO tool development.
REFERENCES
[1] B. Boehm,Software Engineering Economics. Prentice-Hall, 1981.
[2] B. Boehmet al., Software Cost Estimation with COCOMO II. Prentice-Hall, 2000.
[3] “Unified CodeCount.” Internet: http://sunset.usc.edu/research/ CODECOUNT/, [Jan. 20, 2012].
[4] S. Koolmanojwong and B. Boehm, “The Incremental Com-mitment Model process patterns for rapid-fielding projects,” in Proc. of the 2010 Int. Conf. on New Modeling Concepts for Today’s Software Processes: Software Process (ICSP’10), Paderborn, Germany, 2010, pp. 150–162.
[5] B. Boehmet al., “Using The Spiral Model and MBASE to generate new acquisition process models: SAIV, CAIV, and SCQAIV,”CrossTalk, pp. 20–25, Jan. 2002.
[6] W. Krebs, P. Kroll, and E. Richard, “Un-assessments reflec-tions by the team, for the team,” inProc. of the Agile 2008, Washington, DC, USA, Aug. 2008, pp. 384 –389.
[7] M. Cohn, Agile Estimating and Planning. Prentice-Hall, 2006.
[8] J. Grenning. “Planning poker,” Internet: http:// renaissancesoftware.net/files/articles/PlanningPoker-v1.1.pdf, Apr., 2002 [Jan. 20, 2012].
[9] L. Putnam and A. Fitzsimmons, “Estimating software costs,”
Datamation, pp. 189–198, Sep. 1979.
[10] J. A. Farquhar, “A preliminary inquiry into the software estimation process,” The Rand Corporation, Santa Monica, CA, Tech. Rep. RM-7271-PR, 1970.
[11] D. Yang et al., “COCOMO-U: An extension of COCOMO II for cost estimation with uncertainty,” in Software Process Change, ser. Lecture Notes in Computer Science, Q. Wang, D. Pfahl, D. Raffo, and P. Wernick, Eds. Springer Berlin / Heidelberg, 2006, vol. 3966, pp. 132–141.
[12] J. D. Wiest and F. K. Levy, A Management Guide to PERT/CPM. Englewood Press: Prentice-Hall, 1977. [13] V. R. Basili, “Applying the Goal/Question/Metric paradigm
in the experience factory,” inSoftware Quality Assurance and Measurement: Worldwide Perspective, N. Fenton, R. Whitty, and Y. Lizuka, Eds. International Thomson Computer Press, 1995, pp. 21–44.
[14] A. Cockburn, “Earned-value and burn charts (burn up and burn down),” inCrystal Clear. Addison-Wesley, 2004. [15] P. Aroonvatanaporn, C. Sinthop, and B. Boehm, “Reducing
estimation uncertainty with continuous assessment: track-ing the “cone of uncertainty”,” in Proc. of the IEEE/ACM Int. Conf. on Automated Software Engineering (ASE’10), Antwerp, Belgium, 2010, pp. 337–340.
[16] P. Kroll and W. Krebs, “Introducing IBM Rational Self Check for software teams,” Internet: http://www.ibm.com/ developerworks/rational/library/edge/08/may08/kroll krebs, May 3, 2008 [Jan. 20, 2012].
[17] B. Boehmet al., “Early identification of SE-related program risks,” Systems Engineering Research Center, Tech. Rep. SERC-2009-TR-001, Sep. 2009.
[18] “Jazz Foundation.” Internet: https://jazz.net/projects/ jazz-foundation/ [Jan. 20, 2012].
[19] B. Boehm et al., “Software requirements negotiation and renegotiation aids,” inProc. of the 17th Int. Conf. on Software Engineering (ICSE ’95), Seattle, Washington, United States, 1995, pp. 243–253.
[20] M. J. Lee, “Foundations of the WinWin requirements ne-gotiation system,” Ph.D. dissertation, University of Southern California, 1996.
[21] B. Boehmet al., “Using the WinWin Spiral Model: A case study,”Computer, vol. 31, pp. 33–44, Jul. 1998.
[22] W. S. Humphrey, A Discipline for Software Engineering. Addison-Wesley, 1995.
[23] W. S. Humphrey,Introduction to the Team Software Process. Addison-Wesley, 1999.