Union College
Union | Digital Works
Honors Theses Student Work
6-2018
Banking Efficiency within the World’s Largest
Banks: Application of Data Envelopment Analysis
to the Global Financial Crisis of 2008
Devin Coffey
Follow this and additional works at:https://digitalworks.union.edu/theses Part of theEconomic History Commons, and theFinance Commons
This Open Access is brought to you for free and open access by the Student Work at Union | Digital Works. It has been accepted for inclusion in Honors Theses by an authorized administrator of Union | Digital Works. For more information, please [email protected].
Recommended Citation
Coffey, Devin, "Banking Efficiency within the World’s Largest Banks: Application of Data Envelopment Analysis to the Global Financial Crisis of 2008" (2018).Honors Theses. 1635.
Banking Efficiency within the World’s Largest Banks:
Application of Data Envelopment Analysis to the Global Financial Crisis of 2008
By
Devin James Coffey
* * * * * * * *
Submitted in Partial Fulfillment of the Requirements for
Honors in the Department of Economics
UNION COLLEGE June, 2018
ABSTRACT
COFFEY, DEVIN JAMES. Banking Efficiency within the World’s Largest Banks: Application of Data Envelopment Analysis to the Global Financial Crisis of 2008. Department of Economics, June 2018.
ADVISOR: Professor Shelton Schmidt
The world’s financial system is one of the globe’s most powerful structures, however the institutions that make up this network of banking firms are certainly not immune to the pressures of market globalization and technical innovation that drive change within the financial landscape. In order to exist within such an environment, the world’s largest commercial banks must constantly reevaluate the ways in which they function in order keep pace in the competitive market. The objective of this paper is to examine the efficiency of ten of the world’s largest commercial banks during the period spanning from 2006 to 2015. Utilizing a data envelopment analysis (DEA) output oriented model this study explores how these banking firms navigated the tumultuous landscape that was created at the hands of the most recent financial crisis. The study not only focuses on firm behavior during the crisis itself but the years surrounding the
financial collapse as well, keying in on relationships between banking practices, and firm efficiency during a time of unethical conduct in the financial realm. The results show that the vast majority of banks reached peak efficiency following the crisis years (2007-2008) with a number of banks experiencing their lowest levels of technical efficiency during the crisis itself. Furthermore the most efficient banks in the sample were responsible for some of the era’s largest acquisitions, and there was no obvious trend that surfaced concerning the efficiency of domestic banks versus the efficiency of foreign banks. Coupling these results with the causes and implications of the globe’s most recent
ACKNOWLEDGEMENTS
I would like to thank Professor Shelton Schmidt for his time and effort in assisting me during the completion of this study. Over two terms Professor Schmidt not only offered guidance on technical topics and economic ideas but also provided answers to a host of different questions all while finding time to meet and discuss my thesis each and every week. I could not have asked for a better advisor. Thank you Again Professor Schmidt.
TABLE OF CONTENTS
Abstract ... ii
Chapter One: Introduction ...1
Chapter Two: Literature Review ...4
Chapter three: Methodology ...16
Chapter Four: Empirical Results ...22
Section I: Sample and DEA Models ...22
Section II: Findings ...26
Chapter 5: Conclusions ...39
Section I: Conclusions ...37
Section II: Extensions & Limitations ...38
Bibliography ...39
Appendices ...41
Appendix A: DMU Efficiency Scores ...41
Appendix B: Efficient Peers ...43
I. INTRODUCTION
The world’s financial system is one of the globe’s most powerful structures, however the institutions that make up this network of banking firms are certainly not immune to the pressures of market globalization and technical innovation that drive change within the financial landscape. In order to exist within such an
environment, the world’s largest commercial banks must constantly reevaluate the ways in which they function in order keep pace in the competitive market. It is imperative that they not only seek to further develop the disciplines in which they already excel but focus on how they can become more productive, efficient entities. In doing so these financial intermediaries will certainly be able to better function and adapt in a dynamic global financial market.
The fact of the matter is that big banks are an essential piece of the economic puzzle holding trillions of dollars of assets at any given time. They are entities that promote growth, employ thousands and drive the economy forward, however it is not always smooth sailing for these massive financial intermediaries, as economic downturns and financial crises can push banks to their breaking point. In the most recent global crisis this reality was clearly illustrated through numerous government bailouts and the horror stories that surround firms such as Lehman Brothers and Bear Stearns. From 2007 to 2008 the banking industry as a whole struggled to stay afloat, as the United States and numerous other nations faced off against one of the most significant economic recessions since the Great Depression of the 1930s. It is this severity that makes the period so intriguing; especially in the context of the world’s largest financial intermediaries who were eventually force to deal with the consequences of their unethical banking practices.
While the past decade, and more specifically the period characterized by the most recent financial crisis represents some of the world’s most financially strenuous years, research concerning bank performance during the time seems to be lacking. Due to the sheer impact that this recent era had on the entirety of the international economy, one would imagine that there would be significant trends that could be analyzed regarding the behavior of banks around the time of the financial collapse. With that being said the objective of this study is to fill that research void in examining the efficiency of banks during the period stretching from 2005–2015. In doing so a DEA model will be constructed in order to explore how America’s largest banks reacted to changes in the financial landscape. The analysis will focus on the implications of the nation’s most recent financial crisis, keying in on the trends of bank efficiency that existed prior to, during and following the economic downturn of 2007. Like, Asmild, Paradi, Aggarwall and Schaffnit (2004) in their study of the Canadian banking industry this study will examine a period characterized by both a financial crisis and collapse in the real estate market. Utilizing data envelopment analysis (DEA) this examination of the world’s largest banks will key in on the efficiency of these firms, evaluating the relationship between the behavior of major banks and the global financial crisis itself.
In measuring efficiency and output oriented DEA model will be constructed and a sample of ten of the world’s largest banks, exhibiting many of the same firm functions, will be examined. Data will be drawn from financial reports over a ten year period and the results that are derived will allow for an analysis of how efficiently each of the ten major banks functioned in relation to their peers. Furthermore, additional economic
concepts and accounting ratios will be utilized in order to provide further context to the discussion of bank efficiency.
The remainder of the paper will be organized as follows. Beginning with an investigation of the existing literature, this analysis will first walk through what has already been explored when it comes to measuring the efficiency of banking systems. Following this review will be a discussion of the methodology behind the study followed by an explanation of the banking firms selected for analysis, along with the inputs and outputs that are utilized. With this background in place the results will then be presented along with the implications of the findings, allowing for an assessment of bank
II. LITERATURE REVIEW
Several previous works have been developed that focus on an efficiency analysis of a single banking structure or multiple banking systems. These studies focus on firms within nations in Asia, Europe, Australia and North America examining research questions concerning technological innovation, deregulation and the impact of financial conglomerates. Furthermore, the past literature on the subject evaluates both domestic and international banking structures, utilizing several different models and measures in order to draw valuable conclusions. A variety of these papers will be explained within this section and utilized as references to explain the steps and variables necessary to construct a model that will be able to effectively and accurately measure the efficiency of some of the globe’s largest banking firms.
While a DEA model will be utilized within this study it is not the sole method that has been implemented by researchers when exploring the efficiency measures of banks. In his study of banking efficiency in transition economies, Weill (2003) leans on a Stochastic Frontier approach, for instance, as the analysis explores the impact of foreign capital on forty-seven banks across Poland and the Czech Republic in the year 1997. It is due to this rather limited sample of DMUs (decision making units) that the study turns to a Stochastic Frontier approach, as DEA has the major drawback of increasing the number of efficient observations by default for a smaller sample. Moreover, the more typically used DEA method would not allow for Weill to take risk and environmental differences between both countries into account in a simple manner. Utilizing this methodology in order to construct a cost efficiency frontier, Weill discovers that, on average, foreign-owned banks are more efficient than domestic-foreign-owned banks, noting that variances in
efficiency scores did not result from differences in the size or scale of operations or from the structure of bank activities.
Weill (2003) is not the only researcher to have relied on a Stochastic Frontier approach as much of his methodology stemmed from a study constructed by Mester (1996) in which the efficiency of banks operating in the Third Federal Reserve District were analyzed. Like Weill (2003), Mester (1996) made his methodology decision due to the fact that the focus of his investigation was centered on both the riskiness and quality of bank output, something that DEA could not simply analyze. While both of these studies utilized extremely similar methodologies in order to derive useful results, a stochastic approach is not without flaws, as demonstrated through an examination of the technique by Bezat (2009). Through the analysis it is noted that the Stochastic Frontier approach not only lacks the ability to predict technical efficiency scores of DMUs possessing multiple outputs, it also, much like DEA, can become less reliable when a small sample is utilized.
Despite these shortcomings, a Stochastic Frontier approach still holds value in its ability to account for risk and, in the case of Weill (2003), for environmental factors, however DEA seems to remain as the approach most often utilized within studies regarding banking systems. In an analysis conducted by Ferrier and Lovell (1990) the advantages of a DEA approach in the context of bank efficiency are discussed as the non-parametric approach is compared to the stochastic technique discussed above. According to the study the two approaches oftentimes yield differing results, and while a non-parametric programming approach, such as DEA, is often times criticized for reporting noise in the results as inefficiencies, it is also able to better accommodate a larger number
of DMUs and variables. This not only allows for study utilizing a DEA approach to evaluate a greater number of firms, it allows for a more thorough analysis of a DMU’s input and output measures.
This ability to construct a more extensive and in some cases more in depth study through the use of DEA can be clearly seen within the works of Yildirim (2002) and Haslem, Scheraga and Bedingfield (1996). In an analysis of the efficiency of commercial banks within Turkey Yildrim (2002) is able to evaluate a rather large sample of some 594 observations as opposed to the much smaller sample of 47 observations in the study constructed by Weill (2003). Through a DEA analysis it is discovered, not only that efficiency varied widely throughout the period stretching from 1988 to 1994 but the banking sector in Turkey also suffered from scale inefficiencies most often. Moreover, there were distinct differences in efficiency scores depending on firm ownership, as state owned banks displayed greater efficiency than both privately owned and foreign owned firms. Like Yildrim (2002), Haslem, Scheraga and Bedingfield (1996), were able to effectively utilize the ability of DEA to accommodate a more elaborate study,
constructing a model that took a total of seven inputs and five outputs. In taking several more variables into account Haslem, Scheraga and Bedingfield (1996), had the ability to develop a more multifaceted model that would be used to examine the best practices for large banks in the United States. While most studies solely focus on deposits, and interest or non-interest expenses and income this analysis takes on more specific variables
including total borrowed funds, labor expenses and loans to foreign borrowers. In doing so Haslem, Scheraga and Bedingfield (1996), found that in 1987 “best practice” or most efficient banks were actually found to be “financially bad practice banks”, however by
1992 banks deemed to be most efficient through DEA analysis were also considered to be the “financially best practice” banks.
While each of these studies does, in fact, display a benefit of utilizing DEA analysis in the context of banking efficiency, this is by no means the only strength of the linear programming approach. Being a non-parametric approach data envelopment analysis can be utilized within a number of different settings, making the approach a rather dynamic one. As a result DEA studies concerning bank efficiency are not limited to addressing a domestic banking system, as illustrated through the studies of Yildrim (2002), and Haslem et al. (1996). Pastor, Perez and Quesada (1997) for instance, constructed an analysis that compared the efficiency measures of banks across nations including the United States, and countries throughout Europe. Utilizing a DEA model under the assumptions of a production approach, in which deposits are viewed as an output, the study found scale inefficiencies within the United States, Austria and Germany. Furthermore, a Malmquist index was utilized in order to compare the nations in the sample, showing France, Belgium and Spain to be the most efficient, while banks within the United Kingdom, Austria and Germany were found to be least efficient.
While these results provide a rather detailed picture of how banking systems compare in the international community, there are certainly limitations to the conclusions that can be drawn. In selecting inputs and outputs Pastor et al. (1997) lean on variables with rather wide definitions, utilizing the inputs of interest and non-interest income and the outputs of loans and deposits. Due to the fact that this study explores a diverse set of nations, this somewhat vague set of input and output variables could potentially lead to less precise results. This degree of error could potentially be minimized however, through
the use of a sample characterized by more comparable banking structures, as is the case in a study completed by Paleckova (2017). Through an analysis of financial
conglomerates within the Visegrad Countries (Czech Republic, Slovakia, Hungary and Poland) a slight drop in average efficiency between 2009 and 2011 is uncovered, as Paleckova (2017) displays that banks within financial conglomerates are, in fact, more efficient despite the recent decrease in productivity. Utilizing a model similar to that of Pastor et al. (1997) this study takes a slightly different approach focusing on the inputs of labor, fixed assets, and deposits along with outputs that include loans and net interest income, in order to explore how the structure of individual banking firms effect their efficiency.
While Paleckova (2017) focuses on the internal structure of banking firms in terms of efficiency, several other analyses give more attention to the environment in which banks must function. One study constructed by Xiaogang, Skully and Brown (2005) keys in on the external factors that surrounded the Chinese banking industry at the turn of the century, for instance, evaluating the impact of the government’s deregulation programs. Utilizing inputs that include firm expenses and outputs comprised of deposits, loans and income, a DEA analysis under constant returns of scale was implemented in order to uncover X-inefficiencies within the banking sector. Through the analysis it was discovered that large state-owned banks and smaller banks were more efficient than medium sized Chinese banks. Moreover, the examination into the deregulatory measures demonstrates that the programs employed by the Chinese government did in fact improve overall cost efficiency within the sample of forty-three banks. While the results display in improvement in efficiency following 1995, there was a gradual drop in overall efficiency
stretching from 1997 until 2000, most likely triggered by the aftermath of the Asian financial crisis that occurred in 1997.
Like Xiaogang, Skully and Brown (2005), Kirkwood and Nahm (2003) also centered the focus of their study around the impact of government regulation on a domestic banking system. There is, however, one rather significant difference in the fact that Kirkwood and Nahm (2003) not only explore banking efficiency during an era of deregulation, the study also analyzes the relationship that a firm’s efficiency score have on the behavior of its shares in the market. In an analysis of ten firms in the Australian banking sector a two-model approach was employed, in which both models took the same input variables but differing output variables. While the cost efficiency model took
interest bearing assets and non-interest income as outputs, the profit efficiency model analyzed profit after taxes as the only output. When coupled with the use of a Malmquist index this study yielded results that displayed an increase in the efficiency of large banks and a decrease in the profit efficiency of regional banks. Furthermore, the Malmquist index indicated that technological change was the primary cause of improvements in total factor productivity over the period. When turning to the implications of these results on a firm’s share price Kirkwood and Nahm (2003) discovered that there was a positive relationship that existed between bank efficiency and share price for the sample that was analyzed.
Supporting these results discovered by Kirkwood and Nahm (2003), Fadzlan, Zulkhibri and Majid (2007) also uncovered a connection between share price and bank efficiency through a study of just six commercial banks in Singapore between 1993 and 2003. Unlike the Australian study, this analysis only utilizes a single DEA model that
took the inputs of deposits and interest expenses and output variables that included loans and interest income. With this model in place the analysis was able to generate results that displayed an average efficiency of approximately 95.4% across the small sample of firms analyzed. According to the study, this overall efficiency score, while high, suggests that there is an input waste of 4.6%, meaning that firms within the sample on average are not employing the inputs they use in the best possible manner. When it comes
interoperating these results in regards to the individual firms themselves, the analysis found that smaller banks outperformed their larger counterparts, however it is noted that the study would require further analysis of firms risk exposures in order to paint a thorough picture of banking sector efficiency.
The implications of the limitations of Fadzlan, Zulkhibri and Majid (2007) can certainly be seen as well, specifically through the results themselves and the conclusions that are drawn from them. The firm Tat Lee Bank (TBL), for instance, boasts the second highest mean efficiency score out of the six banks that were evaluated, however it is the only firm within the sample to boast negative share returns. While this is the case, the study does note a potential reason for this result that falls in line with the limitations that the researchers discuss at the conclusion of the paper. According to Fadzlan, Zulkhibri and Majid (2007) TBL’s fall in share prices could have been due to investors concern over the banks exposure to troubled companies in Indonesia suffering due to the Asian Financial Crisis. This argument not only could explain the drop in TBL’s stock it also lines up with the fact that the study did not address the degree of risk that the banks within the sample were exposed to.
While a number of prior studies address topics including stock returns,
government deregulation and the internal structures of banking firms, many of these same studies, also reference financial crises in order to explain their results. Although
economic downturns certainly are useful when adding context to the results of an efficiency study, financial crises have also been the primary focus of various modern DEA studies. Due to the impact that the pressures of globalization and financial
innovation have had on the industry in the past decades, analyses of bank behavior during times of crises have become more significant than ever leading some researchers to evaluate these rather chaotic eras. In a study constructed by Asmild, Paradi, Aggarwall and Schaffint (2004), for instance, two of the most recent recessions to plague the Canadian banking industry are analyzed. A DEA window analysis and Malmquist index are utilized to explore a twenty-year period between 1981 and 2000, a time when the economic climate in Canada was changing. Exploring a sample of eight Schedule I and forty-nine Schedule II and III banks this analysis confirms that the recent recessions and collapse of the Canadian real estate market had, in fact, negatively impacted the overall efficiency of the banking sector. Moreover, an increased variance between the banks’ performance in the latter part of the 1990s, is likely to have been caused by the regulatory changes brought on by the Canadian Bank Act amendments implemented in 1987. While this analysis certainly focused on the sector as a whole Asmild et al. (2004) were also able to explore the functions of individual banks during the period analyzed, noting that certain actions such as ScotiaBank’s acquisition of Montreal Trust in 1994 may have negatively impacted firm efficiency during the years to follow.
Similarly a study conducted by Fadzlan (2009) takes a look at the behavior of banks during the Asian financial crisis of 1997, however in this case an international examination is constructed. Moreover, Fadzlan (2009) implements a three-model analysis in which the intermediation, value-added and operating approach are each utilized. As a result a total of five outputs and three inputs are examined and allocated to each model based upon the parameters of each specific approach. While the intermediation approach takes deposits as an input variable, the value added approach assumes deposits are an output produced by labor capital and interest expenses. Unlike either of these two methods the operating approach does not take deposits as a variable, analyzing only the inputs of interest expense and labor along with the output variables of interest and non-interest income. When conducted this analysis would also divide results into three specific periods in order to differentiate the pre-crisis, post-crisis and crisis year(s). With the crisis year occurring in 1997 the remaining two periods would encompass the years of 1992–1996 and 1998–2003.
Not surprisingly the results derived through Fadzlan (2009) point out a rather high degree of inefficiency within the banks of Thailand and Malaysia, particularly in the initial year following the crisis (1998). With this being said, technical efficiency within the Malaysian sector during the post crisis years was highest under the intermediation and value added approaches, while the Thailand sector experienced rather low technical efficiency across all three models following the financial collapse. In both cases, however, the operating approach exhibited the highest levels of technical efficiency during the entirety of the period analyzed (1992-2003), most likely due to the structure of the model itself. According to the study, banks were most likely able to still manage to
boost their deposit base in order to produce interest and non-interest incomes, thereby recording a greater degree of TE under the operating approach. When it comes to Malaysian banks in particular, it was found that the most efficient firms were those that had greater “loan intensity” and a higher proportion of income stemming from non-interest sources. On the other hand it was also discovered that both size expense preference behavior and liquidity all had a negative relationship with efficiency in the Malaysian sector. These results carried over into the banking system of Thailand for the most part as well, however in the Thai sector, size was actually found to have a positive relationship with bank efficiency.
While each of these prior studies targets unique and varying topics regarding bank efficiency, the research on the subject has been lacking as of late. According to a study developed by Berger, Hunter and Timme (1993) financial innovation has simply outpaced efficiency research concerning X-efficiency or DMU deviations from the frontier. While Berger et al. (1993) note that scale and scope efficiencies have been extensively studied, these measure are only able to explain approximately five percent of the costs that are caused by inefficiencies. An X-efficiency analysis, such as DEA, on the other hand is able to uncover about twenty percent of these same costs created by
banking inefficiencies. Despite the fact that Berger et al. (1993) does in fact note that the majority of studies concerning banking efficiency have focused on the United States this trend no longer seems to be the case. The fact of the matter is the vast majority of
analyses concerning the United States were published prior to the turn of the century, despite the recent events that have plagued the financial market in the past decade.
It is this apparent hole that exists within the research that this study will attempt to fill, concentrating on a more modern, complex and more strictly regulated system of banks functioning within the global economy. Like the studies discussed within this section, this analysis will also utilize a DEA approach in order to measure bank
efficiency. Furthermore, the bank data itself will be picked apart, as this examination of banking firms will connect the efficiency measures derived through the DEA program to actions taken by the sample of firms throughout the decade analyzed. The most
significant difference between this current study and the majority of papers previously discussed lies in the period being analyzed, as the vast majority of efficiency studies regarding banks have focused on periods between 1985 and 2003. This analysis on the other hand will explore a more modern period with a goal somewhat similar to that of Asmild, Paradi, Aggarwall and Schaffnit (2004) who evaluated the Canadian sector through two recessions and a real estate crisis.
While this study will surely utilize some of the characteristics of previous works, the methodology as a whole will certainly be rather unique. Like Fadzlan (2009) a multi-model approach will be taken, however only two multi-models will be utilized and will employ both the intermediation and production technique, disregarding the operational approach. This is due to the fact that the operational approach utilized within Fadzlan (2009) completely ignores deposits or assets, arguably the most significant variable within a bank efficiency study as they allow a banking firm to lend and invest. Furthermore, this study will focus strictly on the largest commercial banks within the modern global financial system, as opposed to those analyses that evaluate banks of various size,
purpose and financial standing such as Xiaogang, Skully and Brown do in their study of the Chinese banking system.
This brief synopsis of the literature that exists concerning banking efficiency essentially raises two key points. First off the majority of studies concerning banking efficiency are outdated and analyze firms prior to the year 2000, despite the fact these same banks have become significantly more complex since the turn of the century. And second, there seems to be a correlation between economic downturns and overall bank efficiency as displayed by the studies of Asmild, Paradi, Aggarwall and Schaffnit (2004) and Fadzlan (2009) along with a handful of other studies. The goal of this study is to analyze this relationship in the context of a modern banking structure, evaluating how banks reacted to the most recent financial collapse. In doing so ten of the largest banks across the globe will be evaluated, measured and compared to one another as this analysis seeks to access the underlying story of bank efficiency that existed during the global financial crisis.
III. METHODOLOGY
Efficiency is a state that any firm or organization, regardless of purpose or
industry, should strive for in order to achieve the highest degree of competitiveness in the market. The fact of the matter, however is that there are a limited number of resources available for firms to utilize in order to progress towards this goal of success within any industry. As a result, decisions must be made regarding the allocation of specific
resources within a given firm or organization, in order to allow that body to operate as efficiently as possible. In the financial world this pursuit of competitiveness is arguably more ferocious than it is in any other sector, as the world’s largest banks contend for trillions of dollars constantly present within the international market. Consequently banking firms throughout the world face the challenge of where and how to allocate capital, labor and resources on a consistent basis according to the behavior of these global markets. It is this fact that makes efficiency the vital characteristic that it is, allowing banking firms to confidently apportion the limited resources they have in a manner that results in firm growth, stability and profitability.
Introduced in 1978 by Charnes et al. (1978), data envelopment analysis has
become one of the standard non-parametric approaches for such an efficiency analysis, utilizing a sequence of linear programming problems in order to calculate an efficiency score. Through the use of this method an efficiency frontier is developed by a locus of points representing the decision-making units (DMUs) exercising optimal practices, considered to be “role models” to their peers (Coffey 2017). With the ability to
accommodate multiple inputs and outputs data envelopment analysis is able to derive a comprehensive efficiency measure based upon an entire given set of data points.
Moreover, the peer-to-peer comparison allows for an examination of how a given DMU or firm is performing as compared to other entities that function within the same market. Such a comparison can be crucial as well, especially in markets saturated with competing firms that all seek to perform in the most profitable and cost effective manner possible. In striving to do so DEA can act as a guide, pointing to the areas where adjustments could be made, all while providing projected input and output values that would pull a firm towards a perfect efficiency score.
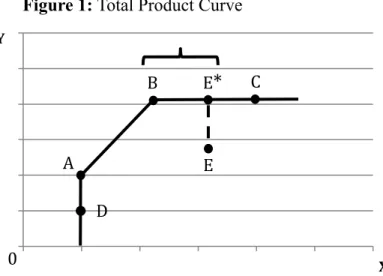
In order for a firm to reach a point of efficiency an input oriented or output oriented approach may be employed depending on the goals of that specific decision making unit. While an input oriented approach functions in a manner that allows a firm to determine how significantly a set of inputs can contract while maintaining the same level of output the output oriented approach works in the opposite manner focusing on potential output given a consistent set of inputs. Due to the competitive nature of the financial sector coupled with the vast amount of capital that exists within the worlds largest banking firms, this study will utilize the output-oriented approach focusing on output expansion as opposed to input contraction. Figure 1 shows this methodology graphically through the total product curve, which represents the unique relationship between a firm’s maximal output and minimal input combinations. When a firm is able to achieve such a relationship it is deemed to be at a point of technical efficiency, as
represented by Points A, B and C in Figure 1, while point E is not technically efficient as it resides below the curve. Therefore point E would need to move to point E* in order to exemplify an efficient point, as a result increasing its technical efficiency, as illustrated by the dashed line on the diagram.
While the output-oriented model focuses on maximizing a DMU’s output it allows for the identification of input slacks as well providing a firm with an illustration of how inputs could be more efficiently utilized in order to reach a level of maximum
output. Such a slack can be seen within Figure 1 presented below, as both point B and point E* are each characterized by the same level of output (Y) yet not the same level of input (X). While point E* is, in fact, a technically efficient point achieving maximum
output the bracketed area between points B and E* displays the input slack between the two points. More specifically, this bracketed area or gap between points B and E* illustrates the fact that a firm at point E* could produce the same level of output (Y) at point B while utilizing fewer inputs (X) or resources in the process. In this case point E* is considered to be at a Farrell Efficient point, or a point of efficiency on a horizontal, flat portion of the frontier, while point B is at a point of total or Koopman Efficiency (Coffey 2017) The same holds true for output slack which, in this case is represented by a
movement from point D to point A. In this case however, the gap on the vertical, flat portion of the frontier represents the degree by which output (Y) could increase while the level of input (X) remained constant.
0 0.2 0.4 0.6 0.8 1 1.2 0 0.2 0.4 0.6 0.8 1 1.2 Y X Figure 1: Total Product Curve
A B E C E
*
*
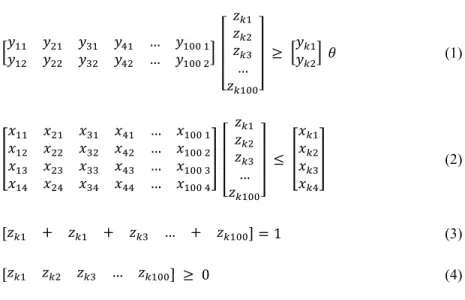
0 DIn the output-oriented model (Model 1) illustrated below in Figure 2 variable returns to scale (VRS) are assumed, and the linear programming problem is displayed in matrix form. Each set of matrices is derived based upon the quantity of inputs and outputs being examined in the analysis, with the unknown weight terms (z) corresponding to the number of DMUs being observed in the study and the (k) term referring to the specific DMU being examined. These weight terms in the formulation below signify the peer weights of the left side of lines (1) and (2) determining which DMUs will act as role models, such as point B in Figure 1 which acts as a role model for the inefficient point E.
Figure 2: Output Oriented DEA Model in Matrix Form
!"! =!"#! Subject to: !!! !!" !!" !!" … !!"" ! !!" !!! !!" !!" … !!"" ! !!! !!! !!! … !!!"" ≥ !!!! !! ! (1) !!! !!" !!" !!" … !!"" ! !!" !!! !!" !!" … !!"" ! !!" !!" !!! !!" … !!"" ! !!" !!" !!" !!! … !!"" ! !!! !!! !!! … !!!"" ≤ !!! !!! !!! !!! (2) !!! + !!! + !!! … + !!!"" =1 (3) !!! !!! !!! … !!!"" ≥ 0 (4)
Through this model the technical efficiency of DMU k will be calculated, a value that will reside between 0 and 1, with the value of 1 representing a firm that has achieved efficiency. In Figure 1 if a firm functions at Point E possessing an efficiency score of 0.750, for instance, that firm would be described as having 75% technical efficiency.
Point E*, on the other hand, would represent an efficiency score of 1 or perfect technical efficiency, with Point B demonstrating perfect Koopmann efficiency. In the Linear
Programing formulation below the unknown ! represents this efficiency score, residing
on line (1) due to the fact that it is an output-oriented model. It is expected that these technical efficiency scores of most of the banking firms analyzed will be relatively low during the years prior to and during the financial crisis itself and closer to a score of 1 or perfect efficiency following the crisis, as institutions worked to recover from the global financial collapse.
This linear programming problem is characterized by a set of constraints each of which are displayed in the LP formulation presented above. The left side of inequalities (1) and (2) represent the efficiency frontier, that are constructed from the DMUs in the sample, while the right portion of these two inequalities denotes the specific DMU being analyzed. The difference between lines (1) and (2) is in the fact that the first inequality represents the set of outputs (y) that are examined through the study, along with the
unknown ! term, while line (2) presents the set of all inputs (x) that are being analyzed.
The inequalities are in opposite direction due to the fact that the left side of the inequality represents the frontier, which will have equal or greater outputs than the single firm being analyzed on the right side of the inequality. The same holds true when it comes to inputs as well, as the frontier will have input quantities that are less than or equal to that of the single firm being examined. This is the case due to the fact that a firm on the frontier would not be able to act as a role model if it was to produce a lesser output and utilize higher inputs than the single firm being analyzed. Line (3) represents an additional constraint that exists under variable returns to scale as each of the non-negative DMU
weight (z) terms must sum to one, while line (4) displays the LP problem’s final constraint requiring that these same weight terms be non-negative. Through this formulation, the efficiency scores and efficient peers of specific banking firms will be determined allowing for an analysis of each decision making unit when it is compared to the other large banking institutions within the sample (Coffey 2017).
IV. EMPERICAL RESULTS Sample and DEA Models
This study examines 10 of the world’s largest banking firms over a period of 10 years spanning from 2006 to 2016 resulting in a total of 100 decision-making units. Out of these 100 observations 2 were determined to be outliers due to the fact that they possessed outputs that differed drastically from the rest of the sample resulting in a final sample of 98 banking firms. Furthermore this analysis contains a total of 6 variables divided into inputs and output amongst two different models constructed based upon the production and intermediation approaches. Inputs include employees, as well as both interest and non-interest expenses while outputs include interest income and non-interest revenue. The final variable incorporated within the study is total assets, which behaves as either an input or as an output depending on the model being utilized. While the
intermediation approach (Model 1) assumes assets are an input as banks attempt to transform liabilities to loans, the production approach takes assets as an output alongside both revenue components.
Each of the 6 variables was derived from the given firm’s annual 10K report filed at the request of the SEC and were recorded in terms of millions of dollars with the exception of employees which was converted to millions of employees in order to establish a uniform set of measures. The goal of these variables was to capture the activities of each major banking firm without screwing the results towards entities that leaned heavily on specific activities in order to generate revenue. In other words, the objective of this study was not to grade banking firms on their performance in the realm of investment banking or on their success in sales and trading or real estate markets, but
to evaluate firms at a higher level based upon overall expenses, resources and revenue. In order to capture expenses interest and non-interest income measures were employed to account for both interest payable on any borrowings, and operating expenses such as employee compensation, technology expenses and legal fees. On the other side of the spectrum interest and non-interest income were utilized in order to measure inflows, not by department but as an aggregate of all firm revenues including those gained through operating activities or generated through the lending of firm resources. Within this study these resources were represented through a measurement of a bank’s total assets, while the final variable, employees, captured the degree of human capital utilized within a firm, a measure that would not be recognized otherwise.
Figure 3, presented below displays the distribution of descriptive statistics across the sample of banks examined, including minimum, and maximum figures, alongside measures of mean, standard deviation and covariance. These measures not only display
the basic features of the sample as a whole, they allow for a simple or high-level analysis of the given dataset allowing for the discovery of correlations between variables.
Goldman Sachs, for instance, in 2006 possesses the lowest employee count by a rather significant amount yet still earned interest income and non-interest revenue that fall
Figure 3: Input / OutputDescriptive Statistics 2006 – 2015 (98 Observations)
Input / Output Min Max Avg. SD CV
Assets (mil) 473,440 3,808,278 1,606,576 708,752 44.116
Employees (hundreds) 30,900 375,000 165,739 98,959 59.707
Interest Expenses (mil) 2,742 91,737 19,478 17,088 87.729
Non-Int. Expenses (mil) 10,139 77,090 36,492 16,620 45.545
Interest Income (mil) 5,209 121,347 44,025 25,940 58.921
around the sample averages. While the degree of employees a bank retains does not seem to directly impact revenue earned it certainly impacts operating expenses within a firm as exhibited by Citigroup in 2007. With some 375,000 employees Citigroup possessed the largest quantity of employees in the sample, and did so just prior to the financial collapse, paying out operating expenses that totaled to two times the average amount paid by its peers. Additionally banks such as Bank of America and JP Morgan which have asset totals that exceed the average also, justifiably, possess interest income figures that are well above the average and move in almost perfect correlation with increases or
decreases in total assets. This trend also seems to hold up within the firms with a lower degree of assets as well, as exhibited by Morgan Stanley who sees interest income fall from approximately $44 billion in 2006 to the minimum interest income within the sample, at just under $5 billion, by 2013 as total assets decreased by about $288 billion during that same period.
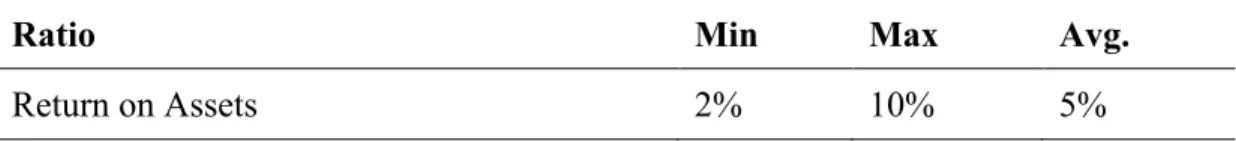
Outside of the realm of simple inputs and outputs additional connections can be drawn through exploring firms’ return on assets (ROA) the percentage of profit a
company earns in relation to its overall resources. Figure 4 displayed below presents the descriptive statistics for this financial ratio displaying the minimum, maximum and the average measures for the sample of firms analyzed. When examining ROA for the sample as a whole it is evident the vast majority of firms saw a decrease in profitability during the financial crisis, with many of those firms failing to return to their pre-crisis levels of
Figure 4: ROA Descriptive Statistics 2006 – 2015 (98 Observations)
Ratio Min Max Avg.
ROA following the collapse. Barclays, who hovered around 2% - 3% during the 10-year period analyzed, exhibited the lowest level of ROA within the sample. While the UK based firm possessed asset quantities above the average throughout the period analyzed, revenue figures decreased during the same period as both interest and non-interest
income dropped below the sample average. Furthermore the DEA analysis uncovered the fact that Barclays was operating with increasing returns to scale for the majority of the years analyzed, revealing that output would increase by an amount that would exceed a proportional change in inputs. This illustrates the fact that Barclays is not operating at its optimal size and would benefit from further growth. This could be looked at from a different perspective as well, however, as it is difficult for banks to escape increasing returns to scale and achieve optimal size. This is due to the fact that growth tends to leave banking firms with a greater quantity of assets once again providing more room to grow, creating a recurring loop that could always leave a bank chasing optimal size. On the other side of the spectrum, or the most profitable firm in terms of ROA on the was Wells Fargo in 2006 with an ROA of 10% The firm was able to translate the second smallest asset base in the sample into revenue figures well in excess of the minimum values found in the data set. This level of ROA did not stick however, as the percentage trailed off during and following the financial crisis as the firm’s asset base grew without a
corresponding increase in revenue. The most consistently successful firm on the basis of ROA was Citigroup, as the bank was able to maintain a ratio that grew too as large as 8% and never fell below 5% as Citi was able to maintain profitability even as the financial crisis chipped away at the firm’s total assets.
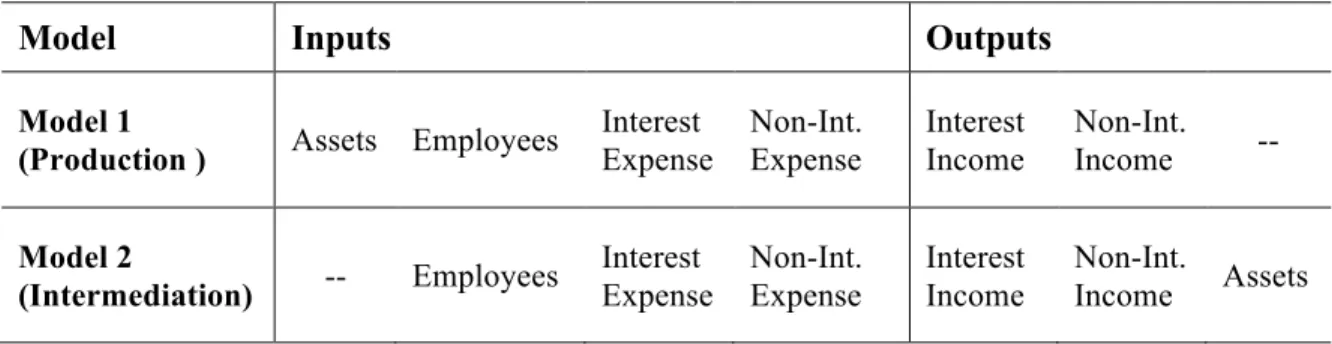
While these relationships are able to tell a portion of the story, they are not able to provide the comprehensive examination of firm efficiency that data envelopment analysis is able to offer. In order to capture both the production and intermediation approaches discussed prior two models were developed, one that takes assets as an input and a second that assumes assets to be an output as displayed in Figure 5 below. While each
Figure 5: Models for DEA Analysis
Model Inputs Outputs
Model 1
(Production ) Assets Employees
Interest Expense Non-Int. Expense Interest Income Non-Int. Income -- Model 2 (Intermediation) -- Employees Interest Expense Non-Int. Expense Interest Income Non-Int. Income Assets
model will be output oriented and analyzed under variable returns to scale (VRS) the behavior of each model will differ with a change in methodologies. A of the few firms analyzed such as HSBC, for instance, saw a much less significant change in total assets throughout the period analyzed, while Morgan Stanley, for example, saw total assets fall considerably from 2006 to 2015. When taken as an output in Model 2 rather than an input as in Model 1 efficiency scores increased almost uniformly as hundreds of billions and often times trillions of dollars are introduced as an output alongside much smaller revenue components. With this being said both models certainly serve a purpose as each one represents a different approach to evaluating banking firms, representing methods that are often times used but rarely are compared within the same study.
Findings
The results of the DEA formulation discussed in Section III reveal that efficiency scores, while high in certain instances, certainly did fluctuate as the global economy
moved into and then out of the world’s most recent financial crisis. It is evident through the data presented in Appendix A that not all firms were characterized by persistently high levels of efficiency as the financial collapse took hold and left behind a broken and battered economy. Citigroup, despite a blemish in 2008, can be considered to be one of the most consistently efficient firms analyzed, achieving efficiency scores above 0.900 each of the ten years examined across both of the two models. Furthermore Citigroup in 2010 is a frequently utilized efficient peer referenced a total of 10 times in model 1, but only a total of 7 times in model 2. While there is certainly some consistency in the performance of Citi during the decade encircling the financial crisis, the firm was not able to entirely avoid the implications of the collapse in 2008. While this DMU (Citigroup 2008) is an outlier within the dataset, due to the fact that the DEA program cannot take on a negative output (a loss in non-interest revenue), the firm performance during the year by no means conveys efficient behavior at a glance. Despite this stumble the firm bounced back achieving almost perfect technical efficiency (0.968) by the year 2014 as revenue increased while employees and interest expenses were cut drastically. Such a bounce back could potentially be attributed to the fact that the firm was
characterized by perfectly efficiency or near perfectly efficiency behavior across both models in the two years leading up to the global crisis in 2008.
Citigroup was not alone in its success either, as HSBC almost mirrored the consistency of its American based counterpart. The Hong Kong and Shanghai Banking Corporation was arguably the most efficient firm in the sample however, as the firm was able to avoid a major falter in 2008 unlike Citigroup who saw revenue plummet during the crisis year. Possessing technical efficiency scores that consistently exceeded 0.900
across both models during the decade analyzed, HSBC appeared to pass through the financial collapse with minimal hardship. With the ability to maintain a massive asset base the firm was able consistently attain revenue figures that were well above average, achieving perfect technical efficiency in 2007, 2009 and 2013 in model 1 (production) and 2007, 2009, 2011 and 2013 in model 2 (intermediation). Moreover HSBC, in 2009, acts as one of the most efficient peers in model 1, as the DMU is utilized on 13 occasions during a year where the majority of banking firms in the sample saw their own efficiency scores take a fall. Aside from a gradual decrease in both interest income and interest expense HSBC saw very few significant changes in the variables analyzed, as the firm moved rather steadily through the globe’s most recent financial downturn.
Citigroup and HSBC were not the only firms able to function at higher efficiency levels however, as banks such as Bank of America and Goldman Sachs saw efficiency levels climb following the financial crisis. When it comes to Bank of America this rise in efficiency levels is more significant within model 2 than it is within model 1, as Bank of America’s most notable strength following the crisis appears to be the firm’s ability to maintain the growth of its asset base much like HSBC. Since the intermediation approach (model 2) takes assets as an output within and adopts an output-oriented approach this increase in total assets carries more weight within the confines of model 2. This is not to say that Bank of America does not perform with high levels of efficiency in both models, however, as the firm slowly pulls its technical efficiency levels back over 0.900 by 2013 in model 2 and by 2015 in model 1 after a slight dip in 2012. Goldman Sachs had a similar path through the financial crisis, however the firm’s success in terms of efficiency does not seem to be derived through asset growth but through limiting the number of
individuals employed at the firm. During 2006 for instance Goldman posses the fewest number of employees of any DMU analyzed within the sample, while maintaining revenue figures that hovered around the sample average. As a result the firm achieved a perfect efficiency score in 2006 across both models and this trend would continue through 2009 where the firm again achieved perfect technical efficiency across both models acting as the most frequently utilized efficient peer in model 1. This stretch of success would be briefly interrupted in 2010 as the efficiency scores in model 1 and model 2 would drop to 0.881 and 0.973 respectively, a small slip that would only last temporarily as the firm would return to its pre-crisis efficiency figures by the end of the period analyzed.
Likewise, Wells Fargo and JP Morgan also exhibit high levels of efficiency throughout the decade analyzed, however neither firm is quite as proficient as HSBC over the period. Never the less, JP Morgan and Wells Fargo are two of the more efficient firms within the sample, as each bank achieves perfect technical efficiency on multiple
occasions. JP Morgan achieves this milestone in consecutive years as well, in 2009 and 2010, directly following the crisis years. This not only demonstrations that the firm was able to rebound from its lowest efficiency scores, occurring in 2008, it also displays the bank’s ability to maintain efficient behavior as JP Morgan never again saw efficiency scores slip back down to the level they were at in 2008. Furthermore, JP Morgan possesses one of the most frequently utilized peers within the sample, as the firm’s performance in 2009 is referenced by other DMUs on 20 occasions in model 1
(production) and a total of 16 times within model 2 (intermediation). One of the many firms to reference this DMU was Wells Fargo, as the firm utilized the efficient peer (JP
Morgan 2009) on four different occasions in model 2. Moreover, the two banks share a relatively similar trend in efficiency scores as both firms see efficiency levels remain consistently high during the latter portion of the decade. Wells Fargo, while achieving solid efficiency scores, also exhibited the highest levels of return on assets during the early part of the decade as the bank is one of the few in the sample who saw a consistent and significant growth in total assets from 2006 to 2015. This growth in the asset base coupled with diminishing expanse figures and rising revenue allowed Wells Fargo to maintain some of the strongest scores for technical efficiency under the assumptions of both the production and intermediation methods.
While the firms discussed previously exhibited the same or at least a similar trend in efficiency across both the intermediation and production models, this was not the case amongst all firms analyzed. Barclays for instance, saw a large discrepancy between models 1 and 2 as the firm passed through the years that encompassed the global financial crisis. In model 2 (intermediation method), for instance, the European based firm exhibits a trend very much similar to that of Bank of America or Goldman Sachs as efficiency scores persist at a high level with the exception of a small dip in 2013. Despite this small blemish Barclay’s large asset base throughout the majority of the decade analyzed allowed the firm to achieve perfect technical efficiency in 2008 and 2010 under the intermediation method, an accomplishment that the firm was not even close to
attaining under the assumptions of model 1 (production method). In model 1 the contrary is the case as Barclays saw scores plummet following the crisis as technical efficiency fell as low as 0.758 by 2015, one of the lowest scores present within the sample. This drastic difference can most likely be explained by once again examining the firm’s return
on assets as the latter portion of the decade saw Barclays asset base only slightly decrease while its revenue components fell substantially. Such a transformation is only captured when firm revenues are the only output as the intermediation approach allows the introduction of total assets as an additional output to mask Barclays dwindling revenue figures.
A similar trend is evident when examining UBS as well, as model 2 again paints a more efficient picture of the Swiss based banking firm. While the firm is characterized by perfect efficiency in 2006 and 2007 across both models, UBS certainly took a hit in 2008 as the firm’s non-interest revenue dropped by some 97% making the specific DMU an outlier within the initial sample. Following this rather significant drop in revenue the firm was able to recover according to the intermediation model (model 2) however the
production model (model 1) displays a much different story, as UBS never returns to its pre-crisis levels of efficiency. As a result UBS, when analyzed under the production approach, can be labeled as the least efficient banking firm within the sample possessing efficiency scores that fall between 0.887 and 0.668 following the crisis. While the firm did increase revenue numbers from 2008 to 2009 the 6 years to follow would bring a 64% drop in total revenue along with a corresponding decrease in interest expense figures. This drop in revenue following the global crisis was primarily due to declining interest income figures as well, with non-interest revenue remaining relatively consistent year over year following the massive dip in 2008. Despite these figures UBS still does possess somewhat solid efficiency scores within model 2, as the firm’s asset base only took one significant hit in 2009 dropping almost 40%, translating to a technical efficiency score of just 0.749 during that same year. Following this one falter, UBS returns to higher levels
of efficiency under the assumptions of the intermediation approach in the latter portion of the decade, once again almost attaining perfect technical efficiency in 2011.
While UBS performed in the least efficient manner under the production method (model 1) over the span of the decade analyzed it could be argued that Morgan Stanley performed in a similar manner around the crisis years. The differing factor between the two firms, however, is the fact that this inefficient behavior that characterizes Morgan Stanley at times throughout the decade holds true across both models, unlike UBS who only saw dwindling efficiency scores under the assumptions of model 1. Entering into the crisis years Morgan Stanley not only possessed solid efficiency scores, the firm also achieved higher than average return on assets. Despite possessing one of the smaller assets bases the firm was also still able to maintain revenue figures that rivaled some of the larger firms in the sample, however this performance would waiver as Morgan Stanley moved through the global crisis. In 2009, for instance, the firm saw efficiency scores take a dive dropping below 0.800 across both models, only rebounding slightly by 2010. These lower measures of technical efficiency would persist for a few years as well, until 2013 when Morgan Stanley began to claw its way back towards perfect efficiency. As the crisis years passed, a new revenue structure appeared to take hold as interest income fell and non-interest revenue increased year over year ultimately leading to perfect technical efficiency under both models in 2015. Like many of the firms analyzed this decrease in interest income was also mirrored by interest expense figures as Morgan Stanley diminished its interest expenses to the lowest level of any firm in the sample by 2015. While theses changes did, in fact, result in higher efficiency scores they appear to
be the result of the firms diminishing asset base, as Morgan Stanley saw total assets fall by some 30% during the decade analyzed.
Despite this rather sharp drop in total assets, Morgan Stanley was not the smallest banking firm included within the sample, as Royal Bank of Canada held an asset base that was significantly smaller than that of its peers. While the Canadian firm was smaller on the basis of assets, much like Morgan Stanley, the trend that RBC’s asset based followed was much different, nearly doubling from 2006 to 2015. This growth in total assets coupled with extremely consistent revenue figures and decreasing expenses
allowed Royal Bank of Canada to establish itself as one of the more efficient firms within the sample, even achieving perfect technical efficiency at times. Despite the fact that these results imply that RBC was operating in a profitable and efficient manner there is a significant issue known as efficiency by default that arises when applying a DEA analysis to the firm. The issue occurs due to the size of RBC as reflected through the firm’s
smaller asset base, expenses and income components. According to Fried et al. (1993) efficiency by default can be determined in two different manners, both of which characterize several of the DMUs residing under Royal Bank of Canada. If a firm possesses the lowest input levels or the highest output levels, or if a firm is never or rarely utilized as an efficient peer, that specific DMU can be considered to be efficient by default. In the case of RBC the minimum input criteria is met due to the firm’s size and, as a result, the firm’s DMUs are often not utilized as efficient peers. This is not to say that RBC was an inefficient entity during the period analyzed, it just simply cannot be considered to be perfectly efficient at times despite displaying an efficiency score of 1.00.
While efficient peer frequency allows for the detection of these firms
characterized as efficient by default, the measure also allows for the identification of the DMUs or role models most often referenced by inefficient firms. The frequency by which these efficient DMUs are referenced can provide some insight as to which of the entities provides the best model for perfect technical efficiency. When analyzing each firm on an individual basis it is evident that frequently utilized peers seem to exist most often in 2009, the year after the most severe portion of the financial crisis. Out of the 10 firms examined half of them find that their most frequently utilized efficient peer fell in the year 2009, while only 2 firms found their most frequently referenced peer to exist prior to or in 2008. This not only suggests that banking firms seemed to operate more efficiently following the crisis it illustrates that firms may have needed to practice efficient behavior in the initial year following the financial collapse in 2008. This is not to say that efficient DMUs that are referenced infrequently are worse off, it simply means that the most frequently utilized peers could be considered to be the paramount models of efficiency within the study.
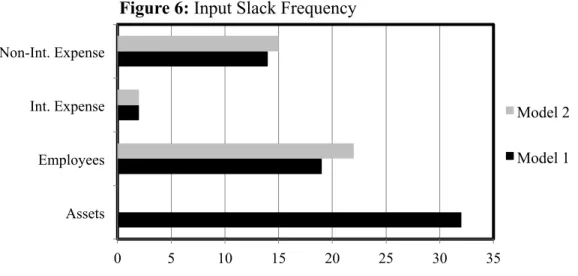
While a DMU may achieve an efficiency score of 1.00 or perfect technical efficiency, some of these firms can still improve upon their level of efficiency as well. A firm that achieves perfect technical efficiency may only be Farrell efficient if a slack or surplus exists, as discussed previously and demonstrated through Figure 1. These slacks are able to provide even more insight beyond the information provided by a DMU’s efficiency score. Input slack, for instance, displays the degree to which a firm can reduce its input consumption while maintaining the same level of output. Figure 6 presented below illustrates these slacks across each of the four inputs utilized within this study,
noting the frequency of each slack or how many times a slack for a specific variable applies to a particular DMU. When taken as input in model 1, Assets exhibit the most frequent occurrence of slack amongst all of the variables demonstrating the fact that a large asset base is not necessarily vital to producing strong levels of output as exhibited by Wells Fargo and at times by Morgan Stanley both of whom possessed smaller asset
bases. Following Total Assets, Employees is the next most frequent occurrence of slack with approximately 20 incidents in each of the two models, suggesting that in many cases employees may be becoming more dispensable. With the development of new
technologies the need for high employee counts may be a thing of the past, especially as certain processes within firms become automated. Non-Interest Expenses also sees a rather high rate of slack, however it is difficult to determine which component of these expenses is the most expendable. It could potentially be the massive salaries paid to the employees within the firm, however it could also be due to legal or other professional fees paid out to third parties.
Aside from the frequency of these input slacks it is also interesting that both models mirror one another, as their slack frequencies pain the same picture. The same
0 5 10 15 20 25 30 35 Assets
Employees Int. Expense Non-Int. Expense
Figure 6: Input Slack Frequency
Model 2 Model 1
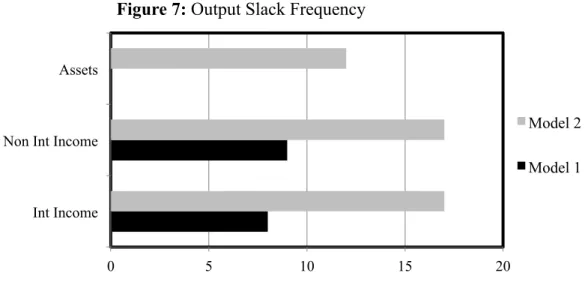
does not hold true when it comes to output slack however, as model 2 displays significantly higher frequencies than model 1 does as displayed by Figure 7 below. Output slacks as a whole occurs less frequently than input slacks however, but despite
this fact there are certainly still conclusions that can be drawn from the data. This graph, when evaluated in its entirety, tells an interesting story as the higher rate of output slack in model 2 suggests that under the assumptions of the intermediation approach more DMUs have room for output growth holding inputs constant. The degree of these output slacks can vary widely as well, with some firms possessing interest and non-interest slacks totaling less than $200 million while other firms have multi-billion dollar slacks across both models.
0 5 10 15 20
Int Income Non Int Income Assets
Figure 7: Output Slack Frequency
Model 2 Model 1
V. CONCLUSIONS & LIMITATIONS Conclusions
Based upon the data collected following the analysis, certain tentative conclusions can certainly be reached. Based upon the efficiency scores presented within Appendix A it is evident that the majority of banking firms achieved peak efficiency levels in the years following 2008. Furthermore, many of these firms begin to demonstrate consistently efficient behavior towards the latter portion of the decade analyzed suggesting that banking regulations and a need to operate in a more ethical manner potentially lead to higher levels of efficiency. Scores for technical efficiency were higher within model 2 (intermediation) on a regular basis as well, as the assignment of total as an output seems to have skewed the results in a manner that does not appear to convey the most accurate picture of efficiency. With that being said both models were certainly the victims of some shortcomings including the frequency of DMUs identified as efficient by default simply due to the firm size dissimilarities.
On a firm-by-firm basis there were undoubtedly certain banks that outperformed the majority of the sample including the likes of HSBC, Citigroup, Wells Fargo and JP Morgan along with others such as Bank of America and Barclays who performed
efficiently during the crisis years. These results certainly coincided with the history of the era as well, as firms such as Merrill Lynch, Wachovia, Bearn Stearns and Lehman
Brothers, were all acquired by the firms exhibiting the highest levels of efficiency around 2008. There appeared to be no trend that developed amongst domestic or foreign banks either, as demonstrated by the mixture of banks that can be characterized as the most efficient firms in the sample. This reality is most likely due to the fact that lines are
becoming more blurred than ever when it comes to the conversation of foreign versus domestic firms, as the world’s largest banks all operate on a growing global scale. This is not to say that a more drastic presence with in specific nations will not carry certain
connotations however. Just recently, for instance, on the 24th of May 2018 President
Donald Trump signed a banking regulation rollback bill into affect, thus lifting “small” and “medium” sized banks out of a portion of their regulatory chains. While this does not directly affect the firms analyzed within this study at the moment there very well could be more legislation coming down the line in the future that may impact the globes largest firms and therefore alter the manner in which these banks behave.
Extensions & Limitations
This analysis adds to the rather dated research that exists within the field of efficiency analyses regarding banking institutions. With the limited efficiency research that currently examines the global financial crisis of 2008 this study provides insight into how some of the world’s largest banking firms performed during the era stretching from 2006 to 2015. A further analysis could delve deeper into the departments of each firm, or could examine firm efficiency within the boundaries of a specific country or region. Building upon this study could certainly prove useful, however there are certainly limitations that are bound to exist within the analysis. Differences in bank size, for instance, can lead to more frequent occurrences of efficiency by default, particularly in smaller firms. Despite this limitation DEA still is able to provide a practical and effective analysis of banking firms during the global financial crisis, able paint a picture of firm behavior during the decade analyzed.