Market Entry Pattern And Timing In An
Industry With Technological Evolution:
The Liquid Crystal Display Industry
Michiko Miyamoto, Akita Prefectural University, JapanABSTRACT
This paper examines whether the process of entering the market, as well as industry-specialized assets and positioning in the applied technologies should differ between early entrants and late entrants in the LCD industry, where the industry evolves and provides different types of displays and where LCD technologies have become major parts of new applied product generations. The study also investigates whether all firms follow the same strategic decisions upon entering the market when they enter at similar times, whether early or late. According to the findings, early entry into the LCD industry is positively related to experience in the LCD related R&D activities. As accumulated outputs are regarded as a measure implied by the standard form of the learning curve, this is consistent with prior studies on first-movers. Patents most likely protect their technological advantages. Large-capital late entry into the LCD industry is positively related to company size as these firms have excess capital to spend on R&D. The late entrants are established firms in their core industries; possess related assets or excess capacities that enable them to enter into the LCD market. On the other hand, smaller-capital late entrants into the LCD industry have no accumulated R&D activities or production of applied products, which implies that they are free riding off of early entrants’ investment.
Keywords: Entry timing, early entrants, late entrants, strategic positioning
1. INTRODUCTION
irms established in other markets or groups often make a strategic decision to enter an existing industry where incumbents have established the market. Even an oligopolistic industry, which has historically been occupied by incumbents, attracts new entrants when technology changes its output variety. The relative advantages and disadvantages of different entry timing vary across industries and among types of firms within an industry. (Mitchell 1991) This paper investigates the strategic differences among firms on entry into an industry in which technology output varies over time. Such cases are likely to occur when a core technology has evolved and has been applied to various new products which bring in huge profits. Some industry incumbents have decided to evolve with the industry‟s technological trajectory by continuing to enter new-generation markets as well as new applied products markets. Other firms, which have entered the related applied products markets first, have also decided to enter core technology or the core product markets as well. Such shifts into other industries can be observed when there are specific advantages that assist interindustry mobility (Caves and Porter 1977). When the introduction of technology in one stage involves adaptation or adjustment in a preceding or subsequent stage, common ownership of the various stages of production enables the necessary adaptations and adjustments to be made in a timely and efficient fashion (Armour and Teece 1980).
What kind of entry patterns would we observe between early entrants and late entrants in such an industry, when the given industry evolves and basic technologies have become major parts of new product generations? Market entry conditions should differ between early entrants and late entrants in a basic industry. The process of entering the market, as well as their possession of industry-specialized assets, and their positioning in the applied technologies should differ between the two types of entrants. This study tests these predictions by examining the entry patterns and timings of early and late entrants in the Japanese liquid-crystal-display (LCD).
Since it was first used as a display for an electronic calculator in 1973, LCD technology has advanced and has become an important component for various applied products. Japan is the world‟s leading manufacturer of LCDs. It should be noted that while there are over 320 manufacturers in LCD-related industries in Japan, a relatively small number capture the greater proportion of market share. In this study, the successful entry pattern and timing of 23 major firms into the LCD industry are focused in the analysis. This sample, therefore, is biased since it ignores smaller corporations. In Section 2, a brief background of the LCD industry is given. In Section 3, I discuss theoretical models of entry timings in such an industry, when the given industry evolves and basic technologies have become major parts of new product generation. Section 4 contains some evidence on the differences between two entry groups which was derived from the descriptive statistics. Section 5 describes estimation procedure employed on different entry groups. Section 6 presents empirical results. The results and conclusion of the empirical studies are summarized in Section 7.
2. THE LCD INDUSTRY
2-1. Basic and Applied Technologies and Products
It took almost a century to see the first commercially practical LCD application, since the Austrian botanist Rheinitzer discovered liquid crystals in 18881. In 1973, mass production of the world's first liquid crystal display was achieved, and the world‟s first electronic calculator featuring a LCD display was introduced. Evolution of the LCD display has been supported by development of three basic LCD technologies; display units, drive systems and LCD types.
2-2. Display units
During the first six years, LCDs used a segment system in which long display units were arranged to form a figure „8‟ to display numbers. Applied products in this era were limited to watches, video games and calculators. In 1979, LCDs started using a dot-matrix system in which display units are arranged in rows and columns to form characters or to depict graphics.
2-3. Drive systems
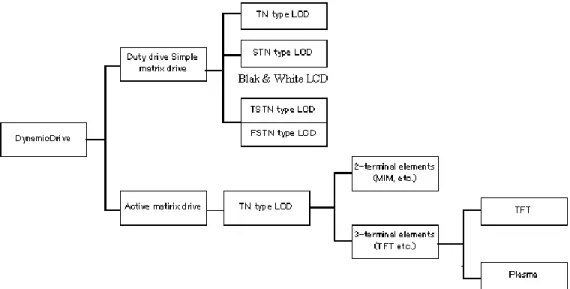
A drive system literally “drives” an LCD by applying voltage to specific electrodes. In the early days of LCD development, segment systems used a static drive system in which each segment was driven separately. The development of a dynamic drive made it possible to drive displays with fewer terminals. Currently, static drives are rarely used. The most common dynamic drive systems in use today are simple matrix drives and active matrix drives. LCDs that utilize simple dot matrix are TN (Twisted Nematic) and STN (Super Twisted Nematic) displays. Simple matrix drives are mainly used in calculators, word processors, PCs, and other still-image applications. Active matrix drives are used for TVs and other moving-picture applications, which require high picture quality and fast response. TFT (Thin Film Transistor) and MIM (Metal Insulator Metal) displays utilize active matrix drive systems. The applied product, which utilizes LCDs the most are laptop PCs, which generally have TFT LCD displays with active matrix drive systems. MIM displays offer picture quality, production ease and cost which are between those of simple matrix and TFT active drive systems. Classification of dynamic drive systems is shown in Figure 1.
2-4. LCD types
The earliest display type was called DSM; however, current LCD types are based on TN technology. LCD types have evolved from TN to STN, TSTN (Triple STN) and FSTN (Film STN). STN-LCD displays offer higher contrast than TN even on large screens, and TSTN and FSTN are optimal for large black-and-white LCDs and precise color imaging when equipped with a color filter. The rapid development of LCD applied products has been observed since 1985. STN-LCD displays are applied to word processors and electronic organizers, and advanced STN modules are used for color LCD laptop computers.
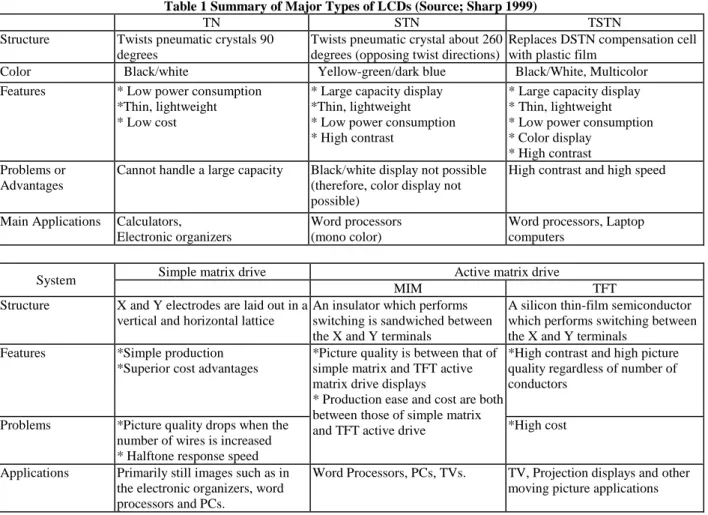
Because of the technological differences, although TN and STN require less capital and cost to produce, a large amount of capitalis required for TFT production. A summary comparison of various types of LCDs is given in Table 1.
Figure 1 Classification of Dynamic Drive Systems
Source: http://sharp-world.com/sc/library/lcd_e/s2_4_2e.htm
Although LCD picture quality was regarded inferior to that of the cathode-ray tube (CRT) in the early days, LCD technologies have become so advanced that they have replaced CRT monitors as the main display device for audio/visual, PCs, and data communications with greater compactness, energy efficiency and diversity over the last decade. A list of applied products is given in Table 2.
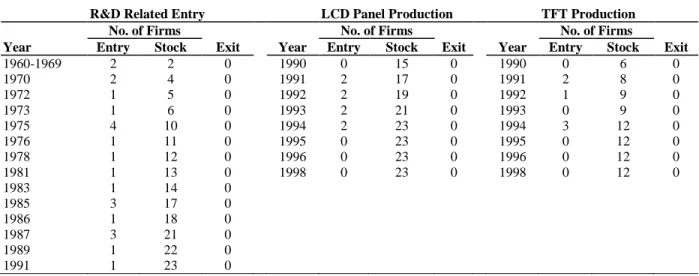
There were two major entry waves in the LCD industry in Japan. The first one occurred from the 1960s to the 1970s, and the second one in the 1980s. These entries were mainly R&D related and then followed by production entry. In 1991, Sony entered, becoming the last major entrant in the LCD industry. Out of the 23 major firms I observed, I define those firms that entered the LCD industry by the end of the 1970s as early entrants (13 firms), and any entrants starting after 1980 as late entrants (10 firms)2. See Table 3 for R&D-related and production- related entry patterns3 for the 23 examined LCD manufacturers. Among those firms, no companies have left the industry4. They can be regarded as successful entries to the industry, although type of LCD produced, production amounts, and applied products have varied.
2
Toshiba started its STN-LCD production in 1983, however, their LCD business expanded after they formed DTI (Display Technology Inc.) with IBM in 1989. Toshiba‟s R&D on TFT-LCD started in 1980, and their joint R&D activities with IBM Japan started in 1986.
3
Entry data into the LCD industry is based on each company‟s history. Actual production amounts for each company are only available from 1990.
3. TECHNOLOGICAL INNOVATION AND ORDER OF ENTRY
There has been some literature published on entry issues into an industry where a new product generation arises; however, most of these theories have focused more on the entry pattern of incumbents (the early entrants) into the new product market or on emerging technical subfields of the industry rather than on the differences in entry patterns into the basic industry between early entrants and late entrants from other industries. According to these findings, the entry timing of the incumbents is dependent upon the speed of technological advances of a new generation and the quality of incumbent resources and capabilities (Lieberman and Montgomery 1998). When the technological advances occur incrementally, larger incumbents are typically the first to enter. Conversely, if the advances are radical, companies cannot adapt the changes in a sufficient amount of time and become late entrants (Thomas 1995, 1996; Henderson and Clark 1990; Henderson 1993; Christensen 1993).
Table 1 Summary of Major Types of LCDs (Source; Sharp 1999)
TN STN TSTN
Structure Twists pneumatic crystals 90 degrees
Twists pneumatic crystal about 260 degrees (opposing twist directions)
Replaces DSTN compensation cell with plastic film
Color Black/white Yellow-green/dark blue Black/White, Multicolor Features * Low power consumption
*Thin, lightweight * Low cost
* Large capacity display
*Thin, lightweight * Low power consumption
* High contrast
* Large capacity display * Thin, lightweight * Low power consumption
* Color display * High contrast
Problems or Advantages
Cannot handle a large capacity Black/white display not possible (therefore, color display not possible)
High contrast and high speed
Main Applications Calculators, Electronic organizers
Word processors (mono color)
Word processors, Laptop computers
System Simple matrix drive Active matrix drive
MIM TFT
Structure X and Y electrodes are laid out in a vertical and horizontal lattice
An insulator which performs switching is sandwiched between the X and Y terminals
A silicon thin-film semiconductor which performs switching between the X and Y terminals
Features *Simple production *Superior cost advantages
*Picture quality is between that of simple matrix and TFT active
matrix drive displays * Production ease and cost are both
between those of simple matrix and TFT active drive
*High contrast and high picture quality regardless of number of conductors
Problems *Picture quality drops when the
number of wires is increased * Halftone response speed
*High cost
Applications Primarily still images such as in the electronic organizers, word processors and PCs.
Word Processors, PCs, TVs. TV, Projection displays and other moving picture applications
Table 2: LCD Consumption Share by End-users, 1996 and 2009 (%)
1996 2009
Notebook PC 60 9
Small to Medium size display 28
-Industrial applications 5
-Desktop PC 4 16
Word processor 3
-TV 0.2 45
Mobile Phone - 16
Market size (000 million yen) 6,400 82,599
Table 3: R&D Related Entry, LCD Panels and TFT Production Entry of 23 Firms
R&D Related Entry LCD Panel Production TFT Production
No. of Firms No. of Firms No. of Firms
Year Entry Stock Exit Year Entry Stock Exit Year Entry Stock Exit
1960-1969 2 2 0 1990 0 15 0 1990 0 6 0 1970 2 4 0 1991 2 17 0 1991 2 8 0 1972 1 5 0 1992 2 19 0 1992 1 9 0 1973 1 6 0 1993 2 21 0 1993 0 9 0 1975 4 10 0 1994 2 23 0 1994 3 12 0 1976 1 11 0 1995 0 23 0 1995 0 12 0 1978 1 12 0 1996 0 23 0 1996 0 12 0 1981 1 13 0 1998 0 23 0 1998 0 12 0 1983 1 14 0 1985 3 17 0 1986 1 18 0 1987 3 21 0 1989 1 22 0 1991 1 23 0
(Source: 1997 LCD Panel & CF Data Book)
Although these findings favor the early entrants‟ side, they imply that, for any entry, the speed of technological advances, the quality of resources and capabilities, and size of the firm are keys for a firm‟s market entry decision when the industry evolves into the new product generation. Studies on order of entry in new businesses are also a popular subject. Findings conclude that early entrants outperform early followers and late entrants with respect to both market share and return on investment (Lambkin 1988), early entrants had quality, service, and technological advantages over followers (Miller, Gartner, and Wilson 1989). However, while strong finance skills are associated with early entrants, strong marketing skills are associated with late entry (Robinson, Fornell and Sullivan 1992) and more early entrants choose differentiation strategies, while followers tend to select low-cost strategies (De Castro and Chrisman 1955).
This paper examines whether the process of entering the market, as well as industry-specialized assets and positioning in the applied technologies should differ between early entrants and late entrants in the LCD industry, where the industry evolves and provides different types of displays and where LCD technologies have become major parts of new applied product generations. The early entrants‟ skills and resources should be different from late entrants (Robinson, Fornell and Sullivan 1992). Firms which possess different resources in different environments with different decision-makers and different objectives do not necessarily make the same strategic decision upon entry (De Castro and Chrisman 1995). The empirical investigation of successful technological innovation in five different industry segments by Utterback and Abernathy (1975) suggested that most innovations introduced by firms in the early stage of product development were relatively more original, while most innovations in the later stage were adopted from material suppliers, equipment suppliers, by license, imitation, or by transferring existing technologies from other applications. The early entrants seem to have built up the know-how required to produce various LCD displays by involvement in the research and development stages and production of TN, STN and TFT, while the later entrants would enter the newest or the older generation product market directly, depending on their needs, capital, and other industry-specialized resources they process. More specifically, early entrants tend to be firms that have no prior experience, and these firms tend to grow by relying on technological advantage, while later entrants tend to be firms that have accumulated experience in related fields, particularly from firms in downstream sectors. Early entrants‟ technology in the industry tends to be original, while later entrants tend to free ride off of the early entrants‟ technological advantage. The study also investigates whether all firms follow the same strategic decisions upon entering the market when they enter at similar times, whether early or late. Late entrants would not only enter the newest product generation of their core or basic technology which may have become a necessary component for their related products, but some among them would enter older product generation, simply because it is easier to imitate and less costly to produce.
3-1 Hypotheses
The argument on the different entry patterns and timings of early and late entrants in a basic industry, where the technology changes its output variety over time, provides several testable hypotheses. Entry order and their relationship with those factors are examined in this section. Technological innovation and first-mover advantage theories provide the following hypotheses.
Hypothesis 1: The more experience a firm has in LCD related R&D activities, the earlier it enters the market. Hypothesis 2: The larger the firm, the earlier it enters the market.
Hypothesis 3: The industry-specialized assets the firm has, the earlier it will enter the market.
Hypothesis 4: Producing a specific LCD applied technology encourages a firm‟s early entry into the LCD market.
3-1-1. The Early Entrants
Various „first-mover advantage‟ literature suggests that pioneers can gain advantage through sustainable leadership in technology. Early entrants may gain advantages derived from the learning or experience curve (Lieberman and Montomery 1988; Levin et al. 1987; Cohen, Nelson, and Walsh 1997). As early entrants can learn how to perform the task well, many of the costs associated with the performance of a task are reduced faster; therefore, the expected appropriate quasi rents for them will be higher. To a lesser extent, early entrants can patent or maintain technology as trade secrets and protect first-mover gains from imitators (Gilbert and Newbery 1982; Reinganum 1983; Fundenberg et al. 1983; Lieberman and Montgomery 1988). Although it is known that patents do not work well to protect innovation and its profits (Mansfield et al. 1981, Levin et al. 1987, Teece 1986), patents are seen as a proxy measure of inventive and innovative activities (Pavitt 1988), particularly for pioneers. Lieberman and Montgomery (1988) propose that those firms who have an entrepreneurial vision and new-product R&D become excellent first movers. Early entrants are more likely to enter with a broader product line, a more extensive market distribution network and a larger production capacity than those of the late entrants (Lambkin 1988).
3-1-2. The late Entrants
Unlike first-mover firms, late-mover firms have benefited from the ability to „free-ride‟ off of first-mover investments, the resolution of technological and market uncertainty, shifts in technology, and various types of incumbent inertia (Lieberman and Montgomery 1988). Many empirical tests of late-mover advantages have been conducted in marketing strategy research (see Lieberman and Montgomery 1998 for review). An innovative late entry in the pharmaceutical industry generated a sustainable advantage by having a higher market potential and a higher repeat purchase rate than either the pioneer or non-innovative late movers. The innovative late entry grew faster than the pioneer, slowing the pioneer‟s diffusion, and reducing the pioneer‟s marketing effectiveness (Shankar, Carpenter, and Krishnamurthi 1998). Some late entrants merely enter a particular segment of the market where its entrant barrier is low since its technologies are easy to imitate and its production cost is low. How about the entry into the segment with higher barriers to entry? When these late movers are those, which are already established in other markets, they tend to possess related tangible and intangible assets or excess capacities that can be put to practical use in various markets (Caves and Porter 1977). Some of the late entrants, who are already established in related industries, originally turned necessary LCD displays over to the early entrants; however, the latter may decide to produce their own LCD displays since they cannot practice price discrimination in stages in which they do not operate (Stigler 1983). Entering into the LCD market allows those late entrants to gain a control of the vital components for their products, such as PCs. They already have established distribution channels, which always counted as one of the early entrants‟ advantages, since they also produce LCD applied products. It is also possible that vertical integration increases the difficulty of entry by new firms, by increasing the capital and knowledge necessary to conduct several types of operations rather than depending on rivals for supplies or markets. Entering the core market enables such late entrants to control entire product production, downstream to up stream. When a component becomes an important part of their products, technically or cost-wise, all firms with capital and entrepreneurship available for use attempt to vertically integrate the market backward. This indicates that the late movers who are established firms tend to possess assets or capacities that enable them to enter into other markets. In an intra-industry analysis of the petroleum refinery industry, backward integration into crude oil pipelines was
necessary for the successful operation of a petroleum refinery (Stigler 1983). This suggests that backward integration into LCD industry must be necessary for the competitive PC manufacturers. Also, by vertical integration, their purpose of entry should be for products specific to the applied technologies or products they possess. Sometimes late entry occurs in the form of direct investment, licensing, acquisition of, or alliance with, an existing firm (Robinson, Fornell and Sullivan 1992).
3-1-3. Company Size and Entry Pattern
Earlier theoretical literature pointed out that the firms are identical along all dimensions except timing and size (Lieberman and Montgomery 1988). Since the LCD Industry is highly capital intensive, the size of the firm affects how the entry is investigated. The earlier literature in first-mover advantages only pointed out than when the shifts in a technology happen incrementally, larger incumbents were typically the first to enter, but conversely, if the shift is radical, larger incumbents cannot adapt the changes and become late entrants (Thomas 1995, 1996; Henderson and Clark 1990; Henderson 1993; Christensen 1993). There is much theoretical and empirical literature in process technology diffusion suggesting that firm size might play an important role (Oster, 1982: Hannan and McDowell, 1984: Levin, Levin, and Meisel, 1987: Rose and Joskow, 1990). Those findings suggest mixed results, but larger firms are more likely to become innovative than are smaller firms, the exception being the U.S. steel industry. How about entry into the older product and technology market? As the LCD industry evolves, advanced LCD technologies require more capital investment for their production; however, products which require smaller capital investment with easily imitable technologies also coexist in the industry. In other words, the LCD industry seems to provide various entrant opportunities, in terms of size and technologies, for new entrants, and different product and technology markets within the industry should attract different types of firms.
4. A TEST OF ORDER OF ENTRY IN THE LCD INDUSTRY WHERE A NEW PRODUCT
GENERATION ARISES
4-1. Data and Descriptive Statistics
This study used various databases. As a proxy to examining the R&D activities of early entrants and late entrants, simple counts and citation counts of patent data are used. The available published R&D data is still limited and patent statistics are a good indicator of input (Griliches 1990). In an empirical study of the computed tomography industry (Trajtenberg 1989, 1990), simple patent counts were found to be highly correlated with R&D expenses, while citation counts were found to be highly correlated with consumer surplus gains from innovations. This relation held in several other studies (Bound et al.1984; Pakes and Griliches 1984; Hausman, Hall and Griliches 1984; Scherer 1965, 1983). Simple patent counts were also found to be in proportion to the total volume of sales or investment in an industry (Schmookler 1966; Griliches and Schmookler 1963). Searching the Japan Patent Office database, we located and retrieved all Japanese patents granted for LCD technology from 1979 to 1986, totaling 7,781 patents. As is standard practice, patents are dated according to their application date rather than their granting date, since it takes a few years to be granted a patent following the acceptance of an application. Citation counts were obtained from the Patent Office‟s compiled data book, which analyzes cited patents by rejected patent applications in the LCD industry between 1988 and 1991, totaling 2,095. Originally, those cited patents were granted between 1981 and 1987. There were more citations in the cases where the innovation originating in the cited patent had been later found to be valuable.
In the Trajtenberg model (1990), the citation-weighted patent counts (WPC) for a given product in a given year, t, is described as
i
n i tC
WPC
t
1
1 , (1)where i = each patent, Ci = actual number of citations that it subsequently received, and nt = the number of patents
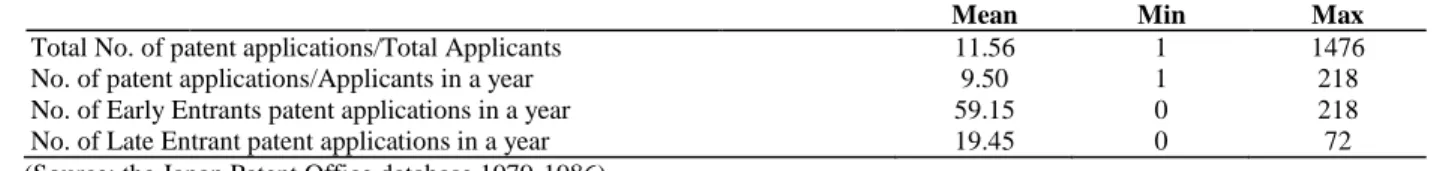
Table 4: Overall Patent Statistics
Mean Min Max
Total No. of patent applications/Total Applicants 11.56 1 1476
No. of patent applications/Applicants in a year 9.50 1 218
No. of Early Entrants patent applications in a year 59.15 0 218
No. of Late Entrant patent applications in a year 19.45 0 72
(Source: the Japan Patent Office database 1979-1986)
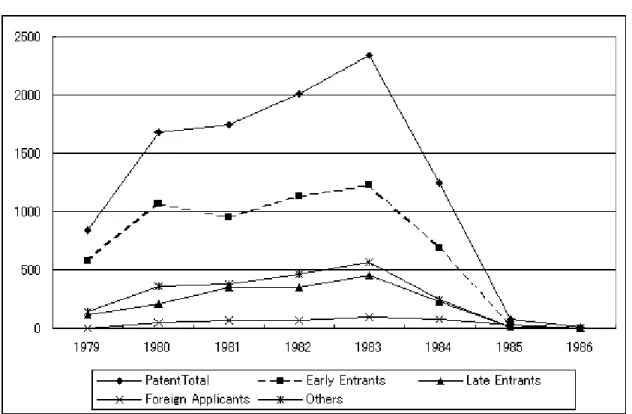
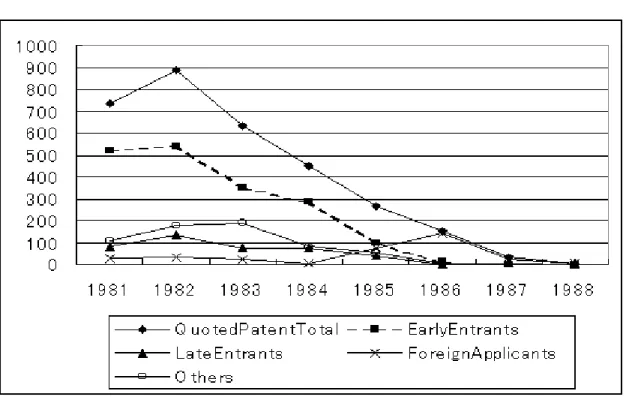
The general trends in patent and citation data provide details on the LCD industry entry. Patent application rushes were observed between 1979 and 1986 (see Figure 2), and the patent data for this period are used in this paper5. There were from 50 to 200 patent applicants every year between 1979 and 1984, and to a lesser extent from 1985 to1986 (see Figure 3). The early-entrants group alone represents more than one-half of patent applications each year and their citation levels are also high (see Figure 4)6. Furthermore, more than one-third of the applicants applied for only one or two patents each year and did not apply for patents every year (see Figure 5). The overall average patent rate is significantly lower than those of early and late entrants (see Table 4). From a patent point of view, the early entrants, together with the late entrants of these 23 firms can be considered as a good proxy of the industry itself for this analysis. Both patent and citation data suggest significant R&D activities by early entrants.
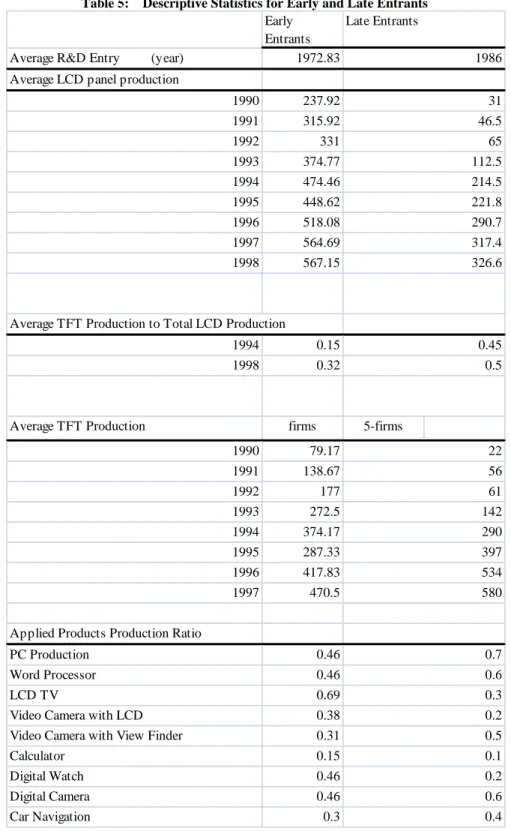
Other databases used in this study included the LCD/PDP Manufacturers Planning Data Book, LCD Panel & CF Data Book and annual reports. Descriptive statistics for those data for early and late entrants accordingly are shown in Table 5.
Accumulated outputs are regarded as a measure implied by the standard form of the learning curve, and the highly significant relations between the product level and the learning curve have been shown in much learning-by-doing literature (see, e.g., Alchian 1963; Dick 1991; Ghemawat 1984; Lieberman 1987, 1989; Porter 1984). The lag between patent data and production data reflects the time between the decision for product entry and the period required for the firms to construct a new LCD plant and start actual manufacturing after the R&D process. Accumulated output data and the standard form of the learning curve also suggested significant early entrants‟ experience in production.
The summary statistics on productions in Table 5 imply significant differences between LCD productions in these two entry groups. While the average LCD panel production for late entrants has been lower than that of early entrants throughout the years, the average TFT production7 for late entrants has exceeded that of early entrants since 1995. The ratio of TFT production to LCD panel production reveals that around one-half of the late entrants group targeted mainly TFT, which is more than did so in the early-entrants group. A list of applied products supports this production trend, as 70% of late entrants produce PCs (including both desktop and notebook PCs)8. This data suggests that these late movers are those, which are already established in related industries, such as the PC industry, and which have entered the LCD industry in order to vertically integrate their production process. In contrast, the LCD-TV is the product most commonly produced by the early entrants.
Details of entry patterns for different types of LCD and their relationships with companies‟ amount of capital are shown in Table 6. Since TFT production is highly capital-intensive, late entrants with large amounts of capital tend to enter that market while late entrants with lower amounts of capital enter the less expensive TN-LCD and STN-LCD markets.
6 Details of Quoted Patent Counts by Various LCD Technologies are shown in Figure 4.
8PC is also one of the major and important LCD applied products for early entrants as shown in Table 6. 46% of them produce PCs.
Figure 2: LCD Patents Application Counts by Entry Timing 1979-1986
Figure 4: Quoted Patent Counts 1981-1987
Table 5: Descriptive Statistics for Early and Late Entrants
Table 7 shows different LCD applied products produced according to firm size. Firms with larger amounts of capital are highly related to PC production. This implies that those producing PCs, where the main and most costly component is the LCD, entered the LCD industry as late entrants in order to vertically integrate the production process backward. Some of the small-capital early entrants produce applied products as well, while
Early Entrants Average R&D Entry (year) 1972.83 Average LCD panel production
1990 237.92 1991 315.92 1992 331 1993 374.77 1994 474.46 1995 448.62 1996 518.08 1997 564.69 1998 567.15 1994 0.15 1998 0.32
Average TFT Production firms 5-firms
1990 79.17 1991 138.67 1992 177 1993 272.5 1994 374.17 1995 287.33 1996 417.83 1997 470.5
Applied Products Production Ratio
PC Production 0.46
Word Processor 0.46
LCD TV 0.69
Video Camera with LCD 0.38
Video Camera with View Finder 0.31
Calculator 0.15 Digital Watch 0.46 Digital Camera 0.46 Car Navigation 0.3 0.2 0.5 0.1 0.2 0.6 0.4 580 0.7 0.6 0.3 56 61 142 290 397 534 0.45 0.5 22 326.6
Average TFT Production to Total LCD Production
65 112.5 214.5 221.8 290.7 317.4 Late Entrants 1986 31 46.5
Table 6: Distribution of Output of LCD Industry by Relative Size of Company
Company size is based on capital data in FY 1999, production number is based on 1996 data. Production percentages are described as the percent of the 23-company total.
Table 7: LCD Applied Products Produced by Ralative Size of Company
Company Size (in 000 million yen)
Number of Companies PC Word Processor LCD TV VTR with LCD VTR with Camera Digital Camera Car Navigation EE LE EE LE EE LE EE LE EE LE EE LE EE LE EE LE Under 10,000 3 1 0 0 0 0 8.33 0 0 0 0 0 8.33 0 0 0 10,000 to 100,000 6 1 15.38 0 16.67 0 33.33 0 14.29 0 0 0 16.67 0 12.50 0 100,000 to 200,000 1 4 7.69 23.08 8.33 16.67 8.33 8.33 14.29 14.29 11.11 44.44 8.33 25.00 12.50 12.50 200,000 to 300,000 3 2 23.08 15.38 25.00 16.67 25.00 8.33 42.86 0 33.33 0 16.67 16.67 25.00 12.50 300,000 to 400,000 0 1 0 7.69 0 8.33 0 0 0 0 0 0 0 0 0 12.50 400,000 to 500,000 0 1 0 7.69 0 8.33 0 8.33 0 14.29 0 11.11 0 8.33 0 12.50
5. EARLY ENTRANTS AND LATE ENTRANTS: STATISTICAL METHODS
To test the process of entering the market, simple counts (PATt) and citation counts of patent data (CITt) are
used as a proxy to examining the R&D activities of early entrants and late entrants since most of the firms entered the LDC market on the research side first. In order to test their possession of industry-specialized assets, two variables were defined: possession of specific LCD product technologies and capital investment amount for LCD related products (INVt). Major LCD products, TFT (TFTt), STN (STNt), and TN (TNt) are dummy variables
designed to control for differences in the LCD product mix for entry patterns. In order to test their positioning in the applied technologies, two major LCD applied products, PC (PCt) and LCD TV (LCDTVt), also dummy variables,
are included. In a later analysis, in addition to PC and LCDTV, other applied products such as the Japanese Word processor, VCR with LCD, VCR with Camera, Calculator, Digital Watch, Digital Camera, and Car Navigation were used as dummy variables. A time variable (TIMEt) is measured by the time in years, since LCD product
development started in 1960, to the year of first production entry of each firm (See Table 8 for definitions of variables).
5-1. Proportional hazard model analysis
Since this analysis focuses on population heterogeneity between two different entry groups in the LCD market, associations between the covariates and entry timings were evaluated with proportional hazard models. The Cox (1972) proportional hazard models are often used to measure the conditional probability of adoption of the innovation (Hannan and McDowell 1984; Levin, Levin, and Meisel 1987; Rose and Joskow 1990, Karshenas and Stoneman 1993); however, there have been few empirical works that test the order of entry using survival data models. Mascarenhas (1992) examined the macro order of market entry, the micro intra-market entry order, and the performance in the offshore oil-drilling industry, using survival data analysis which employed the Cox regression. He lled out three important types of information necessary to conduct survival data analysis: the incident of an event (an organization introduces the new product to a market), its timing (the time from initial product
EE LE EE LE EE LE EE LE EE LE EE LE EE LE Under 10,000 3 1 6.6 0.16 31.35 0.88 12.92 0.29 0 0 3.14 0.32 5.85 0 10,000 to 100,000 6 1 17.12 0.52 55.08 5.66 25.53 1.25 10.97 0 13.07 0.66 31.87 0.26 100,000 to 200,000 1 4 5.61 4.48 1.46 0.2 14.56 6.45 0.18 4.56 8.63 8.47 3.69 13.09 200,000 to 300,000 3 2 40.52 22.3 5.37 0 37.14 1.86 41.99 37.74 36.27 23.84 28.7 11.23 300,000 to 400,000 0 1 0 2.07 - 0 - 0 - 3.51 - 5.08 - 4.22 400,000 to 500,000 0 1 0 0.62 - 0 - 0 - 1.05 - 0.53 - 1.1 Percent of Accumulated LCD Related Investment 1980-1998 Percent of Accumulated Patent Counts 1979-1986 Company Size
(in 000 million yen)
Number of Companies Percent of LCD Production Percent of TN Production Percent of STN Production Percent of TFT Production
development until an organization introduced the product to a market), and censoring (recognition that some markets in question have yet to be entered at the end of the study period). His analysis showed that early followers exhibit significantly lower survival duration than first entrants and later entrants, and that the first three entrants survived longer in subsequent markets. Mitchell (1989) used the accelerated event-time method to test entries into emerging technical sub-fields in the American medical diagnostic imaging industry. The accelerated event-time method is one approach used to analyze survival data where a suitable explanatory variable may be a time-dependent binary variable that jumps from 0 to 1 at the point of event occurring (Cox and Oakes 1984). He claimed that the accelerated event-time method provided a means of estimating influences on the length of waiting periods for entry.
The hazard model assumes that each variable has a failure time. Let a single nonnegative T be assumed as a random variable whose distribution function, density function, survival function, hazard function and cumulative hazard function are
F(t)=Pr(T < t), (2) f(t), (3) S(t)=Pr(T
t)=1-F(t), (4)
t
S
t
f
t
h
dt
t)
T
|
dt
t
T
Pr(t
, (5) respectively, and
t
t
S
ds
s
h
t
H
0log
. (6)In several survival modelings, the proportional hazard model is a typical generalized linear model with dependent variable vector x and can be written as
h
t
,
x
h
0(
t
)
exp
x
T
, where h0(t) is the baseline hazardfunction (Cox and Oakes 1984). The hazard rate,
h
i
t
, is defined as the probability that firmi
will start LCD production at time t conditional on having not produced any LCD before t. The Weibull distribution is easily represented with the hazard function and survival function with scale parameter
and index
ash(t)=
t
1, S(t)=exp -
t
(
> 0). (7)Allowing the variable t to represent the time of entry for early entrants that started LCD production before 1990 and the time of censoring for late entrants, the likelihood function for the model‟s parameters of interest is
0 1 i i i iD i D i if
t
iS
t
L
t
. 6. RESULTSThe first column of Table 9 reports the early entrants timing tests and the second column of the table reports the test of the late entrants timing hypotheses. For both early and late entrants, the Weibull distribution predicted that a firm entered earlier when the firm has more citation counts of patent data (CITt). This supports
hypothesis 1 for both early and late entrants that the more experience the firm has in the LCD related R&D activities, the earlier it enters the market. Hypothesis 2 regarding size of the firms was supported for early entrants but rejected for late entry timing. This suggested that late entrants were more varied in firm size, while firm size
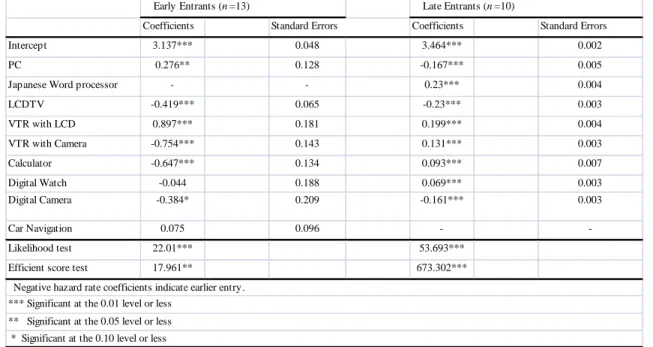
played a major role in entry decision for early entrants. Hypothesis 3 predicted that the firms with more industry-specialized assets will enter the market earlier. The prediction was mostly supported for the early entrants. Firms with higher LDC capital investment and TFT and STN production entered the market earlier; however, for late entrants, LCD capital investment was rejected while TFT and TN production were supported. Since most of the applied products utilizing LCDs are laptop PCs, in which TFT-LCD displays are used, this suggested that both entrants targeted TFT-LCD production. These results implied that the small-cap late entrants mainly produced TN-LCD, which required less cost and less technological sophistication. As far as hypothesis 4 is concerned, producing a specific LCD applied technology, LCD-TV was supported for early entrants while the PC, as well as the LCD-TV encouraged a late entry firm to enter the LCD market earlier. Table 10 further analyzed the relationship between order of entry and the LCD applied products produced by the firm. These results also suggested different LCD applied products related to LCD market entry for two the entry groups. For early entrants, firms with LCD-TV, VCR with camera, calculator, digital watch, and digital camera productions entered significantly early, while firms with PC, LCD-TV and digital camera productions entered significant early for the late entrants. Products, such as VCR with camera, digital watch and calculators, were considered as historical LCD related applied products, where the PC, LCD-TV9, and digital camera are products for now and the future. These results also supported hypotheses 4.
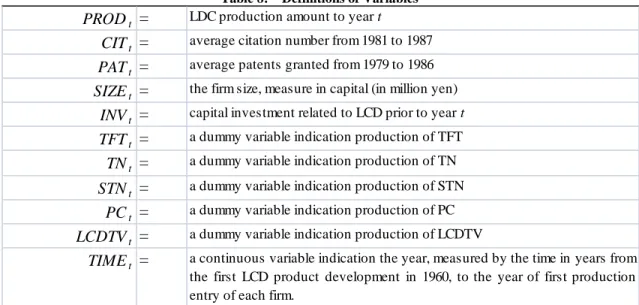
Table 8: Definitions of Variables
9 Although palm-size LCD-TV s has been produced since the early days of LCD history, wall-mount LCD-TVs, which replace
conventional TV are released and gained popularity in recent years.
PROD
t=
CIT
t=
PAT
t=
SIZE
t=
INV
t=
TFT
t=
TN
t=
STN
t=
PC
t=
LCDTV
t=
TIME
t=
LDC production amount to year t
average citation number from 1981 to 1987 average patents granted from 1979 to 1986 the firm size, measure in capital (in million yen) capital investment related to LCD prior to year t
a dummy variable indication production of TFT a dummy variable indication production of TN a dummy variable indication production of STN a dummy variable indication production of PC a dummy variable indication production of LCDTV
a continuous variable indication the year, measured by the time in years from the first LCD product development in 1960, to the year of first production entry of each firm.
Table 9: Hazard Rate Model on Timing of Entry into LCD Industry
Table 10: Model of Early Entrant, Late entrant and LCD Applied Products
7. CONCLUSION
This paper has investigated the different entry patterns and timings of early and late entrants in the LCD industry, a basic industry, where technology output varies over time. Although data was only for 23 leading Japanese firms, the cumulative evidence from the analysis in this paper provides strong support for the hypothesis,
Coefficients Coefficients
Intercept 3.413*** 0.153 3.742***
CIT -0.006** 0.003 -0.002***
PAT 0.002** 0.001 3.09E-04***
SIZE -5.13E-07 6.35E-07 6.01E-07***
INV -2.05E-04 4.57E-04
-TFT -0.106 0.082 -0.08*** TN 0.222* 0.114 -0.318*** STN -0.485** 0.202 0.036 PC 0.134 0.154 -0.374*** LCDTV -0.379*** 0.078 -0.159*** Likelihood test 23.907*** 33.326*** Efficient score test 22.078*** 670.698***
** Significant at the 0.05 level or less * Significant at the 0.10 level or less
Negative hazard rate coefficients indicate earlier entry. *** Significant at the 0.01 level or less
0.067 0.046 0.079 0.013 3.71E-04 5.33E-05 1.22E-07 -0.029 Early Entrants (n=13) Late Entrants (n=10)
Standard Errors Standard Errors
0.024
Coefficients Coefficients Standard Errors
Intercept 3.137*** 0.048 3.464*** 0.002
PC 0.276** 0.128 -0.167*** 0.005
Japanese Word processor - - 0.23*** 0.004
LCDTV -0.419*** 0.065 -0.23*** 0.003 VTR with LCD 0.897*** 0.181 0.199*** 0.004 VTR with Camera -0.754*** 0.143 0.131*** 0.003 Calculator -0.647*** 0.134 0.093*** 0.007 Digital Watch -0.044 0.188 0.069*** 0.003 Digital Camera -0.384* 0.209 -0.161*** 0.003 Car Navigation 0.075 0.096 - -Likelihood test 22.01*** 53.693***
Efficient score test 17.961** 673.302***
** Significant at the 0.05 level or less * Significant at the 0.10 level or less *** Significant at the 0.01 level or less
Early Entrants (n=13) Late Entrants (n=10) Standard Errors
positioning of the applied technologies between the two groups, early and late entrants, exist. Early entry into the LCD industry is positively related to experience in the LCD related R&D activities, measured by cited patents and the length in R&D activities. As accumulated outputs are regarded as a measure implied by the standard form of the learning curve, this is consistent with prior studies on first-movers which propose that early entrants may gain advantages derived from the learning or experience curve. Patents most likely protect their technological advantages. Large-capital late entry into the LCD industry is positively related to company size as these firms have excess capital to spend on R&D. Entry timing is positively related to specific LCD products, TFT and LCD applied products, PCs. This implicitly suggests that firms which produce PCs have entered the market in order to vertically integrate the production process backward. As data suggested, the late entrants are established firms in their core industries, possess related assets or excess capacities that enable them to enter into another industry, in this case, the LCD market. On the other hand, smaller-capital late entrants into the LCD industry have no accumulated R&D activities or production of applied products, which implies that they are free riding off of early entrants‟ investment. According to the findings, the larger the amount of capital of the firm, the larger the production output and LCD investment, regardless of entry timing. This indicates that although production economies of scale act as mobility barriers for the early-entry group and increase its potential profitability, the significance of production-scale economies by established firms‟ late entrants is also found. The established firms‟ late entrants tend to possess assets or excess capacities from related industries to enable them to enter into other markets as the established firms. Firm size, however, did not influence probability or timing of entry. This result suggests that a firm with long, proven R&D activity records in the LCD industry entered the market early regardless of its size.
AUTHOR INFORMATION
Michiko Miyamoto studied at the State University of New York College at Buffalo, where she received her Bachelor of Science degree (magna cum laude). She received her MBA from the University of California at Los Angeles. After a 7-year career with Goldman Sachs and Company, obtained her PhD further to a thesis about Econometrical Approaches to Economic and Strategic Management Studies at theUniversity of Tsukuba, Graduate School of Systems Management. In 2008, she joined the Department of Management Science and Engineering at the Akita Prefectural University.
REFERENCES
1. Alchian, A., Reliability of progress curves in airframe production, Econometrica, 31, October, pp.679-693, 1963.
2. Bound, J., C. Cummings, Z. Griliches, B. Hall, and A. Jaffe, Who does R&D and who patents? In Zvi Grilliches, R&D Patents and Productivity, Chicago, University of Chicago Press, 1984.
3. Caves, R.E. and M.E. Porter, From entry barriers to mobility barriers: Conjectural decisions and contrived deterrence to new competition, Quarterly Journal of Economics, 91, pp.241-261, 1977.
4. Christensen, C. M., The rigid disk drive industry: A history of commercial and technological turbulence,
Business History Review 67, pp.531-588, 1993.
5. Ghemawat, P., Capacity expansion in the titanium dioxide industry, Journal of Industrial Economics 33, 145-163, 1984.
6. Griliches, Z., Econometric Models for Count Data with an Application to the Patents-R&D Relationship,
Econometrica, 52, pp.909-938, 1984.
7. Griliches, Z., Patent statistics as economic indicators: A survey, Journal of Economic Literature, XXVIII, pp.1661-1707, 1990.
8. Griliches, Z., and J. Schmookler, Inventing and maximizing, American Economic Review, 53, pp.725-729, 1963
9. Hannan, T.H. and. J.M. McDowell, The determinants of technology adoption: The case of the banking firms Rand Journal of Economics, 15 (3), pp.328-335, 1984.
10. Hausman, J., B. Hall, and J. Griliches, Econometric models for count data with an application to the patents R&D relationship, Econometrica, 52, September, pp.909-938, 1984.
11. Henderson, R.., Underinvestment and incompetence as responses to radical innovation: Evidence from the photolithographic alignment equipment industry, Rand Journal of Economics, 24(2), pp.248-270, 1993.
12. Henderson, R. and K. Clark, Architectural innovation: the reconfiguration of existing product technologies and the failure of established firms, Administrative Science Quarterly, 35, pp.9-30, 1990.
13. Levin, S.G., S.L. Levin, and J.B. Meisel, A dynamic analysis of the adoption of a new technology: The case of optical scanners, The Review of Economics and Statistics, 69, pp.12-17, 1987.
14. Lieberman, M.B., Patents, learning-by-doing, and market structure in chemical processing, International Journal of Industrial Organization 5, pp.257-276, 1987.
15. Lieberman, M.B., The learning curve, technology barriers to entry, and competitive survival in the chemical processing industries, Strategic managementJournal 10, pp.431-447, 1989.
16. Lieberman, M.B. and D.B. Montgomery, First-mover advantages, Strategy Management Journal, Summer Special Issue, 9, pp.41-58, 1988.
17. Mitchell, W., Dual clocks: entry order influences on incumbent and newcomer market share and survival when specialized assets retain their value, Strategic Management Journal, 12 (2), pp.85-100, 1991.
18. Oster, S., Intraindustry Structure and the Ease of Strategic Change, The Review of Economics and Statistics, 64(3), pp.376-383, 1982.
19. Pakes, A. and Z. Griliches, Patents and R&D at the firm level: A first look, In Zvi Grilliches, ed., R&D Patents and Productivity, Chicago: University of Chicago Press, 1984.
20. Robinson, W.T., C. Fornell, and M. Sullivan, Are market pioneers intrinsically stronger than later entrants?
Strategic Management Journal 13 (8), pp.609-624, 1992.
21. Porter, M. E., Strategic interaction: some lessons from industry histories, In R. Lamb, ed., Competitive Strategic Management, Englewood Cliffs: Prentice Hall, 1984.
22. Rose, N.L. and P.L. Joskow, The diffusion of new technologies: Evidence from the electric utility industry,
Rand Journal of Economics, 21(3), Autumn, pp.354-373, 1990.
23. Scherer, F. M., Firm size, market structure, opportunity, and the output of patented inventions, American Economic Review, 55, December, pp.1097-1125, 1965.
24. Schmookler, J., Invention and Economic Growth, Cambridge: Harvard University Press, 1966.
25. Scherer, F. M., The propensity to patent, International Journal of IndustrialOrganization, 1, pp.107-128, 1983.
26. Stigler, G. J., The organization of industry, Chicago: University of Chicago Press, 1983. Originally Published: Homewood, Ill, R. D. Irwin, 1968.
27. Thomas, L.A., Brand capital and incumbent firms Positions in Evolving Markets, Review of Economics and Statistics, 77(3), pp.522-534, 1995.
28. Trajtenberg, M., The welfare analysis of product innovations, with an application to computed tomography scanners, Journal of Political Economy, 97(2), pp.444-479, 1989.
29. Trajtenberg, M., A penny for your quote: Patent citations and the value of innovations, RAND Journal of Economics, 21, Spring, pp.172-187, 1990.