What Scale of Audience a Campaign can Reach in
What Price on Twitter?
Yubao Zhang
1,2, Xin Ruan
1, Haining Wang
1and Hui Wang
21
Department of Computer Science, College of William and Mary, Williamsburg, VA, USA
2College of Information System and Management,
National University of Defense Technology, Changsha, Hunan, P.R.China
Abstract—Campaigns with commercial and spam purposeshave flooded the Twitter community. To understand what scale of audience a campaign could reach, we first perform a measure-ment study by collecting a dataset of about 10 million tweets via streaming API and one million search tweets for targeting topics, as well as 37,313 user accounts that are suspended by Twitter. From the dataset, we extract a spam campaign and a commercial promotion campaign accompanied by spamming activities. Then, we characterize the way in which a campaign can reach its audience, especially revealing the features that dominate the information diffusion. After identifying the accounts suspended by Twitter, we further inspect to what extent these features can help to weed out spam accounts. Also, the retrospective inspection is useful to uncover the tactics that malicious accounts utilize to avoid being suspended. Using the measurement results, we then develop a theoretical framework based on an epidemic model to investigate the dynamics of spammers and victims whom spammers reach in the spam campaign. With the theoretical framework, we conduct a benefit-cost analysis of the spam campaign, shedding lights on how to restrict the benefit of the spam campaign.
I. INTRODUCTION
Twitter provides an economic and fast channel to reach a large number of users through direct mentions and its online social networks. Due to the efficiency of informa-tion diffusion, large-scale campaigns flourish in the Twitter community, including commercial promotion campaign and spam campaign [1], [2]. As most of campaigns are associated with spamming activities, campaigns have garnered a great deal of attention from researchers aiming to improve spam detection [3], [4], [5]. The previous works identify campaigns mainly through clustering URLs or calculating similarity of text. However, it has become more difficult to cluster URLs correctly due to URL shortening service, and at the meantime, text can be easily manipulated by spammers. Instead, we resort to collecting campaign tweets by clustering hashtags associ-ated to a campaign and searching tweets of these hashtags. Although a campaign may make use of a collection of hashtags rather than a single hashtag, we can keep track on the hashtags of a campaign as long as the campaign is active.
As commercial promotion campaigns tend to be accom-panied by spamming activities [1], [2], we focus on how spammers behave in both spam and commercial promotion campaigns. However, instead of actively detecting spammers in a campaign based on account behavioral features, we delve into inspecting the way in which spammers would reach a wide audience in the campaign, i.e., mention network and online social network. The mention network is composed of
direct mentions from one account to another in the campaign. Mention is enabled by adding ‘@username’ in a tweet, and users who are mentioned will receive a mention notification. The online social network represents follower-following re-lationships. The investigation on how promotion or malware diffuse in mention networks and online social networks helps us to understand the strategy of spammers in the campaign and figure out what scale of audience the campaign can reach. From the perspective of information diffusion, we characterize diffusion related features (degree, neighborhood connectivity, and burstiness) in mention networks, as well as degree and response time in online social networks.
To obtain the insights into detecting spammers with dif-fusion related features, we identify the accounts that are sus-pended by Twitter. The information about sussus-pended accounts enables us to conduct a retrospective inspection on suspended accounts. In particular, we seek the common diffusion features of a mention network, which exist among these suspended ac-count. We observe that the accounts with bursty and distributed features are more likely to be suspended. This is because the purpose of spammers in a campaign is to reach as many accounts as possible. Also, we find some spam accounts would avoid being suspended if they were mentioned frequently by other accounts. Although the focus of this work is not to design a specific algorithm for detecting spam accounts, we believe that the study of the diffusion features inside a campaign is critical to develop more advanced detection algorithms and reveal the tactics that spam accounts utilize to avoid being suspended.
Upon the inspection of mention networks and online social networks inside the Twitter, we further develop a theoretical framework based on an epidemic model to analyze the dy-namics of spammers and audience whom spammers reach. The theoretical framework in turn enables us to quantify the benefit and cost of spammers when they launch a campaign. We define the benefit of a campaign as the audience that it reaches, since in essence, the goal of a campaign is to reach as many accounts as possible within a certain period. Meanwhile, the cost is the price that a campaign has to pay for reaching a wide audience, including bursty activity and suspended accounts. Based on the measurement results, we conduct the benefit-cost analysis for a campaign by using the theoretical framework. We further highlight the factor that determines the variation of the ratio between benefit and cost in a specific scenario. Therefore, the benefit-cost analysis of a campaign will shed lights on understanding the strategy of spammers and how to thwart the campaign.
The remainder of the paper is organized as follows. We present the background in Section II. We describe the dataset in Section III and provide an overview of campaigns mined from the dataset in Section IV. In Section V, we characterize mention networks and online social networks to explore what scale of audience a campaign could reach. Section VI presents the theoretical framework developed from an epidemic model and the benefit-cost analysis of a spam campaign based on the theoretical framework. Section VII surveys related work, and finally we conclude this paper in Section VIII.
II. BACKGROUND
A. Information Propagation in Twitter
In general, information propagation in Twitter is mainly through direct mentions and online social networks.
The online social network represents the follower-friend relationship in Twitter. A tweet published by an account will be presented at the personal timeline of all the followers of this account. Each account has different influence, in terms of information diffusion. The influence is mainly measured by the number of followers. Content promoters and spammers are eager for building a functional network of followers to promote content or distribute spam. Aiming at this goal, on one hand, they could buy followers from Twitter account market [5]. Agents running the account business collect a large number of accounts by creating new accounts and obtaining accounts from those customers who are willing to use the service with no charge but at the cost of releasing their credentials. On the other hand, they could also compromise the influential accounts.
Mention is a diffusion method independent of online social network. A tweet with mentions to other accounts will also be presented at their personal timelines. Mention provides a convenient way for normal accounts to communicate with each other, but at the same time, spammers can reach an enormous number of accounts beyond the boundary of their social networks by sending unsolicited messages.
B. Campaigns in Twitter
Campaigns are always launched in Twitter to promote con-tent. A large number of accounts are involved in a campaign to publish tweets, such that the campaign can remain active throughout a period of time. The campaigns could be executed by central controllers orchestrating thousands of accounts, or exhibit a globally decentralized way that is always supported by spam-as-a-service programs [2]. In general, a campaign is bound to a collection of URLs and hashtags.
III. DATASET
We collect about 10 million sample tweets and over one million search tweets sent by 458,746 users within a 21-day window. Firstly, we collect the sample data via Streaming API in Twitter. Then, we extract the hashtags appearing in sample data and rank the frequency each 30 minutes. We record 15 most frequent hashtags, called sample hot topics. We search tweets of these 15 most frequent hashtags (sample hot topics) via search API in multiple machines during the next 30 minutes. These search tweets are used to mine the campaigns from topic connection. We obtain the online social
Sample data Twitter connection Search tweets Topic cluster Campaigns Mention network Social network User timeline Suspended Suspended
Sample hot topics
Fig. 1: Data collection method.
network via Twitter API, and extract mention, retweet and URL information from each search tweet to obtain the implicit diffusion networks. Furthermore, we check users’ timeline two months later to identify if an account is suspended by Twitter. By doing this, we find 37,313 accounts that are suspended by Twitter. The data collection method is illustrated in Fig. 1.
IV. CAMPAIGNS INSAMPLEDATA
In this section, we mine the campaigns from sample hot topics we collect. Campaigns tend to produce and promote a collection of hashtags. We can trace the hashtags of a campaign when the campaign is active. By aggregating the hashtags of a campaign, we can mine the campaign. We then describe the campaigns.
A. Mining Campaigns from Sample Hot Topics
We mine the campaigns from sample hot topics. We build an undirected graphG=< V, E >to represent the relationship among sample hot topics. In this graph, we consider each sample hot topic as a node. There is an undirected edge between two sample hot topics, if they appear in the same tweet. By doing this, we obtain two largest components in the graph, which respectively belong to two campaigns. The largest one includes 36 sample hot topics, while the second includes seven sample hot topics. Literally, all hashtags (e.g., “TeamFollowback” and “Followback”) in the largest compo-nent ask people to “follow back”, while the second appears for “game promotion”. Therefore, we name the two campaigns as “follow back” and “game promotion”.
B. Campaigns
1) “Follow Back”: We show the relationship of hashtags involved in “follow back” in Fig. 2a. We collect a total of 389,063 tweets about “follow back”, in which 7.3% of tweets contain URLs and 26.9% of tweets contain mentions. Through manually checking these URLs, we find that they direct to irrelevant news webpages, webpages in Twitter blacklist and the timeline of some accounts, which are usually suspended. Moreover, the reason why these URLs direct to irrelevant news webpages is that the news tweet is hijacked to re-publish together with certain hashtags. For example, a tweet “(a) #TeamFollowBack #FF @Kaijzer(b) The AgePassengers —pay price— for rescuing French sailor at seaThe AgeCruise ship M... http://t.co/pEIbTPkT” is composed of(a) promoted
hashtags and(b)a news tweet. Within the URLs, 6.8% of them are suspended by Twitter.
“Follow back” campaign complies with the characteristics of a spam campaign, such as directing users to spamming URLs and sending a number of unsolicited messages. The purpose of this campaign is to allure numerous accounts to visit the webpages for exchanging followers or buying followers. Different from legitimate promotion campaigns, they redirect legitimate accounts to underground services (e.g., exchanging followers), which is costly and risky to develop. It results in a considerably low proportion of URLs in the campaign. The campaign mainly depends on mentioning an enormous number of accounts to enlarge the reach and maximize the influence.
(a) “Follow back” (b) “game promotion”
Fig. 2: Relationship of hashtags in “follow back” and “game promotion” 0 200 400 600 800 1000 0 500 1000 1500 2000 2500 3000
Time (Unit: 30 min)
# of tweets
Follow back Game promotion
Fig. 3: Dynamics of “follow back” and “game promotion”.
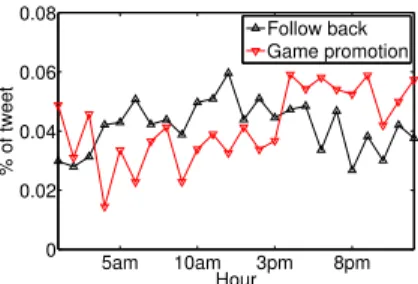
2) “Game Promotion”: We also illustrate the relationship of hashtags involved in “game promotion” in Fig. 2b. There are seven hashtags in “game promotion”. Three of them (“ipad”, “10TurnOns”, and “android”) are trending topics, while the others are all for promoting games. We collect a total of 74,452 tweets, in which 78.7% of tweets contain URLs and only 1.6% of them contain mentions. We find that most URLs direct to the webpages for downloading games or online games. “Game promotion” is a campaign for commercial promotion. It depends on manipulating trending topics to increase exposure to other accounts and eventually gain benefit. Only 0.08% of URLs published in “game promotion” are in the blacklist of Twitter. The dynamics of both campaigns are shown in Fig. 3. There is an interesting observation that these two cam-paigns are executed in different ways. “Follow back” empha-sizes on mentioning a large number of other accounts, but does not post much URLs. “Game promotion” is the opposite, which publishes URLs about products as frequently as possible, but rarely mentions accounts. Moreover, we find the different diurnal sending patterns of these two campaigns. “Follow
5am 10am 3pm 8pm 0 0.02 0.04 0.06 0.08 Hour % of tweet Follow back Game promotion
Fig. 4: Diurnal sending pattern of ”follow back” and ”game promotion.”
back” is active from 4am to 5pm, while “game promotion” is active from 4pm to 8pm, as shown in Fig. 4. Nevertheless, although “game promotion” is a commercial promotion cam-paign, we find there are a significant number of accounts in that “game promotion” campaign are suspended later. At the same time, “game promotion” campaign hijacks trending topics to enlarge the scale of audience whom it reaches. Therefore, “game promotion” employs spamming tactics in despite of its commercial promotion goal.
V. EXPLORINGMENTIONNETWORK ANDONLINE
SOCIALNETWORK
In this section, we characterize mention network and online social network to explore what scale of audience a campaign could reach. Specifically, what scale of audience a campaign could reach through its mention network is determined by outdegree and burstiness of each account; when it comes to its online social network, the number of followers and response time for propagating a content determine the scale of audience that a campaign could reach.
A. Mention Network Analysis
To understand how efficiently a mention network can reach audience, we investigate the following network characteristics: outdegree and indegree, neighborhood connectivity, and ac-counts’ burstiness. Moreover, with the knowledge of which accounts are suspended by Twitter, we inspect the activity of spammers and gain insights into detecting spammers from the features we study in mention networks.
1) Outdegree and Indegree: Outdegree measures the fre-quency that an account mentions others, while indegree mea-sures the frequency that an account is mentioned. The out-degree and inout-degree of accounts are shown in Fig. 5. We observe that: (1) For both campaigns, there exist accounts with extremely large outdegree and indegree. The larger outdegree an account has, the more audience it reaches. Meanwhile, large indegree could serve as a camouflage for spammers, since an account that is mentioned more frequently is more likely to be viewed as legitimate. (2) Most accounts that are mentioned have low indegree values. It implies that campaigns aim to reach as many accounts as possible rather than focusing on specific target accounts. From the modeling prospective, the distribution of outdegree in both campaigns can be approx-imated as Pareto distribution, since most of mentions come from a rather small portion of accounts.
0 1 2 3 4 x 10⁴ 0 2 4 6 8 10 12 log(Outdegree) Accounts 0 2 4 6 x 10⁴ 0 5 10 Accounts log(Indegree)
(a) “Follow back”
0 1000 2000 3000 0 1 2 3 4 5 Accounts log(Outdegree) 0 2000 4000 0 1 2 3 4 Accounts log(Indegree) (b) “Game promotion”
Fig. 5: Outdegree and Indegree.
the relationship between outdegree and account suspension. Outdegree reflects the amount of audience one account can reach. We rank the accounts by outdegree and inspect about top 5% accounts (with outdegree larger than 10). For “follow back” campaign, we check the accounts with outdegree larger than 10. They are in total of 1,291, of which 584 have been suspended by Twitter. However, for “game promotion” campaign, none of 40 accounts with outdegree higher than 10 are suspended by Twitter. Note that the number of accounts being suspended increases as time passes, since potential spammers would be detected.
2) Neighborhood connectivity: In network analysis, the neighborhood connectivity of a node is defined as the average connectivity of all neighbors of this node. Here, the neigh-borhood connectivity of an account is referred to the average outdegree of all accounts that are mentioned by this account. Measuring this metric is to reveal the hierarchical structure of a mention network.
Fig. 6 depicts the neighborhood connectivity of “follow back” and “game promotion”. Note that Fig. 6a is plotted in log-log. Compared with “game promotion”, “follow back” campaign has accounts with neighborhood connectivity less than0.1 in zone I. These accounts connect to a large number of accounts without mentioning others. And also, there are accounts with neighborhood connectivity larger than 10 in zone II. Notice that we obtain the specific values (0.1 and 10) by ranking neighborhood connectivity and choosing about 5% accounts with the largest and lowest neighborhood connectiv-ities, respectively. Their neighbors mention others frequently. We can see about 90% of accounts in zone I are mentioned by accounts in zone II at the early stage. This suggests that the accounts in zone I can be regarded as the executors of the campaign, while the accounts in zone II can be considered as the controllers. Meanwhile, executors further mention the target accounts that do not mention any accounts at all. In other words, there exists a hierarchical structure in the mention network: controllers are on the top and connect to executors, who turn out to reach as many accounts as possible. This implication could be evaluated by inspecting the suspended accounts in zones I and II. In Fig. 5, we can see that both campaigns have accounts with high outdegree. Therefore, there exist executors mentioning a number of target accounts in both campaigns. However, compared with ”game promotion” campaign, ”follow back” campaign exhibits evident clue of centralized control of mentions.
Relationship with Suspended Accounts. We inspect if
ac-100 104 100 105 Accounts(Neighborhood connectivity>0) Neighborhood connectivity I II
(a) “Follow back”
0 50 100 150 0 2 4 6 Accounts(Neighborhood connectivity>0) Neighborhood connectivity (b) “Game promotion”
Fig. 6: Neighborhood connectivity.
−1 −0.5 0 0.5 1 0.7 0.8 0.9 1 CDF Burstiness 0 10 20 0.9 0.95 1 1.05 Outdegree CDF
(a) “Follow back”
−1 −0.5 0 0.5 1 0.85 0.9 0.95 1 Burstiness CDF 2 4 6 0.99 1 1.01 Outdegree CDF (b) “Game promotion”
Fig. 7: Cumulative distribution function (CDF) of burstiness for “follow back” and “game promotion”. Inset is the cu-mulative distribution function of outdegree for accounts with burstiness of −1.
counts classified as executors and controllers of “follow back” are suspended by Twitter. We observe that 581 out of 1,276 executors and 30 out of 200 controllers are suspended by Twitter, respectively. Clearly, executors are suspended more frequently than controllers, due to intensive activity. However, most of suspended accounts in “game promotion” have zero neighborhood connectivity. Therefore, neighborhood connec-tivity should not be applied as an indicator of detecting spammers for “game promotion”, since its mention network has no clear hierarchical structure.
3) Burstiness: Burstiness is the degree of the bursty ac-tivities. Burst means intensive activities in a short period of time [6]. This temporal feature plays a critical role in the information diffusion process during a period of time.
We measure the burstiness of an account as
Burstiness(u) = std(intervalu)−mean(intervalu)
std(intervalu) +mean(intervalu)
, (1)
whereintervalu represents time intervals of account u
men-tioning others. Fig. 7 shows the cumulative distribution func-tion of burstiness for “follow back” and “game promofunc-tion”. It is observed that nearly 60% of accounts in “follow back” and 87% in “game promotion” have the value of burstiness being
−1. However, when we further investigate these accounts, we can see that about 95% of them only mention others twice. Almost all the remainder of accounts in both campaigns have positive burstiness values. In other words, most of accounts exhibit positive burstiness except accounts that only have few mentions.
Relationship with Suspended Accounts. Intuitively, spam-mers would be more bursty than legitimate accounts so as to
reach more target accounts in a short period of time. We rank the accounts by burtiness and obtain about top 5% accounts with the largest burstiness. We inspect those accounts with burstiness larger than0.4in both campaigns. We observe363
out of 869 accounts in “follow back” are suspended, while none of 40 accounts in “game promotion” is suspended.
4) Implication into Spammer Detection: We first inspect the suspended accounts and illustrate which features they exhibit. Afterwards, we further examine the sample accounts randomly chosen from the suspect accounts.
Controllers Execuotrs Outdegree>10 Burstiness>0.4 b c d e f g a 9.2% 24.5% 0 11.1% 0 49.0% 45.8%
(a) “Follow back”
Outdegree>10 Burstiness>0.4
b c
a 0
(b) “Game promotion”
Fig. 8: Relationship between suspended accounts and features of the mention network.
We inspect the accounts exhibiting at least one of the following features: (a) outdegree >10, (b) burstiness >0.4, and (c) classified as controller or executor. For each feature, we show how many accounts are suspended in Fig. 8. For “follow back” campaign, we observe that
• Mention outdegree and burstiness could indicate whether an account will be suspended to a extent, al-though they may not be employed to detect malicious accounts directly.
• However, mention outdegree and burstiness fail to in-dicate those accounts that are classified as controllers. With a closer look into these controllers, we find that they likely avoid being suspended through being mentioned frequently by other accounts.
For “game promotion” campaign, no accounts with outde-gree > 10 or burstiness > 0.4 are suspended. The possible explanation is that there are only a few tweets in “game promotion” campaign which contain mentions.
To verify the implications, we inspect the behavior of these highly suspected but still active accounts. To do this, we collect their continuous tweets of one week by using filter of Streaming API. Fig. 9 shows publishing intervals of two sample accounts. Specifically, the first sample account is an account we classify as controller in “follow back” with outdegree > 10 and burstiness > 0.4, the second account is an account we classify as executor in “follow back” with outdegree>10and burstiness >0.4. It is observed that both accounts exhibit cyclic behavior to some extent. However, the cyclic intervals are mixed with random intervals, i.e., their behaviors manifest both human and bot features. This is one reason why they avoid being suspended. We also click the URLs they published and observe some of them are the same as those of the suspended accounts.
0 100 200 300 400 500 0 2000 4000 6000 8000 10000 Intervals (Unit: 1s) Publishing sequence (a) Sample 1 0 100 200 300 400 0 5000 10000 15000 Intervals (Unit: 1s) Publishing sequence (b) Sample 2
Fig. 9: Two samples of accounts that are highly suspected but still active. 101 102 103 104 105 100 102 104 106 108 Rank Follower # (a) “Follower” 101 102 103 104 105 100 102 104 106 Rank Friend # (b) “Friend”
Fig. 10: Follower number and friend number of both cam-paigns. The red solid line represents “follow back”, while the blue dashed line is “game promotion”.
B. Online Social Network Analysis
Online social network is one of the most important part of social media, through which most of information flows. To explore what scale of audience a campaign could reach through its online social network, we proceed with analyzing accounts’ friend-follower relationship and response time of the two campaigns.
Recall that the mention network we study above is not related to specific content. However, the online social network we study corresponds to some specific contents, e.g., URLs.
1) Followers and Friends: A tweet from an account is broadcast to all of its followers. Similarly, an account would receive all tweets posted by its friends. We say, account A is account B’s follower and account B is A’s friend, if account A follows account B. We investigate the follower and friend distribution of accounts involved in “follow back” and “game promotion” campaigns, respectively. Fig. 10 shows both the follower number and the friend number. The red solid line represents “follow back”, while the blue dashed line is “game promotion”. We find that they are similar to each other, except that there are more accounts in “follow back” without follower and friend than “game promotion”.
The online social network we focus on is a dynamic net-work, which consists of the accounts that propagate some spe-cific contents. The online social network can also be regarded as a functional network for diffusing contents. Consequently, two campaigns construct similar functional networks for dif-fusing contents, in contrary to different mention networks.
2) Response time: Response time is the interval between the time a tweet is posted and the time it is retweeted or replied. Obviously, response time determines the diffusion speed of a piece of content through the online social network. Here, we analyze the response time sequence for the contents propagated
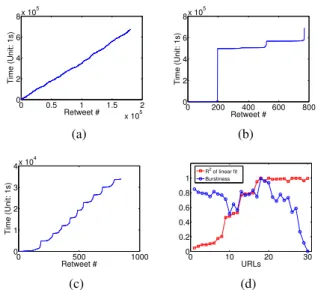
0 0.5 1 1.5 2 x 10⁵ 0 2 4 6 8x 10 5 Retweet # Time (Unit: 1s) (a) 0 200 400 600 800 0 2 4 6 8x 10 5 Retweet # Time (Unit: 1s) (b) 0 500 1000 0 1 2 3 4x 10 4 Retweet # Time (Unit: 1s) (c) 0 10 20 30 0 0.2 0.4 0.6 0.8 1 URLs R2 of linear fit Burstiness (d)
Fig. 11: (a), (b) and (c) are three typical response time patterns. (d) shows goodness of linear fit (R2) (the red square) and
burstiness of response time sequence ( the blue circle). The y-axis represents the value of goodness of fit and burstiness.
in both campaigns. The response time sequence is a series of intervals when a piece of content diffuses through the online social network. Note that response time is a feature of the content rather than a certain account.
We trace the response time sequence of a piece of content being diffused by usingfilterof Streaming API. We first cluster the retweets of the same URLs together. All tweets contain “RT@ user: ”. Tweets in each cluster have the same URL. We use URLs to represent the content.
We observe three typical response time sequences of URL diffusion, as illustrated in Fig. 11. Fig. 11a shows the linear relationship between response time and retweet number, while Fig. 11b exhibits the staircase feature, i.e., a series of bursty retweets follow a long interval. The former could be well fit by a line and has regular response intervals, while the latter could not be fit by a line but has bursty response intervals. Fig. 11c shows the third response time pattern and its shape is between the above two kinds.
We investigate the URLs in our dataset which are retweeted more than 100 times . We use two metrics corresponding to the two typical response time distributions mentioned above: goodness of fit (R2) of linear fit, and burstiness (defined in
Section V-A) of response time sequence. Fig. 11d shows the result of 30 URLs. We can see that URLs from 1st to 8th are retweeted with the response time sequence like Fig. 11b shows, and URLs from 28th to 30th are retweeted with the response time sequence like Fig. 11a shows. The remainder is retweeted with the response time sequence like Fig. 11c shows.
In addition, we would like to figure out the difference be-tween response time sequence and response time distribution. The latter neglects temporal order of the sequence. We can see that, the response time distributions of most topics are close to power-law distribution, which complies with the existing results. However, they exhibit clearly different response time sequence patterns, implying the distinct strategies in different
1 2 3 4 5 6 7 0 1 2 3 4 5 Cascade depth log(Frequency)
(a) Mention network
1 2 3 4 5 6 0 1 2 3 4 5 Cascade depth log(Frequency)
(b) Online social network
Fig. 12: Cascade depth of the mention network and online social network.
campaigns.
C. Comparison of Information Cascades in Two Networks We further compare the efficiency of information diffusion between the mention network and the online social network. The metric we consider here is the depth of information cascade. Cascade depth has been used to identify the influence of accounts and content in Twitter [10].
We inspect the cascade depth of a specific topic propagated through the mention network and the online social network. Without loss of generality, we randomly choose a hashtag “teamfollowback”. We show the cascade depths of the mention network and the online social network in Fig. 12. The cascades we inspect in the mention network are mention cascades, while the cascades we inspect in the online social network are retweet cascades. We observe that the mention network and the online social network have similar cascade depth distribution. Specifically, the cascade depth in both networks is approximately power-law, implying that the vast majority of cascades end up with being spread only few times. The largest cascade depths of the mention network and the online social network are six and seven, respectively. It indicates that mention networks play a non-negligible role in information diffusion.
VI. SPAMBENEFIT-COSTANALYSIS
Upon characterizing the diffusion network of campaigns launched in Twitter, we proceed to conducting the benefit-cost analysis of spammers who launch the campaigns. Intuitively, spammers are eager to reach as many accounts as possible within a period, however, acting aggressively may lead to being suspended by Twitter. In this section, we present a theoretical analysis on the relationship between the number of accounts that spammers reach in a campaign and the price spammers have to pay, including spam accounts that are suspended and bursty activity for reaching audience.
Note that the objective of our theoretical framework is not to predict the scale of audience a campaign could reach but to explain the ecosystem behind the campaign. Our theoretical framework is based on the measurement results and quantify the benefit and cost of spammers who launch the campaign. We will present the definition of benefit and cost for a campaign later on.
A. Modeling Dynamics of Spammers and Audience with De-terministic SIS Model
Spammers of a campaign propagate the malicious infor-mation to both their followers and accounts they actively mention. This process is similar to the spread of disease. In this respect, we call the spammers and accounts reached by them as infectious and susceptible accounts, respectively. Let
i(t)ands(t)denote the number of infectious and susceptible accounts at time t, respectively. The susceptible accounts can become infectious accounts (i.e., spammers) with transition rate β. Spammers are suspended at rate µ(i.e., the infectious accounts die at rate µ). Moreover,
• New spammers1 are continuously added to maintain the magnitude of spammers involved in the campaign. LetL(t)denote the number of new spammers added at timet.
• The infectious accounts (spammers) reach audience through online social networks and direct mentions, who thus become susceptible accounts. Let f(t) and
m(t) denote the average number of accounts that a spammer reaches at time t through online social networks and direct mentions, respectively. The rate at which new susceptible accounts are produced can be expressed asi(t)(f(t) +m(t))at timet.
• The susceptible accounts fade away after a certain period of time, which can be expressed as: D(t) = P
Sdj(t). Therein,dj(t)represents the probability of jth susceptible accounts fading away at timet andS
denotes the set of susceptible accounts.
Consequently, the differential equations describing the dy-namics of susceptible accounts (audience reached by spam-mers) and infectious accounts (spamspam-mers) based on the pro-ceeding assumptions have the following form:
ds
dt =−βs(t) +i(t)(f(t) +m(t))−D(t)
di
dt=βs(t) +L(t)−µi(t)
(2) It is worth to note that the population n (n=s+i) may not be constant. The differential equation of the population n
is given by
dn
dt =i(t)(f(t) +m(t))−D(t) +L(t)−µi(t) (3)
We first study the scenario that the population n remains constant (i.e., dndt = 0). In this respect, we can study the equilibria of the dynamics of spammers and audience whom spammers reach. Let
ds
dt = 0 =−βs(t) +i(t)(f(t) +m(t))−D(t) di
dt = 0 =βs(t) +L(t)−µi(t)
(4) There are two solutions to the equilibria; one is (s =n, i= 0), which makes no sense in this case. The other solution is
(s= 1 β
Dµ−L(f+m)
f+m−µ) , i=
D−L
f+m−µ). For simplicity, we omit the
time t in each function. We observe thati is independent on
β. It means, a spam campaign has to continuously invest new spammers in order to maintain sufficient spammers involved in the campaign and therefore keep the campaign active.
1Here a spammer means a spam account. In other word, spammer is
interchangeable with spam account in this analysis.
B. Benefit-cost Analysis
Before we delve into the benefit-cost analysis, we would introduce an important factor α, which indicates the average activity level of spammers. Besides the strategy of investing new spammers, i.e., L(t), which is mentioned above, the activity level represents the activity strategy of spammers. Moreover, the activity levelαis closely related toµ,f andm. In this respect, µ,f andm can be regarded as the functions of α, expressed asf(α, t),m(α, t)andµ(α, t).
The purpose of spammers is to reach as many accounts as possible within a specific duration. Here, we define the benefit of spammers as the population increment ratemax(dn
dt), where n represents the number of entire accounts involved in the campaign. At the same time, to achieve this purpose, spammers have to remain active in a certain level to reach audience and take the risk of being suspended by Twitter. The more active spammers are, the higher risk they take. Consequently, we define the cost of spammers as the sum of the total activity of spammers and the spammers who are suspended, i.e., αRL(t)dt+Rµ(α, t)dt.
Let E denote the ratio of benefit and cost. E can be represented as the following equation:
E = dn dt −0 αR L(t)dt+R µ(α, t)dt (5) =i(t)(f(α, t) +m(α, t))−D(t) +L(t)−µ(α, t)i(t) αR L(t)dt+R µ(α, t)dt (6) where we measure the benefit as dndt −0. Note whenα→0
(α > 0 ), we let E = 0. Since when spammers only
perform little activity with very small cost, they should obtain little benefit. By clarifying that, we can further study the characteristic of ∂E∂α. To this end, we first have to specify the function f(α, t), m(α, t) andµ(α, t). Since activity level (α) is the function of time t, we could omit t from function ∂E∂α when we consider the impact of activity level (α) onE.
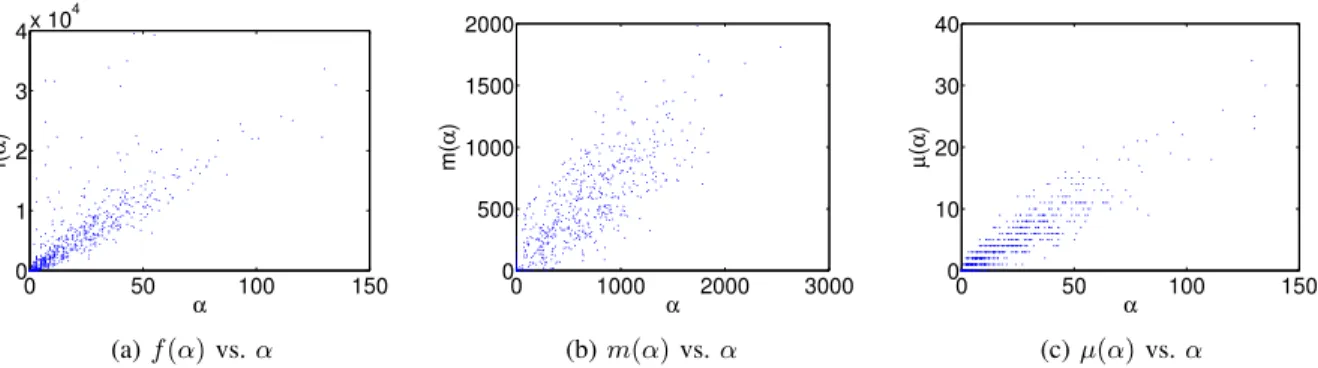
Based on the measurement results in Section V, we can obtain the detailed function forms off(α),m(α)andµ(α)for a specific topic. Fig. 13 shows a sample of f(α), m(α) and
µ(α). In the sample,f(α), m(α)andµ(α)all exhibit clearly linear relationship withα. However, it is worth noting that they may exhibit different function forms for distinct strategies that spammers employ.
However, L(t) and D(t) could not be obtained directly from the measurements. L(t) is determined by the strategies of spammers. In [2], L(t) in five campaigns are illustrated. Take an example, the strategy of a campaign may exhibit in the way that spammers are registered in bulks before the onset of the campaign and activated in a rolling fashion within the window of spam broadcasting. Meanwhile, D(t)
is well beyond subjective strategy or tactic, which represents the effective duration of susceptible accounts.
Without loss of generality, we would utilize the theoretical framework to study ∂E∂α in a specific scenario where we assume: (1) f(α) ∼ kfα, m(α) ∼ kmα, and µ(α) ∼ kµα,
(kf, km, kµ ∈ R); (2) L(t) is periodic (rolling fashion) and
hence RL(t)dt ≈ L0T /t0, where t0 is the period, T is the total length of time, and L0 denotes the number of
0 50 100 150 0 1 2 3 4x 10 4 f( α ) α (a)f(α)vs.α 0 1000 2000 3000 0 500 1000 1500 2000 m( α ) α (b)m(α)vs.α 0 50 100 150 0 10 20 30 40 µ ( α ) α (c)µ(α)vs.α
Fig. 13: A sample of functionsf(α),m(α)andµ(α).
spammers invested within a period. Through calculating the partial derivative of Eq. 6, ∂E∂α is given by
∂E ∂α = (D(t)−L(t))(αR L(t)dt+R µ(α, t)dt) (αRL(t)dt+Rµ(α, t)dt)2 . (7)
SinceαR L(t)dt+R µ(α, t)dt >0holds, ∂E∂α >0holds when
(D(t)−L(t))>0, while ∂E∂α <0holds when(D(t)−L(t))<
0. It indicates that(D(t)−L(t))determines the variation of the ratio of benefit and cost for spammers in the specific scenario above.
Recall that D(t) is the effective duration of susceptible accounts. Obviously, spammers can hardly handle this ob-jective factor. In this respect, the ratio of benefit and cost drops when the spammers invested into the campaign is more than the susceptible accounts that are no longer affected by spammers. It is also worth noting that various function forms off(α, t),m(α, t),µ(α, t)andL(t)can be taken into consideration besides the specific scenario we consider above, which guarantees the generality of this theoretical framework. C. Evaluation of benefit-cost analysis
We conclude from the benefit-cost analysis that the vari-ation of the ratio of benefit and cost is determined by
D(t)−L(t)rather than activity. To verify this, we first calculate the ratio of benefit and cost of two spam topics (“TeamFol-lowback” and “TFBJP”). According to Eq .6, we inspect the amount of audience who are reached, activity, and the number of accounts that are suspended. Nonetheless, we cannot access to the number of accounts that are suspended at time t, but only the number of suspended accounts that are still active at time t, denoted bySN(t). Since most suspended accounts only perform action once in our dataset, it is reasonable to approximate the number of suspended accounts at timetwith
SN(t). Activity measures the average activity level at time
t, which is averaged over the number of suspended accounts at time t. The ratio of benefit and cost against time for two topics is illustrated in Fig. 14. Afterwards, we investigate the relationship between activity and the ratio of benefit and cost. As Fig. 15 depicted, it is evident that there is no correlation between activity and the ratio of benefit and cost for both spam topics, which complies with the findings we derived from the benefit-cost analysis.
However, it is difficult to directly verify thatD(t)−L(t)
dominates the variation of the ratio of benefit and cost, because of no direct access toD(t)andL(t). Consequently, a feasible
0 200 400 600 −20 0 20 40 60 Time(Unit:30 min)
Ratio of benefit and cost
TeamFollowback TFBJP
Fig. 14: Ratio of benefit and cost against time.
0 2 4 6 8 −2 0 2 4 6 8 10 Activity
Ratio of benefit and cost
TeamFollowback TFBJP
Fig. 15: Ratio of benefit and cost vs. Activity. solution is to infer D(t) and L(t). Note that the number of suspended accounts that are still active at time t (SN(t)) is related to L(t)andD(t), which could be used to infer D(t)
andL(t). But the detailed inference remains as the future work. D. Limitation of Benefit-cost Analysis
First, we only discuss a specific scenario thatm(α),f(α)
and µ(α) are linearly related to α. Second, we do not study the impact of D(t) andL(t)on the variation of the ratio of benefit and cost, due to the lack of direct access to D(t)and
L(t). However, we leave the inference of D(t) and L(t) as our future work.
VII. RELATEDWORK
A. Spam Analysis
Spam detection in Twitter has attracted broad attention. Thomaset al.[2] characterized the behavior of spam accounts
and connections among them, and identified spam campaigns based on the URLs in tweets. Grier et al.[4] detected spams using URL blacklist, and found that a majority of spammers are compromised accounts. In [11], Yang et al. studied the social relationships among Twitter spammers. Egeleet al.[12] endeavored to detect compromised accounts by building users’ behavior profiles using their posting features. Benevenutoet al. [13] traversed almost all Twitter users and collected a signifi-cant number of tweets; and they manually detected spammers and identified some common features of spammers. Wang et al. [14] proposed and evaluated a set of connection-based and tweet-based features for spammer detection. In [15][16], the authors set up social honey-pots to harvest spammers, and then built spammer classifiers based on spam profiles. Song et al. [17] utilized connection information to detect spam in real-time. Gao et al. [3] proposed an online spam system which firstly clusters tweets then detects spam clusters using spammer and spam-content features. Lee et al. [18] proposed a spam detection system called Warningbird by utilizing correlated redirect chains of URLs. Xieet al.[19] focused on associating legitimate users via vouching, instead of directly detecting malicious accounts. Stringhiniet al.[5] investigated the service of buying-follower in the underground market.
B. Information Diffusion in Twitter
Meanwhile, many existing works devote to studying infor-mation propagation in Twitter. Cha et al. [20] studied users’ influence dynamics over topics and time using three influence measures. Yanget al.[21] used a regression model to measure the ability of user interation features on predicting topic propagation. They found that compared to social relationships, user interaction features work better in analyzing information diffusion. Suh et al. [22] examined what factors might affect retweetability of tweets, which determines how widely a tweet can be spread. Wu et al. [23] classified Twitter users into different groups and studied how information diffused inner-group and inter-inner-group. Wanget al.[24] proposed a recommen-dation scheme by employing mention to expand the diffusion of tweets.
VIII. CONCLUSION
To explore what scale of audience a campaign could reach through its mention network and online social network, we investigate degree, neighborhood connectivity, and burstiness of mention networks, as well as degree and response time of online social networks for two campaigns, “follow back” and “game promotion”. “Follow back” is clearly a spam campaign due to numerous unsolicited mentions, while “game promotion” is a commercial promotion campaign but resorts to spamming activity. The inspection of mention networks and online social networks helps us to reveal the tactics for a campaign to maximize the spread. Moreover, we identify suspended accounts and inspect their diffusion related features in retrospect, which sheds light on developing more advanced spammer detection algorithms.
Based on the measurements of mention networks and online social networks, we conduct a benefit-cost analysis on the spam campaign. The analysis is based on the theoretical framework developed from epidemic model. We consider a specific scenario: the number of spammers who are suspended and the number of accounts that spammers reach are linearly
related to spammers’ activity, and new spammers are invested into the campaign in a rolling fashion. In this respect, we high-light the factor that dominates the variation of ratio between benefit and cost in a campaign.
ACKNOWLEDGEMENTS
We would like to thank the anonymous reviewers for their insightful feedback. Yubao Zhang was sponsored by the China Scholarship Council. This work was partially supported by ARO grant W911NF-11-1-0149 and ONR grant N00014-13-1-0088.
REFERENCES
[1] Gao, H., Hu, J., Zhao, B. Y., Barbara, S., Barbara, U. C. S., and Chen,
Y.Detecting and Characterizing Social Spam Campaigns. IMC 2010.
[2] Thomas, K., Grier, C., Paxson, V., and Song, D. Suspended Accounts
in Retrospect : An Analysis of Twitter Spam.IMC 2011.
[3] Gao, H., Chen, Y., and Lee, K.Towards online spam filtering in social
networks.NDSS 2012.
[4] Grier, C., Thomas, K., Paxson, V., and Zhang, M. @spam: The
Underground on 140 Characters or Less.CCS 2010.
[5] Stringhini, G., Egele, M., Kruegel, C., and Vigna, G.Poultry markets:
on the underground economy of twitter followers.ACM WOSN 2012.
[6] Goh, K. I., and Barabsi, A. L. Burstiness and memory in complex
systems.Europhysics Letters, 81(4), 48002.
[7] Crane, R., and Sornette, D.Robust dynamic classes revealed by
measur-ing the response function of a social system.PNAS, 105(41), 1564953.
[8] Iribarren, J., and Moro, E.Impact of Human Activity Patterns on the
Dynamics of Information Diffusion.Physical Review Letters, 103(3),
811.
[9] T.E. Harris. Impact of Human Activity Patterns on the Dynamics of
Information Diffusion.(Springer-Verlag, Berlin, 2002)
[10] Bakshy, E., Hofman, J. M., Watts, D. J., and Mason, W. A.Identifying
Influencers on Twitter.WSDM 2011.
[11] Yang, C., Harkreader, R., and Zhang, J. Analyzing spammers social networks for fun and profit: a case study of cyber criminal ecosystem
on twitter.WWW 2012.
[12] Egele, M., Kruegel, C., and Vigna, G.COMPA : Detecting
Compro-mised Accounts on Social Networks.NDSS 2013.
[13] Benevenuto, F., and Magno, G.Detecting spammers on twitter.CEAS 2010.
[14] Wang, A.Dont follow me: Spam detection in twitter.SECRYPT 2010. [15] Lee, K., Eoff, B., and Caverlee, J. Seven months with the devils: A
long-term study of content polluters on twitter.ICWSM 2011.
[16] Lee, K., Caverlee, J., and Webb, S.Uncovering social spammers: social
honeypots+ machine learning.SIGIR 2010.
[17] Song, J., Lee, S., and Kim, J. Spam filtering in twitter using
sender-receiver relationship.Recent Advances in Intrusion Detection 2011.
[18] Lee, S., and Kim, J. WARNINGBIRD: Detecting Suspicious URLs in
Twitter Stream.NDSS 2012.
[19] Xie, Y., Yu, F., Ke, Q., and Abadi, M.Innocent by association: early
recognition of legitimate users.CCS 2012.
[20] Cha, M., and Haddadi, H. Measuring user influence in twitter: The
million follower fallacy.ICWSM 2010.
[21] Yang, J., and Counts, S.Predicting the Speed , Scale , and Range of
Information Diffusion in Twitter.ICWSM 2010.
[22] Suh, B., Hong, L., Pirolli, P., and Chi, E. H.Want to be Retweeted? Large Scale Analytics on Factors Impacting Retweet in Twitter Network.
2010 IEEE Second International Conference on Social Computing. [23] Wu, S., Hofman, J. M., Mason, W. A., and Watts, D. J.Who says what
to whom on twitter.WWW 2011.
[24] Wang, B., Wang, C., Bu, J., Chen, C., Zhang, W. V., Cai, D., and He, X. Whom to Mention: Expand the Diffusion of Tweets by @