EUROPEAN
COMMISSION
Brussels, 26.2.2015
SWD(2015) 38 final
COMMISSION STAFF WORKING DOCUMENT
Country Report Netherlands 2015
Including an In-Depth Review on the prevention and correction of macroeconomic
imbalances
{COM(2015) 85 final}
This document is a European Commission staff working document . It does not
constitute the official position of the Commission, nor does it prejudge any such position.
3
Executive summary 1
1. Scene setter: economic situation and outlook 3
2. Imbalances, Risks and Adjustment 9
2.1. Current Account 10
2.2. Saving and Investment 15
2.3. Household Debt and Housing Market Developments 24
3. Other structural issues 32
3.1. Fiscal-Structural Issues and Taxation 33
3.2. Labour Market and Social Policies 36
3.3. Education 42
3.4. Structural Measures 43
AA. Overview Table 45
AB. Standard Tables 50
LIST OF TABLES
1.1. Key economic, financial and social indicators - Netherlands 7
1.2. MIP Scoreboard Indicators 8
2.1.1. Main trade partners: breakdown of trade volumes in services (2013) 12 2.2.1. Net lending by non-financial corporations in 2013 (as a percentage of
GDP) 19
AB.1. Macroeconomic indicators 47
AB.2. Financial Market indicators 48
AB.3. Taxation indicators 48
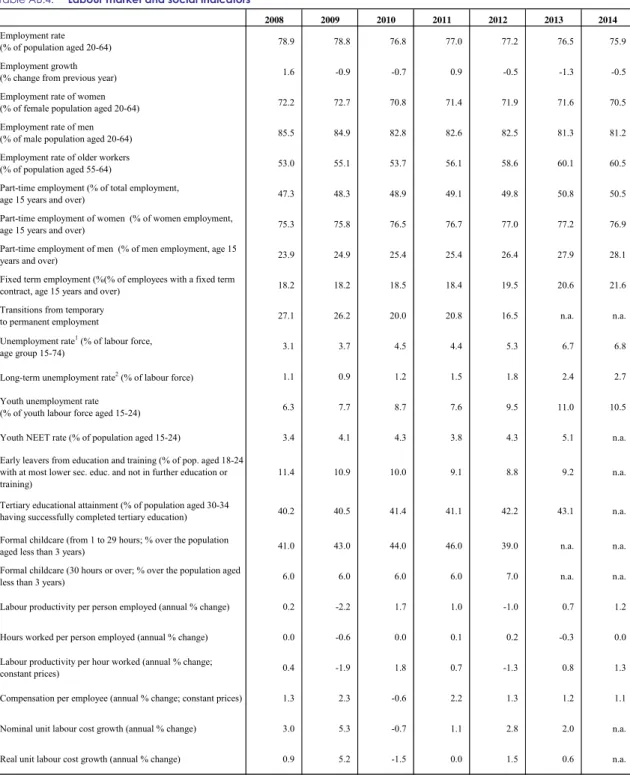
AB.4. Labour market and social indicators 49
AB.5. Expenditure on social protection benefits (% of GDP) 50
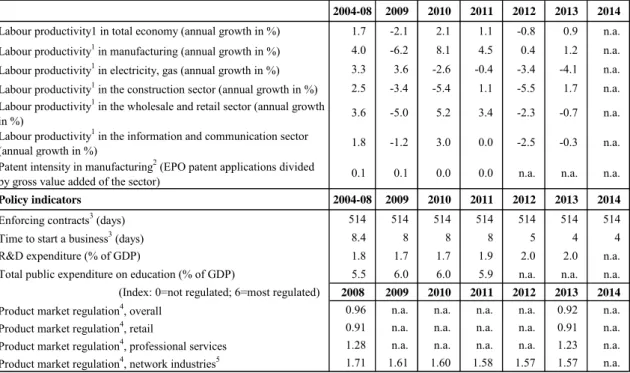
AB.6. Product market performance and policy indicators 51
LIST OF GRAPHS
1.1. Real GDP growth and contributions 3
1.2. Labour market developments 4
1.3. Productivity gap with the US: NL, DE and EA-12 5
2.1.1. Breakdown of external position (current and capital accounts) 10
2.1.2. Share of re-exports by economic category 11
2.1.3. Net services (exports-imports, in EUR billion (LHS) and as a % of GDP
(RHS), 2013) 12
2.1.4. Breakdown of the primary income balance (% of GDP) 13
2.1.5. Investment income expenditure without SFIs 13
2.1.6. Investment income receipts without SFIs 14
2.2.1. Net Lending/ Borrowing by Sector 15
2.2.2. Saving per sector (% of GDP) 15
2.2.3. Investment per sector in (% of GDP) 15
2.2.5. Annual household income 16
2.2.6. Gross saving ratio (% of disposable income) 16
2.2.7. Gross saving (in % of GDP) 16
2.2.8. Liquid assets and debt service to income 17
2.2.10. Investment by type 18
2.2.11. Savings and domestic investment of non-financial corporations
(in % of GDP) 19
2.2.12. Domestic savings and investment of non-financial corporations 20 2.2.13. Net FDI outflow and net foreign saving of non-financial
corporations 20
2.2.14. Gross Fixed Capital Formation - Total Economy, current prices 23
2.3.1. Breakdown of y-o-y changes in debt-to-GDP ratios, households 24
2.3.2. Loan-to-value ratios of homeowners 24
2.3.3. Negative equity by age, 2014 25
2.3.4. Loan-to-value ratios of homeowners 25
2.3.5. Mortgages under water per iIncome quartile 25
2.3.6. Average LTV per income quartile 26
2.3.7. Mortgage risk by age group 26
2.3.8. Non-performing loans 26
2.3.9. Return on assets and equity of banks 27
2.3.10. Evolution of house prices (lhs, 2010 = 100) and number of
transactions 27
2.3.11. Residential building permits, price peak and trough 27
3.2.1. Labour market indicators 35
3.2.2. Permanent, temporary and self-employed workers as a share of total
employment 37
LIST OF BOXES
1.1 Economic Surveillance Process 6
2.2.2. Balance Sheets of Non-Financial Corporations 21
2.3.1. Social Housing 28
2.3.2. Long-Term Scenarios on Private Sector Debt 29
EXECUTIVE SUMMARY
The Netherlands is experiencing a gradual economic recovery mainly driven by domestic demand. Following the contraction in real GDP in
2012 and 2013, the Dutch economy returned to positive economic growth in 2014. Economic growth is expected to accelerate to 1.4 percent in 2015 and 1.7 percent in 2016. The economic recovery is increasingly being driven by domestic demand, based on real wage growth and better labour market conditions. Consumer confidence and households' investment are also supported by the nascent recovery in the housing market. The Dutch labour market showed a moderate revival in 2014, which is expected to continue in the coming years. Inflation is expected to remain muted, supporting real wage growth in the short term but limiting deleveraging. Government finances are expected to improve in 2015 and 2016.
This Country Report assesses the Netherlands' economy against the background of the Commission's Annual Growth Survey which recommends three main pillars for the EU's economic and social policy in 2015: investment, structural reforms, and fiscal responsibility. In line with the Investment Plan for Europe, it also explores ways to maximise the impact of public resources and unlock private investment. Finally, it assesses the Netherlands in the light of the findings of the 2015 Alert Mechanism Report, in which the Commission found it useful to further examine the persistence of imbalances or their unwinding. The main findings of the In-Depth Review contained in this Country Report are:
The Netherlands’ current account has been constantly in surplus for over three decades.
The current account surplus is traceable to fundamental features of the Dutch economy, such as energy exports, goods re-exports and the international capital flows of multinationals. The surplus also reflects the ongoing and necessary deleveraging of households and the (still weak) cyclical position of the economy. Overall, underlying mismatches between savings and investment appear to be smaller than the headline figures suggest.
Investment activity in the Netherlands declined as a percentage of GDP since the turn of century, partly as a consequence of lower prices of investment goods (in particular of information and communication technology
equipment) and, in particular since 2008, as a consequence of lower investment in construction and real estate. Public investment
and private investment in productive equipment were relatively stable. For strengthening the economic growth of the Netherlands in the medium run, the declining public R&D-intensity and better use of the excellent knowledge base of the country warrant attention.
The pension and tax systems give households strong obligations and incentives to invest in housing and save in pension schemes, leading to potentially inefficient allocation of capital.
People have the incentive to buy a dwelling early in their life by incurring high levels of mortgage debt. The obligation to save high amounts in the pension system early in the life cycle also reduces the financial room for manoeuvre of young people. Pension funds are somewhat risk-averse, which could lead to a suboptimal allocation of their investments. The statutory retirement age has been increased (and linked to life expectancy) but the distribution of costs and risks has not changed in the (funded) occupational pillar.
This has an impact on the accumulation of savings and the allocation of capital in the pension system, possibly reducing the long-term growth prospects of the Dutch economy.
Driven by tax incentives, high household debt levels have built up over decades and are expected to decline slowly in the coming decades. Long-standing tax incentives and
financial innovations have encouraged households to become highly indebted by taking up mortgages. Newly introduced policy and supervisory measures are curbing mortgage growth. Risks from the high level of household debt to the financial sector are contained by, for example, the high net asset position of households, prudent loan-to-income ratios and the recovering housing market.
The functioning of the housing market is still distorted by the substantial mortgage interest deductibility and a rental market that is not functioning properly. Mortgage interest
deductibility is partially and very gradually being phased out but a substantial part of the subsidy will remain. Mortgage interest deductibility still gives households the incentive to invest in relatively unproductive assets. The emergence of a properly functioning rental market is constrained by a social
Executive summary
2 housing segment still facing allocation
inefficiencies.
The Country Report also analyses macroeconomic issues and the main findings are:
The labour market is holding up well and poverty remains low. The Dutch labour market is
in relatively good shape and unemployment is decreasing. Some groups of people at the margin of the labour market face difficulties to enter the labour market. Poverty has only increased marginally since 2008 and remains low.
Some forms of growth-friendly expenditure are under pressure. Whereas the education system
delivers good results and public expenditure for education remains high, public support for research and innovation is set to decline over the coming years.
Overall, the Netherlands has made some progress in addressing the country-specific recommendations issued by the Council in 2014.
The Netherlands has made some progress in protecting expenditure directly relevant to growth but has only made limited progress in further reforming the housing market. In particular, the partial phasing-out of the mortgage interest deductibility has not been stepped up despite the opportunity created by a recovery in the housing market and an improving economic environment. Some or even substantial progress has been made regarding the recommendations concerning the pension system, long-term care and the labour market.
The Country Report reveals the policy challenges stemming from the analysis of macro-economic imbalances:
The Netherlands has to find the right balance between the necessary deleveraging, in particular of households, and giving sufficient support to domestic demand to sustain the economy recovery. As long as households
increase their savings to deleverage, the current account surplus will remain high and above the level justified by fundamentals.
Raising the growth potential will depend on attracting sufficient labour and facilitating the most efficient allocation of capital. Greater
labour utilisation is needed to soften the effects of demographic changes. Reforms have been implemented to make work financially more attractive but disincentives to work from taxes and social security contributions remain high. The role of pension-regulation and the tax system in the allocation of capital will be increasingly important in fostering economic growth.
With an ageing society, the Netherlands faces the challenge of maintaining its level of welfare in the future. With an ageing population economy
growth depends ever more on improvements in the efficiency and the resilience of the economy. In particular, a regulatory framework that supports growth and investing in research, innovation and education plays a key role.
1.
SCENE SETTER: ECONOMIC SITUATION AND OUTLOOK
The macroeconomic situation anddevelopments
The Netherlands is experiencing a gradual economic recovery. Following the contraction in
real GDP in 2012 and 2013, the Dutch economy returned to growth of an estimated +0.7% in 2014 (Graph 1.1). The economic recovery is increasingly driven by domestic demand, based on real wage growth and better labour market conditions. The housing market is improving as well, with an increase in transactions in the final quarters of 2014. This is likely to give a further boost to economic sentiment and may result in an increase in housing investment. Recent monthly data and soft indicators suggest that the pickup in investment in the second half of 2014 is set to continue, supporting a gradual domestic demand-led recovery. The Commission winter forecast projects growth of 1.4% in 2015 and 1.7% in 2016. Graph 1.1: Real GDP growth and contributions
-4 -3 -2 -1 0 1 2 3 4 -4 -3 -2 -1 0 1 2 3 4 07 08 09 10 11 12 13 14 15 16 % o f po te nt ia l G D P pps. Output gap (rhs) Inventories Net exports
Domestic demand, exclusive inventories Real GDP (y-o-y%)
forecast
Source: European Commission (AMECO)
The on-going deleveraging by households is likely to put a limit on the speed of economic recovery. As a legacy of the credit-led housing
boom that started in the 1990s, Dutch households remain highly indebted. Large liabilities, in particular mortgage debt, go alongside large illiquid assets in the form of housing wealth and pension wealth. The ratio of total debt to disposable income stood at 250% in 2012, one of
the highest in the euro area.(1) Servicing this debt and paying high health and second pillar pension contributions reduce the capacity of households to accumulate liquid assets. For this reason, although real household disposable income is expected to increase in the coming years, deleveraging pressures are expected to restrain a fast recovery in consumption, as additional household income is likely to be used for paying down debt. The household saving rate is expected to increase to 16.4 percent of disposable income in 2016, about two percentage points higher than the long term average of 14.4 per cent.(2)
The moderate revival of the Dutch labour market in 2014 is expected to continue. Well
after the start of the financial crisis, the Dutch labour market performed relatively well (Graph 1.2). In the period 2009-12, the Netherlands had one of the lowest rates of unemployment in the EU, as employers engaged in labour hoarding on a large scale. After 2012, however, the unemployment rate increased significantly, peaking at 7.3 percent of the labour force in February 2014. Over the course of 2014, the number of new vacancies increased and employment growth picked up. In December 2014, the unemployment rate stood at 6.7%, more than 0.5 percentage points lower than at the beginning of the year. These trends are expected to continue, in line with the broader recovery of the Dutch economy. Employment growth (in full-time equivalent) is expected to increase by about ½pp in the coming years and the unemployment rate is estimated to decline gradually to 6.6% in 2015 and 6.4% in 2016, respectively.
(1) Source: Eurostat, gross debt-to-income ratio of households is defined as loans and liabilities divided by gross disposable income with the latter being adjusted for the change in the net equity of households in pension funds reserves.
(2) The long term average saving rate of households is calculated over the period 1995-2013. For a quantitative analysis of deleveraging pressures, see Cuerpo et al (2013). 'Indebtedness, Deleveraging Dynamics and
Macroeconomic Adjustment' European Economy.
1. Scene setter: economic situation and outlook
4 Graph 1.2: Labour market developments
4 5 6 7 8 7800 8000 8200 8400 8600 8800 9000 9200 10 11 12 13 14 15 16 % 000 s of per so ns
Labour force (lhs) Employment (lhs) Unemployment rate (rhs)
forecast (annual average)
Source: European Commission (Eurostat and Ameco)
Inflationary pressures are expected to remain muted. Harmonized Index of Consumer Prices
(HICP) inflation is forecast at 0.4 % in 2015 and rising to 0.7% in 2016. In particular, energy prices provide a negative contribution to the overall index in 2015. Positive price pressure is expected to come from the services sector. With the unemployment rate standing well above pre-crisis levels and utilisation rates in the industry only at around 80%, the excess capacity in the economy is likely to prevent inflation from picking up again in the coming years.
The current account surplus is expected to remain elevated. The current account surplus of
the Netherlands is for a substantial part driven by structural features of the economy, such as the main-port function, re-exports and exports of natural gas. Part of the current account surplus can also be explained by the still weak cyclical position of the economy. As previous analysis has shown, wage moderation was not a decisive factor driving the trade surplus.(3) Falling import prices and the deleveraging of households will not support a quick adjustment in the current account. However, in the medium term the current account
(3) For a further analysis, see the in-depth review of the Netherlands (2014). Since the turn of the century, real unit labour costs rose by around 3 % in the Netherlands, which is comparable with the increase in France and Belgium, but markedly above Germany where real unit labour costs declined in the same period (2000-2013).
surplus will decline as domestic demand recovers and deleveraging pressures ease.
The headline deficit of the government is set to decline further. For 2014, the general government
deficit is estimated to have reached 2.8 % of GDP. In 2015 and 2016, it is expected to improve to 2.2 % and 1.8% of GDP, respectively. In 2015, the most important policy measures affecting the budget are the reduction of the maximum accrual rate of pensions (via its positive effect on tax revenues) and savings from the decentralisation of long term-care. For 2016, the forecast takes into account the measures detailed in the multi-annual
budget agreement (‘Regeerakkoord’) and
subsequent policy packages. The improvement in the budget balance also stems from the recovery of domestic demand, which should lead to a more tax-rich growth. The structural deficit is estimated at 0.7% of GDP in 2014, and is expected to deteriorate slightly in both 2015 and 2016. The gross government debt ratio is forecast to increase slightly and remain at 70.5 % of GDP in both 2015 and 2016.
Productivity and labour utilisation
Productivity has been declining, possibly also on account of declining domestic investment activity on the part of non-financial corporations. A world-class educational system,
improvements in human capital, and public and private investment in innovation are fundamental ingredients for future productivity growth. Productivity in the Netherlands used to be higher than in many other European countries and comparable to the US level. However, since 2008, the country has gradually lost this advantage (Graph 1.3). This might be related to under-investment in Europe.(4) While a gradual recovery of economic growth and higher investment activity may yield higher productivity growth in the coming years, it is unlikely that a recovery in the economic cycle will close the gap with the US.
(4) See Gorning and Schiersch (2014). 'Weak Investment in the EU: A Long-Term Cross-Sectoral Phenomenon' DIW Economic Bulletin 7 for a decomposition of investment intensities over de period 1999-2007.
1. Scene setter: economic situation and outlook
Graph 1.3: Produ ctivity gap with the US: NL, DE and EA-12 60 65 70 75 80 85 90 95 100 105 110 95 96 97 98 99 00 01 02 03 04 05 06 07 08 09 10 11 12 13 in dex ( U S=100 )
Euro area (12 countries) Germany
Netherlands
Source: European Commission (AMECO; GDP per hour worked, PPS)
Labour utilisation is low in terms of hours worked both at the extensive and at the intensive margins Although overall participation
rates in the Netherlands are high, still one out of four persons in the active age-group does not participate. Moreover, the annual average of hours worked per worker is among the lowest in the EU. This is largely the result of the higher incidence of part-time working arrangements, particularly among women. Due to the current incentive structure, increased labour participation often only gives rise to a limited increase in disposable income as the marginal tax and non-tax burden on labour income is high.
Developments in the housing market
Mortgage interest deductibility remains substantial and the rental market is not functioning properly. Although measures have
been taken in recent years to partially phase out mortgage interest deductibility, a substantial part of the subsidy will still remain. Mortgage interest deductibility continues to encourage to take on large mortgages and to drive domestic savings and investment towards relatively unproductive (real estate) assets. Because of the different tax treatment of owner-occupied and rental housing supply of rental properties remains low and rental fees high.
The private rental market is still not functioning fully and there are still inefficiencies concerning the allocation of social housing to dwellers in need. The rental market is
dominated by a large social housing segment which in effect crowds out the private rental market. Even though a third of all dwellings are owned by social housing corporations, long waiting lists still exist due to allocation inefficiencies. Labour mobility is restrained by the way social housing is allocated. This negatively impacts employment prospects, especially of the lower-skilled.
The Dutch economy in perspective
The growth outlook of the Netherlands is dependent on policies to mitigate the impact of deleveraging on consumption and growth. In
order to lower the saving rate and boost the consumption of the active population, the Netherlands have reduced tax allowance for pension contributions. In addition, to support deleveraging the government in 2014 temporarily exempted gifts from tax when used by the beneficiary for a home (acquisition, renovation, or mortgage reduction). In recent years the government has also taken measures to prevent unsustainable growth of mortgage loans, notably through a partial and gradual limitation of mortgage interest deductibility, a gradual lowering of maximum loan-to-value ratios and an (implicit) obligation to amortise mortgage debt. However, total mortgage debt will only decline slowly. About one third of all homeowners will continue to have negative net housing equity and thus may be discouraged from engaging in housing market transactions.
In the context of an ageing population and declining productivity growth trends, the Netherlands faces a risk of a long-term decline in its potential rate of economic growth. On
account of its high degree of openness, and its position as important gate-way to Europe and headquarters to a number of multinational enterprises, much of the income of the Netherlands is generated abroad. However, the Dutch welfare system, with high pensions and high quality healthcare, depends to a large extent on the domestic economy's capacity to generate income, to reverse the recent declining trend in productivity and to increase labour utilisation.
1. Scene setter: economic situation and outlook
6
Systemic incentives may not be fostering an efficient allocation of resources for long-term growth. The Dutch institutional setup affects
significantly the households' savings and investments decisions over their entire lifespan. Ageing population, falling long-term interest rates and health care expenditure increases have driven up the non-tax burden on labour such as pension contributions and healthcare premiums. Together with labour taxes, these compulsory non-tax payments significantly reduce disposable income of households, in particular in their active years.() Through the pension and health care sector, income is being transferred within and across generations. Moreover, the tax system creates incentives to households to invest in low-productive capital goods such as real estate that cannot to be used to foster long run growth. Finally, although pension funds have been successful in managing their members' assets, the regulatory framework could lead to a suboptimal allocation of resources both from the perspective of households and, more generally, from a macroeconomic perspective.
Box 1.1: Economic surveillance process
The Commission’s Annual Growth Survey, adopted in November 2014, started the 2015 European Semester, proposing that the EU pursue an integrated approach to economic policy built around three main pillars: boosting investment, accelerating structural reforms and pursuing responsible growth-friendly fiscal consolidation. The Annual Growth Survey also presented the process of streamlining the European Semester to increase the effectiveness of economic policy coordination at the EU level through greater accountability and by encouraging greater ownership by all actors. In line with streamlining efforts this Country Report includes an In-Depth Review — as per Article 5 of Regulation no. 1176/2011 — to determine whether macroeconomic imbalances still exist, as announced in the Commission’s Alert Mechanism Report published on November 2014. Based on the 2014 IDR for the Netherlands published in March 2014, the Commission concluded that the Netherlands was experiencing macroeconomic imbalances requiring monitoring and policy action, in particular regarding developments in the areas of household debt and the current account surplus. This Country Report includes an assessment of progress towards the implementation of the 2014 Country-Specific Recommendations adopted by the Council in July 2014. The Country-Specific Recommendations for the Netherlands concerned public finances, the housing market, the pension system and the labour market.
1. Scene setter: economic situation and outlook
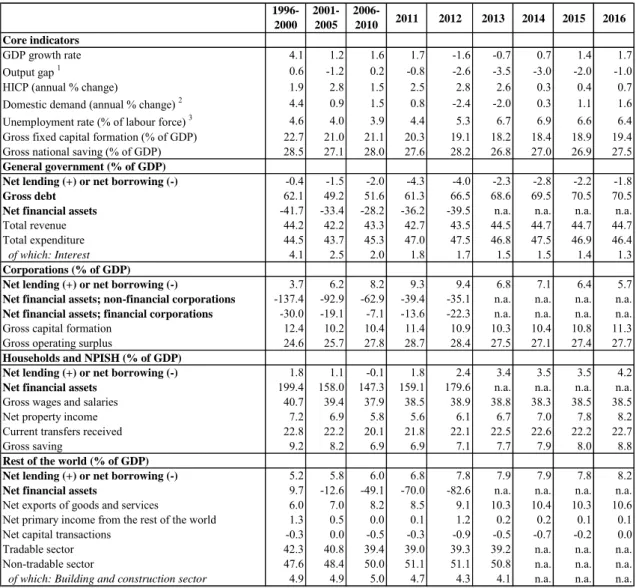
8 Table 1.1: Key economic, financial and social indicators - Netherlands
2008 2009 2010 2011 2012 2013 2014 2015 2016
Real GDP (y-o-y) 2.1 -3.3 1.1 1.7 -1.6 -0.7 0.7 1.4 1.7
Private consumption (y-o-y) 1.0 -1.8 -0.1 0.2 -1.4 -1.6 -0.1 1.2 1.6
Public consumption (y-o-y) 4.1 4.0 1.1 -0.2 -1.6 -0.3 0.0 -0.2 0.0
Gross fixed capital formation (y-o-y) 4.8 -9.2 -5.6 5.6 -6.0 -4.0 1.7 3.0 4.0
Exports of goods and services (y-o-y) 1.5 -8.0 8.9 4.4 3.3 2.0 4.1 4.4 4.8
Imports of goods and services (y-o-y) 1.8 -7.5 8.3 3.5 2.8 0.8 4.1 4.5 5.1
Output gap 2.5 -2.1 -1.7 -0.8 -2.6 -3.5 -3.0 -2.0 -1.0
Contribution to GDP growth:
Domestic demand (y-o-y) 2.4 -1.9 -0.9 1.1 -2.3 -1.5 0.3 1.0 1.5
Inventories (y-o-y) -0.3 -0.4 1.0 -0.4 0.1 -0.3 0.0 0.0 0.0
Net exports (y-o-y) -0.1 -1.0 1.0 0.9 0.6 1.1 0.4 0.4 0.2
Current account balance (% of GDP), balance of payments 4.0 5.5 7.5 8.8 10.1 10.3 . . .
Trade balance (% of GDP), balance of payments 8.3 7.5 8.4 8.5 9.1 10.3 . . .
Terms of trade of goods and services (y-o-y) -0.1 0.7 -0.6 -1.5 -0.4 0.4 0.0 -0.3 0.3
Net international investment position (% of GDP) -7.8 0.8 9.2 17.4 25.7 31.2 . . .
Net external debt (% of GDP) 29.2* 24.4* 37.2* 38.4* 32.9* 20.4* . . .
Gross external debt (% of GDP) 471.7 480.46 500.33 515.2 525.8 500.4 . . .
Export performance vs advanced countries (% change over 5 years) 2.4* 2.4* -0.1* 0.0* -3.0* -3.1 . . .
Export market share, goods and services (%) 3.4 3.5 3.2 3.1 3.0 3.1 . . .
Savings rate of households (net saving as percentage of net disposable
income) 5.4 8.7 5.1 6.0 6.5 7.8 . . .
Private credit flow, consolidated, (% of GDP) 9.7 8.5 2.8 3.5 1.8 2.2 . . .
Private sector debt, consolidated (% of GDP) 217.2 231.3 229.4 228.0 230.3 229.8 . . .
Deflated house price index (y-o-y) 1.0 -3.9 -3.2 -4.3 -8.8 -8.0 . . .
Residential investment (% of GDP) 6.1 5.5 4.7 4.2 3.7 3.3 3.3 . .
Total financial sector liabilities, non-consolidated (y-o-y) 2.4 4.5 7.1 8.7 1.3 -2.1 . . .
Tier 1 ratio1 . . . . . . . . .
Overall solvency ratio2 . . . . . . . . .
Gross total doubtful and non-performing loans (% of total debt
instruments and total loans and advances)2 . . . .
Change in employment (number of people, y-o-y) 1.4 -0.8 -0.7 0.8 -0.5 -1.3 -0.6 0.5 0.6
Unemployment rate 3.1 3.7 4.5 4.4 5.3 6.7 6.9 6.6 6.4
Long-term unemployment rate (% of active population) 1.1 0.9 1.2 1.5 1.8 2.4 . . .
Youth unemployment rate (% of active population in the same age group) 6.3 7.7 8.7 7.6 9.5 11.0 10.5 . .
Activity rate (15-64 year-olds) 79.3 79.7 78.2 78.4 79.3 79.7 . . .
Young people not in employment, education or training (%) 3.4 4.1 4.3 3.8 4.3 5.1 . . .
People at risk of poverty or social exclusion (% of total population) 14.9 15.1 15.1 15.7 15.0 15.9 . . .
At-risk-of-poverty rate (% of total population) 10.5 11.1 10.3 11.0 10.1 10.4 . . .
Severe material deprivation rate (% of total population) 1.5 1.4 2.2 2.5 2.3 2.5 . . .
Number of people living in households with very low work-intensity (%
of total population aged below 60) 8.2 8.5 8.4 8.9 8.9 9.3 . . .
GDP deflator (y-o-y) 2.3 0.5 1.2 0.1 1.3 1.1 0.5 0.5 1.3
Harmonised index of consumer prices (HICP) (y-o-y) 2.2 1.0 0.9 2.5 2.8 2.6 0.3 0.4 0.7
Nominal compensation per employee (y-o-y) 3.7 2.8 0.6 2.4 2.6 2.3 1.6 0.8 2.1
Labour productivity (real, person employed, y-o-y) 0.4 -2.5 1.8 0.8 -1.1 0.6 1.0 . .
Unit labour costs (ULC) (whole economy, y-o-y) 3.4 5.1 -1.1 1.3 3.6 1.6 0.4 0.0 1.1
Real unit labour costs (y-o-y) 1.1 4.6 -2.2 1.2 2.3 0.5 -0.1 -0.6 -0.1
REER3) (ULC, y-o-y) 1.8 2.4 -3.1 0.7 -0.4 2.1 -0.5 -2.7 0.3
REER3) (HICP, y-o-y) -1.3 1.0 -4.0 -0.6 -1.3 2.4 0.7 -1.1 -1.1
General government balance (% of GDP) 0.2 -5.5 -5.0 -4.3 -4.0 -2.3 -2.8 -2.2 -1.8
Structural budget balance (% of GDP) . . -3.8 -3.8 -2.3 -0.6 -0.7 -0.9 -1.1
General government gross debt (% of GDP) 54.8 56.5 59.0 61.3 66.5 68.6 69.5 70.5 70.5
Forecast
1. Scene setter: economic situation and outlook
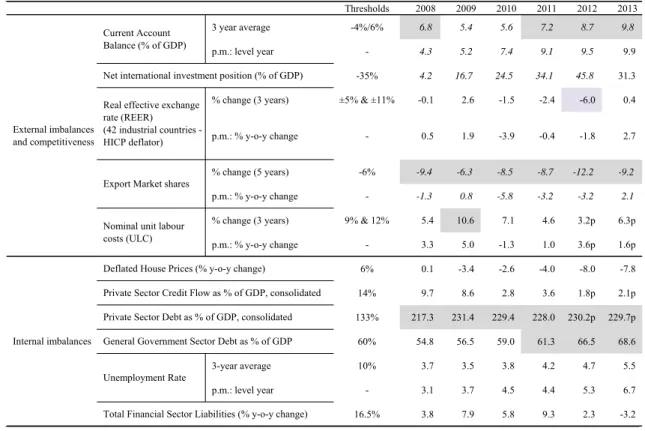
Table 1.2: MIP Scoreboard Indicators
Thresholds 2008 2009 2010 2011 2012 2013
3 year average -4%/6% 6.8 5.4 5.6 7.2 8.7 9.8
p.m.: level year - 4.3 5.2 7.4 9.1 9.5 9.9
-35% 4.2 16.7 24.5 34.1 45.8 31.3
% change (3 years) ±5% & ±11% -0.1 2.6 -1.5 -2.4 -6.0 0.4
p.m.: % y-o-y change - 0.5 1.9 -3.9 -0.4 -1.8 2.7
% change (5 years) -6% -9.4 -6.3 -8.5 -8.7 -12.2 -9.2
p.m.: % y-o-y change - -1.3 0.8 -5.8 -3.2 -3.2 2.1
% change (3 years) 9% & 12% 5.4 10.6 7.1 4.6 3.2p 6.3p
p.m.: % y-o-y change - 3.3 5.0 -1.3 1.0 3.6p 1.6p 6% 0.1 -3.4 -2.6 -4.0 -8.0 -7.8 14% 9.7 8.6 2.8 3.6 1.8p 2.1p 133% 217.3 231.4 229.4 228.0 230.2p 229.7p 60% 54.8 56.5 59.0 61.3 66.5 68.6 3-year average 10% 3.7 3.5 3.8 4.2 4.7 5.5 p.m.: level year - 3.1 3.7 4.5 4.4 5.3 6.7 16.5% 3.8 7.9 5.8 9.3 2.3 -3.2 External imbalances and competitiveness Current Account Balance (% of GDP)
Net international investment position (% of GDP)
Real effective exchange rate (REER) (42 industrial countries - HICP deflator)
Export Market shares
Nominal unit labour costs (ULC)
Internal imbalances
Deflated House Prices (% y-o-y change)
Private Sector Credit Flow as % of GDP, consolidated
Private Sector Debt as % of GDP, consolidated General Government Sector Debt as % of GDP
Unemployment Rate
Total Financial Sector Liabilities (% y-o-y change)
2.1. CURRENT ACCOUNT
The Netherlands has been recording persistent current account surpluses for over three decades. A current account surplus indicates that
resources produced (or income received) in the country exceed the resources used (for consumption or fixed investment) in that same country (Graph 2.1.1). According to the MIP (Macroeconomic Imbalance Procedure) scoreboard headline indicators, the three-year average of current account balances from 2011 to 2013 was 9.8 % for the Netherlands. This section looks at the evolution of the current account surplus and its components.
Graph 2.1.1: Breakdown of external position (current and capital accounts) -6 -4 -2 0 2 4 6 8 10 12 14 16 97 98 99 00 01 02 03 04 05 06 07 08 09 10 11 12 13 14* % o f G D P
Capital account (KA) Current transfers Income balance Trade balance - services Trade balance - goods Trade balance
Current account balance (CA) Net lending/borrowing (CA+KA)
Source: European Commission (Eurostat)
The Netherlands is producing substantially below full capacity, putting upward pressure on the current account surplus. The Netherlands is
cyclically in a worse economic situation than its main trading partners. This implies that imports are smaller and the current account surplus is larger than in a situation where the Netherlands and its trading partners were producing at full capacity. This effect is estimated to account for 1.7 percentage points of the current account surplus of around 10 % of GDP observed in 2013.
Structural factors contribute importantly to the Dutch current account surplus. Re-exports of
foreign-produced goods and natural gas production have an impact on the trade in goods, while the behaviour of multinational companies and the investment decisions of the funded pension system
influence the income accounts. Given the intrinsic nature of these economic features, the current account surplus can largely be regarded as structural. As previous analysis of standard indicators has shown, the price and costs competitiveness of the Netherlands have neither improved nor deteriorated significantly in the recent past. (5) Consequently, wage moderation does not seem to play a major role in generating the trade surplus. Despite sizeable current account surpluses over the last years, the net international investment position of the Netherlands only amounted to 31.1 % of GDP in 2013, indicating that the flow of surpluses does not fully translate into a build-up of liabilities in other countries. Trading goods is a major strength of the Dutch economy(6)
Underlying the high current account surplus are large gross trade flows in goods and services, making the Netherlands one of the most open economies in the EU. The
continuously positive trade balance is strongly influenced by the geographical position of the Netherlands that is exploited through a large harbour(7) and high-quality infrastructure and the production and export of natural gas.
The Netherlands' most important trading partners are Germany, Belgium and the United Kingdom, with China gaining a substantial market share in the more recent past. While
Germany and Belgium have been major import and export markets for a long time, imports from emerging markets have increased recently, especially from China. Machines and transport equipment constitute the bulk of Chinese imports. Exports to China have also been growing substantially; but, overall, the Netherlands has a large trade deficit with China as many goods that
(5) In depth review for the Netherlands (2014)
(6) In the following section, current account data are reported according to BPM5 standards (the 5th edition of the IMF's Balance of Payments Manual). In 2014, Statistics Netherlands switched to new BPM6 reporting standard for international trade statistics, which caused several breaks in time series, especially for trade in services. For consistency reasons and in order to include longer time series, this section includes data according to BPM5.
(7) According to the American Association of Port Authorities, Rotterdam harbour was the 4th busiest port in total cargo volume and the 11th busiest harbour in container traffic in 2012.
2.1. Current Account
12 are imported from China are re-exported to other
EU Member States. Trade with Russia is very different. Over 90 % of all imports from Russia are crude oil and related products, so imports from Russia are not as diversified as Chinese imports. Less than 2 % of all exports go to Russia, of which only a small fraction is currently subject to sanctions. EU Member States which acceded in 2004 have an import share of 4.5 % and the combined import share of southern euro area countries (Spain, Italy, Portugal and Greece) is also around 4.5 % (8). Due to the low trading volumes vis-à-vis the southern Member States, potential spillover effects from the Dutch economy to those countries are limited; this means that an increase in Dutch consumption would not necessarily translate into higher demand for goods from the southern countries.(9)
The positive trade balance in goods is partly explained by the contribution of re-exports.
Statistics Netherlands (CBS) defines re-exports as 'Goods transported via the Netherlands, which are temporarily owned by a resident of the Netherlands, without any significant industrial processing.' In practice, this means that goods are
counted as re-exports if the six-digit code that customs assigns to goods every time they enter or leave the country does not change. The share of re-exports in total re-exports increased from 42.2 % in 2002 to 46.1 % in 2013. Regarding machinery and transport equipment, re-exports have been high since the early 2000s, representing 60-70 % of total machinery exports. The four sectors presented in Graph 2.1.2 account for 75 % of total exports in 2013.
(8) Reference period: January-August 2014. Source: Statistics Netherlands.
(9) The size of the Dutch economy allows for only moderate outward spillovers for most other Member States via the trade channel. In particular spillovers to southern countries are marginal. The high degree of economic and financial openness of the economy exposes the Netherlands to potentially significant inward spillovers from the USA and from neighbouring Member States (Belgium and Germany) along the trade, financial and banking channels.
Graph 2.1.2: Share of re-exports by economic category
0 10 20 30 40 50 60 70 02 03 04 05 06 07 08 09 10 11 12 13 % Total
Food and live anminals
Mineral fuels, lubricants and related material Chemicals and related product
Machinery and transport equipment
Source: Statistics Netherlands
The value added to re-exported goods is estimated to add approximately 2.3 percentage points of GDP to the trade in goods surplus.
Goods sent from China to Germany are often unloaded in the port of Rotterdam. The strong growth of exports and re-exports reflects the increasing importance of international trade for the Dutch economy and the difference in the product mix of re-exports (mainly computers and electronic equipment) and domestically produced export goods. Whereas domestically produced exports have a value added of around 59 cent per euro export value, the value added of re-exports is 7.5 cent per euro export value(10). This amount of value added is remarkable, given that re-exports are by definition only subject to very limited changes after they have been imported. Using these figures, the value added to re-exported goods can be estimated at around EUR 15 billion in 2013 (2.3 % of GDP).
Natural resources also sustain the surplus
Net exports of natural gas constitute another structural factor adding about 1 % to 2.5 % of GDP to the trade surplus. This contribution
mainly reflects the combined net exports of
(10) Kuypers, F., Lejour, A., Lemmers, O., & Ramaekers, P.,
Kenmerken van wederuitvoerbedrijven. Centraal
Planbureau/Centraal Bureau Voor de Statistiek, The Hague/Heerlen, 2012.
2.1. Current Account
domestically produced gas and the associated reduced need for energy imports. Additionally, the Netherlands has become an important node in the intra-European gas trade. Looking ahead, with the depletion of domestic reserves, the importance of natural gas production for the Dutch economy is expected to gradually fade. In 2014, and again in February 2015, lower production ceilings were put in place in order to mitigate the sensitivity to gas production-related earthquakes in the northern province of Groningen. These developments, combined with falling oil and gas prices, will significantly reduce the contribution of this factor to the trade surplus in both the short run.
Trade in services is growing
In past years, the Dutch trade in services has increased considerably. From 2009 to 2013,
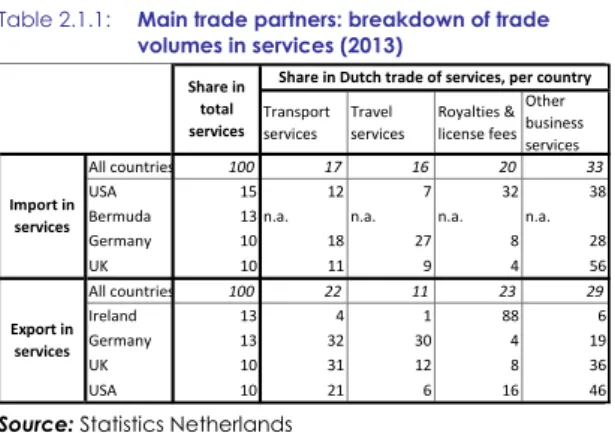
service imports increased by 21 % (to EUR 94 billion, 15 % of GDP) and service exports grew by 34 % (to EUR 110 billion, 17 % of GDP). On the import side, the main trading partners were the US, Bermuda, Germany and the UK (Table 2.1.1) (11). The leading partners in export of services are Ireland, Germany, the UK and the US. The most important Dutch service export to Ireland is 'royalties & license fees' (12). A number of international companies have subsidiaries in the Netherlands and Ireland for reasons of tax optimisation. In 2014, the Irish government decided to change the corporate tax system, thereby making such arrangements less attractive.
(11) No breakdown of service imports is available for Bermuda. The service flows are most likely due to royalty & license fees. See box 5 "Tricks of the Trade" of the IMF's Fiscal Monitor:
www.imf.org/external/pubs/ft/fm/2013/02/fmindex.htm
(12) Statistics Netherlands does not report the breakdown for the item "royalties & license fees". Since the other items add up to 11%, it can be concluded that royalties & license fees represent 89% of Dutch service exports to Ireland.
Table 2.1.1: Main trade partners: breakdown of trade volumes in services (2013) Transport services Travel services Royalties & license fees Other business services All countries 100 17 16 20 33 USA 15 12 7 32 38 Bermuda 13 n.a. n.a. n.a. n.a. Germany 10 18 27 8 28 UK 10 11 9 4 56 All countries 100 22 11 23 29 Ireland 13 4 1 88 6 Germany 13 32 30 4 19 UK 10 31 12 8 36 USA 10 21 6 16 46 Share in total services
Share in Dutch trade of services, per country
Import in services
Export in services
Source: Statistics Netherlands
The surplus in the trade in services is mainly driven by transport services and royalties & license fees (Graph 2.1.3). The net export of
transport services accounts for 1.4 percentage points of the current surplus and is related to the extensive trade and transiting of goods and thus the geographical location of the country. Another 1 percentage point of the surplus is driven by the net export of services related to royalties & license fees. This is mainly due to the service exports to Ireland, which account for 79 % of the positive Dutch trade balance in services. At the same time, Dutch people use more traveling services abroad than foreigners use in the Netherlands, which reduces the surplus in the services account by almost 0.6 pp.
Graph 2.1.3: Net services (exports-imports, in EUR billion (LHS) and as a % of GDP (RHS), 2013) -1.0 -0.5 0.0 0.5 1.0 1.5 -6 -4 -2 0 2 4 6 8 10 % of G D P Eu ro Bn
Source: Statistics Netherlands
Dutch exposure to Russia through foreign direct investment (FDI) is limited. In 2013,
2.1. Current Account
14 nearly EUR 51 billion (7.9 % of GDP). However,
this figure can largely be attributed to special financial institutions (SFIs) that channel funds through the Netherlands. The outflows of direct investment to Russia excluding SFIs totalled EUR 766 million (or 0.1 % of GDP) in 2013.(13) The exposure of the Dutch banking sector to Russia is limited as well, standing at EUR 11.4 billion (1.1 % of total international bank exposure or 1.9 % of GDP) in September 2014.(14)
Primary income
Income generated by foreign investments is the main driver of the primary income account. The
primary income account gives an overview of the income transactions between Dutch residents and non-residents. As in 2013, in previous years the primary income account was mainly driven by investment income, which is by far the largest item in absolute volume (standing at 32.6 % (revenue) and 29.5 % (expenditure) of GDP, respectively). Both revenue and expenditure originate mainly from direct investment abroad and portfolio investment. Other primary income components are much smaller in their absolute volume and balance, both accounting for less than 1 % of GDP. As illustrated in Graph 2.1.4, the balance of direct investment has more than doubled since 2008. This increase resulted in a positive primary income balance in 2010 and has continuously driven the positive balance since 2010.
When considering primary income, the transactions of SFIs (Special Financial Institutions) are disregarded. (15) When
including SFIs in the calculation, the volume of investment income is much higher. In fact, in 2013 SFI transactions accounted for 60 % of inflows and 65 % of outflows of primary income. However, their effect on primary income is minor, after balancing primary income inflows and outflows (see Graphs 2.1.6 and 2.1.5).
(13) Data on FDI stocks excluding SFIs is not available. (14) Source: BIS. https://www.bis.org/statistics/consstats.htm (15) SFIs are special purpose entities owned by non-residents
that mainly deal with channelling funds through the Netherlands, from non-residents to non-residents.
Graph 2.1.4: Breakdown of the primary income balance (% of GDP) -8 -6 -4 -2 0 2 4 6 8 10 08 09 10 11 12 13 14* % o f GDP
Other primary income
Other investment and reserve assets Portfolio investment
Direct investment Compensation of employees Primary income balance
Source: De Nederlandsche Bank and European Commission Winter Forecast 2015
Graph 2.1.5: Investment income expenditure without SFIs
0 2 4 6 8 10 12 99 00 01 02 03 04 05 06 07 08 09 10 11 12 13 % of G D P
Direct investment income Portfolio investment income Other investment income
2.1. Current Account
Graph 2.1.6: Investment income receipts without SFIs
0 2 4 6 8 10 12 99 00 01 02 03 04 05 06 07 08 09 10 11 12 13 % o f G D P
Direct investment income Portfolio investment income Other investment income
Source: De Nederlandsche Bank
Secondary income
The secondary income balance remains negative. Secondary income captures further
redistribution of income through current transfers by governments, charitable organisations and other sectors. In 2013 the Dutch secondary income account ran a deficit of 2.2 % of GDP. These transfers to abroad were roughly equally provided by the general government sector and 'other sectors', similarly to previous years.
2.2. SAVING AND INVESTMENT
16
For decades, the Dutch economy has been a net lender to the rest of the world. In 2013, net
lending(16) of the economy amounted to 7.9 % of GDP, of which 6.3 percentage points originated from non-financial corporations, 3.4 percentage points from households and 0.5 percentage points from the financial sector. The only sector borrowing was general government, which ran a deficit of 2.3 % of GDP in 2013 (Graph 2.2.1). This section first discusses some general patterns of saving and investment before it looks deeper into the household and non-financial corporation sectors. Household saving and investment decisions are highly influenced by institutional features (e.g. of the pension system). Household savings have been relatively stable while investment experienced a sharp drop in 2009 (Graphs 2.2.2 and 2.2.3). Saving and investment decisions of non-financial corporations (Graphs 2.2.2 and 2.2.3) seem to be driven by the increasing importance of foreign investment. As a result, savings of corporations have increased substantially since the turn of the century while their domestic investment has decreased slightly. Graph 2.2.1: Net Lending/ Borrowing by Sector
-8 -6 -4 -2 0 2 4 6 8 10 12 14 99 00 01 02 03 04 05 06 07 08 09 10 11 12 13 % o f G D P Households General government Financial corporations Non-Financial corporations Total Economy
Source: European Commission (Eurostat)
(16) In national accounting, cross-border transactions in goods and services, together with incomes earned abroad and paid to foreigners make up the current account balance. This together with the capital account balance, the in- and outflow of capital, determine whether the economy as whole has been a net provider of finance (net lender) or the opposite (net borrower).
Graph 2.2.2: Saving per sector (% of GDP)
-5 0 5 10 15 20 25 95 96 97 98 99 00 01 02 03 04 05 06 07 08 09 10 11 12 13 % of GD P
Households Non financial corporates Financial corporates Government
Source: European Commission (Eurostat) Graph 2.2.3: Investment per sector in (% of GDP)
0 2 4 6 8 10 12 14 95 96 97 98 99 00 01 02 03 04 05 06 07 08 09 10 11 12 13 % of GDP
Households Non financial corporates Financial corporates Government
Source: European Commission (Eurostat) Households
Institutional features affect the saving pattern of Dutch households. The ECB's household
budget survey shows that persons aged 35 to 64 in the Netherlands have a much lower ability to save than older households. (17) This seems to be at odds with economic theory. Another aspect of this
(17) Finance, Household and Consumption Network, The Eurosystem Household Finance and Consumption Survey. Results from the First Wave. ECB Statistics Paper 2, 2013.
2.2. Saving and Investment
finding is the unusual income pattern across different generations of households (Graph 2.2.5). Contrary to the more common, hump-shaped profile, earnings in the Netherlands are smoothed out over the life cycle due to high transfers from the working population to the older generations through the pension system, leaving little room for additional, precautionary savings.
Graph 2.2.4: Annual household income
16-34 35-44 45-54 55-64 65-74 75+ 0 10 20 30 40 50 60 70 000 s Eur o
EA annual HH income (scaled up to the Dutch average) NL annual HH income
Source: The Eurosystem Household Finance and Consumption Survey
The savings of Dutch households compared to their disposable income have been increasing since the mid-2000s and are now relatively high.
The household sector in the Netherlands saved 15.7 % of its disposable income in 2013, more than in any other Member State except Germany (Graph 2.2.6). However, only since 2011 has the Dutch saving ratio (18) started to steadily outperform the euro area average (19) and exceed Belgian and French ratios.
The high saving rate relative to income does not translate into high gross savings as a percentage of GDP. Even though wages and salaries (in
proportion to GDP) have been about 2 percentage points higher than in Germany and on par with Belgian and French wages, disposable income is relatively low, largely due to income taxes and
(18) Here, the saving rate is calculated as gross savings divided by disposable income, with data from national accounts. (19) Only 12 Member States, for which data are available, are
accounted for in the euro area average.
high social security contributions. As a result, gross savings have for several years fallen short of the euro area average (Graph 2.2.7) and amounted to only 7.7 % of GDP in 2013.
Graph 2.2.5: Gross saving ratio (% of disposable income)
8 10 12 14 16 18 20 00 01 02 03 04 05 06 07 08 09 10 11 12 13 % EA18 BE DE FR IT NL
Source: European Commission (Eurostat) Graph 2.2.6: Gross saving (in % of GDP)
5 6 7 8 9 10 11 12 00 01 02 03 04 05 06 07 08 09 10 11 12 13 % o f G D P EA18 BE DE FR IT NL
Source: European Commission (Eurostat)
Liquid assets of the working population, that could be used when negative shocks to income occur, are relatively low. Saving for old age takes
the form of social security contributions and life insurance premiums. Pension contributions for employed workers are substantial and are not included in the saving rate. When pension
2.2. Saving and Investment
18 contributions are taken into account as savings, the
resulting Dutch savings rate is above the average of the same indicator for the euro area by a considerable margin. Housing investments are often financed through mortgage loans that put monthly payment obligations on households. Most of these outlays increase the saving rate of Dutch households; however, they do not constitute liquid financial assets that could be tapped when negative shocks hit income or wealth. Indeed, according to the ECB's household budget survey, fewer Dutch households (33.1 %) report that they can set money aside than in the euro area (41.1 %) or in Germany (53.1 %), where this ratio is the highest. In sum, the working population saves more in total than in any other country (accounting for pension contributions as savings), yet liquid savings are quite low (see Graph 2.2.8).
Graph 2.2.7: Liquid assets and debt service to income
0 5 10 15 20 25 30 35 BE AT DE IT LU EA FR NL PT ES SK CY GR SI %
Net liquid assets as a fraction of annual gross income Debt service to income ratio, households with debt other than credit lines, overdrafts or credit card debt
Source: The Eurosystem Household and Consumption Survey
Pension funds hold a large part of households savings. The Netherlands has a three pillar pension
system that results in high replacement rates (i.e. a high pension benefit in percentage of pre-retirement income) and low poverty among the elderly. Virtually all employed workers have to participate in one of the over 300 pension funds that are managed by the social partners and usually cover a certain sector or a large company (the number of pension funds has decreased steadily in recent years and concentration is high).
The pension funds have accumulated substantial assets but liabilities have grown even more strongly during the crisis. Pension
contributions are in most cases around 16-20% of gross income. Pension funds have accumulated assets amounting to over 150% of GDP in 2013, which makes the second pillar the largest (by assets) in the EU. The ratio between assets and liabilities (the coverage ratio) has worsened during the crisis partly due to the low interest rates that have decreased the rates the pension funds have to use to discount their liabilities. As a result, many pension funds had to restore their coverage ratios by increasing contributions. This has led to lower disposable income, amplifying the procyclicality inherent in the pension system.
The Dutch pension system frontloads savings to the early years of the working life. The pension
system credits the same amount of old-age entitlement for each euro of contribution paid by the member, irrespective of the worker's age. This implies an intergenerational transfer from young people to the old. The regulatory framework reduces the financial margin for younger households to engage in voluntary savings to smooth out income shocks, to accumulate a downpayment for a dwelling or to amortise a mortgage.
The regulatory features of the pension system could lead to a suboptimal allocation of capital.
Given the incentives that are created by the regulatory framework pension funds are free in their investment decision but members cannot freely choose their preferred allocation of pension assets, potentially leading to a suboptimal allocation of assets from a household's point of view. Investment decision could also be suboptimal from a macroeconomic perspective. Pension funds invest around 17% domestically. They target an equity allocation of around 40%, whereas the rest is for a large part invested in bonds. The share invested in Dutch mortgages is far lower than the share invested in the Dutch sovereign despite interest rates being much higher for the former. The age profile of their members and the still dominant presence of defined-benefit contracts could be factors influencing this allocation of capital.
Investment decisions of households have also been influenced by economic policy. Households
2.2. Saving and Investment
mainly invest in dwellings, which many governments have supported by targeted policy measures. The most important of such measures in the Netherlands is the tax-deductibility of mortgage interests. From the mid-1990s, this triggered a credit-led boom in the housing market that regained momentum in the early years of the 2000s (Graph 2.2.10). The continuous rise in house prices was reversed in 2009 by the financial crisis and led to a considerable decline in investment in dwellings and other buildings. The medium-term outlook for the housing market is more benign; prices and the number of transactions are increasing again (see Section 2.3) and can be expected to result in families investing more in their housing.
Graph 2.2.8: Investment by type
0 10 20 30 40 50 95 96 97 98 99 00 01 02 03 04 05 06 07 08 09 10 11 12 13 Eur o Bn Dwellings
Buildings other than dwellings Other structures
Transport Equipment Machinery and installations R&D and software Others
Source: Statistics Netherlands
The design of the institutional framework of the pension system has implications on economy-wide saving and investment patterns. Aligning
pension contributions with entitlements by reducing premiums for the younger generations could impact on the deleveraging of households or support domestic demand. Positive effects can be expected from the current gradual changeover from a defined-benefit to a defined-contribution system that makes it more attractive for pension funds to invest in (domestic) equity, potentially stimulating domestic demand.
Banks and insurance companies
The Dutch banking sector is large, with total assets of almost five times GDP. Although the
sector is smaller than that of the UK, it is much larger than that of Germany and has a high degree of concentration. Dutch banks hold relatively large mortgage portfolios, amounting to around 90 % of GDP, double the average of the euro area. As domestic deposits do not match the mortgage portfolio, Dutch banks have a sizeable funding gap. As new mortgages take the form of linear or annuity mortgages and the maximum loan-to-value ratio is being reduced stepwise, the funding gap should gradually decrease in the coming years.
Non-financial corporations
Savings of non-financial corporations (NFCs) have constantly been higher than their investments. The excess of gross corporate saving
over domestic investment has widened since the late 1990s and is the result of the decline in their investments and, more importantly, a sharp increase in their savings (Graph 2.2.11). The difference between savings and investments is the funding that corporations provide to other sectors. In the case of multinational companies this can also mean subsidiaries abroad. Profits that subsidiaries make and keep for their use, the so-called reinvested earnings, also constitute such intercompany lending. Therefore, when looking at the net lending capacity of NFCs in the Netherlands, income that is transferred or earned abroad in conjunction with inflows and outflows of direct investments has to be taken into account.
2.2. Saving and Investment
20 Graph 2.2.9: Savings and domestic investment of
non-financial corporations (in % of GDP)
0 2 4 6 8 10 12 14 16 18 20 95 96 97 98 99 00 01 02 03 04 05 06 07 08 09 10 11 12 13 % o f GD P Savings Investment
Investment (EA average)
Source: European Commission (Eurostat)
NFCs in the Netherlands distribute only a small share of their profits, which largely explains the high savings of the sector. Table 2.2.1 shows how
the net operating surplus and net lending of NFCs are determined in the Netherlands and compares these figures, as an example, with Germany (which also has a sizeable current account surplus but of a very different nature). The difference in net lending of NFCs is mainly driven by the fact that Dutch companies pay out a much smaller share of profits to their shareholders. The phenomenon of earnings retention is largely concentrated in multinationals. The effect is particularly significant for the Netherlands because shares of Dutch companies that are foreign-owned amounted to 55% of GDP in 2011 compared to only 22 % in Belgium and 20 % in Germany. Higher dividend payments could imply a lower current account surplus.
Table 2.2.1: Net lending by non-financial corporations in 2013 (as a percentage of GDP)
NL DE
Gross Value added 58.9 56.8
Wages (-) 35.5 33.6
Indirect taxes less subsidies (+) 0.1 0.4
Consumption of fixed capital (-) 9 10
Net operating surplus 14.5 13.6
Net interest (-) -0.2 -0.1
Dividend (+) 3.6 1.9
Net income from land and mineral reserves (-) 1.8 0.1 Retained earnings from direct foreign investment (+) 0.1 1.2
Net profit before taxes 16.6 16.7
Dividend and other profit distributions (-) 6.1 12.6 Retained earnings from direct foreign investment (-) 0.9 0.1
Current taxes on income and wealth (-) 1.5 2.1
Net other current transfers (+) -0.4 -0.3
Net saving (net disposable income) 7.7 1.6
Net capital transfers (+) 0.1 0.5
Net capital formation (-) 1.6 0.3
Net lending 6.3 1.8
Source: European Commission (Eurostat)
Savings from domestic operations and investment of non-financial corporations have been relatively stable and more balanced than net lending suggests (Graph 2.2.12). Gross capital
formation of Dutch corporations has been relatively stable since 1995 at around 10 % of GDP. The (relatively small) volatility seems to follow the economic cycle. Graph 2.2.12 depicts how domestic savings (defined as gross savings excluding net foreign income) compare to domestic investments by Dutch NFCs. There is still a saving surplus but it is much smaller than when foreign operations are also considered. One important reason is that international investments and profits have become more significant over the years.
2.2. Saving and Investment
Graph 2.2.10: Domestic savings and investment of non-financial corporations 0 2 4 6 8 10 12 14 16 95 96 97 98 99 00 01 02 03 04 05 06 07 08 09 10 11 12 13 % of G D P
Gross capital formation Domestic saving
Source: Statistics Netherlands and European Commission Calculation
Graph 2.2.11: Net FDI outflow and net foreign saving of non-financial corporations -10 -5 0 5 10 15 95 96 97 98 99 00 01 02 03 04 05 06 07 08 09 10 11 12 13 % o f G D P
Net FDI outflow Net foreign saving
Source: Statistics Netherlands, International direct investment database (OECD) and European Commission Calculation
2.2. Saving and Investment
22 (Continued on the next page)
Box 2.2.1: Balance Sheets of Non-Financial Corporations
The increasing savings of non-financial corporations also reflect a continuous improvement in their balance sheets. Negative shocks, such as the burst of the dot.com bubble and the Great Recession, have
prompted companies to strengthen their equity position. Indeed, since 2002 the Dutch non-financial corporations (NFC) have embarked on a deleveraging process in which large corporations(1) have
increased their equity share from around 37% of their balance sheet in 2002 to around 45% in 2013. In the same time, small and medium-sized enterprises (SMEs) have raised their equity ratio from under 34% to 41%. The composition of resources has not changed much: larger companies hold 5% of their assets in cash or in other highly liquid form, whereas smaller companies keep around 15% in liquid assets. Over the longer term, however, large companies have gradually replaced their fixed capital and stocks with shares in other companies (domestic or abroad), effectively moving parts of their activities abroad. As a consequence, the capital and stock-intensity of Dutch corporations has decreased, and acquisitions consolidated the sector. In their attempt to strengthen their balance sheets, Dutch non-financial corporations have also decreased their pay-outs to shareholders. Both developments (reducing liabilities and limiting dividend payments) contribute to the increasing savings of Dutch NFCs.
Graph 1: Aggregate balance sheets of large NFCs, in % of total balance sheets
0 5 10 15 20 25 30 35 40 77 83 89 95 01 07 12 %
Intangible fixed assets Tangible fixed assets
Equity holdings Long-term claims
Inventories Short-term claims
Liquid assets 0 5 10 15 20 25 30 35 40 45 50 77 83 89 95 01 07 12 Total equity
Long-term liabilities, w/o interest Long term liabilities, with interest Short term liabilities
Due to a revision of accounting standards no data available for 2008 -2011 Source: Statistics Netherlands
__________________________________________________________________________ (1) Non financial corporations are defined as "large" if they have a balance sheet (at the end of the year) of at least EUR 40 million. The dataset excludes companies in real estate.-
2.2. Saving and Investment
Box (continued)
Graph 2: Aggregate balance sheets for small NFCs, in % of total balance sheets
0 5 10 15 20 25 30 35 40 92 93 94 95 96 97 98 99 00 01 02 03 04 05 06 07 11 12 13 %
Intangible fixed assets Tangible fixed assets
Equity holdings Long-term claims
Inventories Short-term claims
Liquid assets -10 0 10 20 30 40 50 92 93 94 95 96 97 98 99 00 01 02 03 04 05 06 07 11 12 13
Total equity Provisions
Long term liabilities Short term liabilities
Due to a revision of accounting standards no data available for 2008 -2011 Source: Statistics Netherlands
:
Part of the high share of retained earnings by SMEs could be caused by the specific tax treatment of director-major shareholders. The Dutch tax system entails a specific tax treatment of director-major
shareholders (a person that holds a significant position in a company and owns a large part of the shares). The Netherlands has seen a strong increase in entrepreneurship headed by a director-major shareholder. Whereas there were 126 000 director-major shareholders in 2001, this number increased to 193 000 in 2012.(2) This change could be partly explained by tax motivations. An entrepreneur pays income taxes to
a maximum rate of 52%. However, the profits distributed as dividends are taxed at a lower rate (3). There
is thus a tax incentive for an entrepreneur to set himself up as a director-major shareholder and to pay himself the lowest wage allowed. At the same time, a director-major shareholder has a tax motivation to retain earnings in the company, instead of paying dividends, as the former are not subject to wealth taxation while the latter are. Consequently, companies with a director-major shareholder pay only a quarter of their net earnings in dividends.(4) If director-major shareholder companies had the same pay-out
ratio as companies without a director/majority shareholder, their annual savings would be lower by approximately 0.5% of GDP.(5) A director-major shareholder may also reduce corporate income tax
obligations by dedicating part of the company's cash reserve for his future pensions. These pension savings show up as corporate savings in the national accounts even though they are earmarked as pension savings for the entrepreneur.
____________________________________________________________________________
(2) CBS, Achtergrondkenmerken en ontwikkelingen van zzp’ers in Nederland, 2014.
(3) Dividends are first taxed under the corporate income tax regime (20% up to 200.000 euros and 25% above) and subsequently as income from material interest under the personal income tax regime (22% up to 250.000 euros and 25% above).
(4) Van Dijkhuizen, Naar een activerender belastingstelsels, Eindrapport Commissie inkomstenbelasting, June 2013. (5) Ibid.