Policy Research Working Paper
5323
Obstacles to Growth for Small and Medium
Enterprises in Turkey
Murat Şeker
Paulo Guilherme Correa
The World Bank
Financial and Private Sector Vice Presidency
Enterprise Analysis Unit
&
Europe and Central Asia Region
Private and Financial Sector Development Unit
May 2010
WPS5323
Public Disclosure Authorized
Public Disclosure Authorized
Public Disclosure Authorized
Abstract
The Policy Research Working Paper Series disseminates the findings of work in progress to encourage the exchange of ideas about development issues. An objective of the series is to get the findings out quickly, even if the presentations are less than fully polished. The papers carry the names of the authors and should be cited accordingly. The findings, interpretations, and conclusions expressed in this paper are entirely those of the authors. They do not necessarily represent the views of the International Bank for Reconstruction and Development/World Bank and its affiliated organizations, or those of the Executive Directors of the World Bank or the governments they represent.
Policy Research Working Paper 5323
Many studies have shown that firm growth decreases monotonically with size and age. In this study, the authors investigate employment growth of firms in Turkey with an emphasis on small and medium size enterprises. In Turkey, small and medium size enterprises account for almost 77 percent of employment and play a crucial role in the economy. However, the analysis of firm dynamics in Turkey shows that medium-size firms
This paper—a joint product of the Enterprise Analysis Unit, Financial and Private Sector Vice Presidency; and Private and Financial Sector Development Unit, Europe and Central Asia Region—is part of a larger effort to understand the functioning of the private sector. Policy Research Working Papers are also posted on the Web at http://econ.worldbank. org. The author may be contacted at [email protected].
(51–250 workers) are the slowest growing group in the economy. Moreover, small and medium size enterprises grow at a slower rate in Turkey than in several comparator countries in the Eastern Europe and Central Asia region. After determining this irregularity, the paper analyzes how the investment climate affects firm growth and finds that improved access to finance is the most important factor that significantly increases firm growth rates.
Obstacles
to
Growth
for
Small
and
Medium
Enterprises
in
Turkey
By
Murat
Ş
eker
*And
Paulo
Guilherme
Correa
†
* Enterprise Analysis Unit, Finance and Private Sector Development, World Bank; 1818 H Street NW. Washington DC MSN F4P‐400, 20433 Email: [email protected]
† Europe and Central Asia Region, Finance and Private Sector Development, World Bank, 1818 H Street NW.
2
1.
Introduction
One of the most stylized facts in firm and industry evolution is that growth rates decrease as size and age increase. Dunne, Roberts, Samuelson (1989), Evans (1987a, 1987b) and numerous other studies have provided evidence on these regularities. Studies like Jovanovic (1982), Cooley and Quadrini (2001), Klette and Kortum (2004), Klepper and Thompson (2007) construct structural models that can explain these regularities. Basically, diminishing returns to scale or bounded efficiency can explain the negative relation between size and growth. Similarly, diminishing returns to learning can explain the inverse relation between growth and age. Jovanovic (1982) argues that firms learn their efficiency levels over time. Least efficient firms exit and more efficient firms adjust their scale of operations through learning. Hence small and young firms grow faster because they are in the initial process of uncovering their efficiency levels.
In this study, we investigate employment growth of firms in Turkey with an emphasis on small and medium size enterprises (SMEs). SMEs in Turkey play a crucial role in economic development. They account for 76.7 percent of employment, almost 40 percent of investments, 26.5 percent of total value added and 25 percent of bank credit. Moreover, a healthy SME sector is important to increase the resilience of the economy to economic shocks. Hence it is important to understand whether SMEs face any obstacles in their evolution and how does a better investment climate (IC) contribute to their expansion.
There are numerous factors that can affect firm growth. The levels of technology and human capital, the development level of the country, or the environment in which the firms operate are very crucial for growth. Especially for the developing countries where infrastructure, financial, or regulatory services don’t function smoothly, firms can be discouraged to grow. SMEs that may lack the capacity to cope with these distortions could be severely affected. Beck, Demirguc‐Kunt, and Maksimovic (2005) show that financial, legal, and corruption related problems distort firm growth. They also show that whether these factors affect growth depends on firm size and among all firms, small firms are the most constrained group. In a more recent study Aterido, Hallward‐Driemier, and Pages (2009), analyze how investment climate affects firm growth using a wide set of objective measures for obstacles. They show that poor investment climate hurts firm growth and the amount of distortion varies by firm size.
Using detailed firm level data from the recent Enterprise Survey3, we first analyze whether the stylized fact on the relation between growth, size, and age holds for Turkish firms. Analysis shows that there are some irregularities on firm growth rates. Medium size firms are the least growing group of firms in the economy. Then, we investigate whether the investment climate plays any role in affecting growth. Analysis shows that better access to finance significantly increases growth of firms. However, interaction of the IC variables with the firm size shows that the IC variables don’t have any differentiating effect on the growth rates of firms at different size groups.
The Enterprise survey was conducted in 28 other countries in the Eastern Europe and Central Asia (ECA) region in the same time period it was conducted in Turkey. This allows us to compare firm
3 See www.enterprisesurveys.org for the detailed description of the data and methodology used in sampling. The full dataset is available on this website.
3 evolution in Turkey with other countries in the region. We compare Turkey with Russia, Ukraine, Poland, Romania, EU‐8 and EU‐10 countries and All ECA region4. Conditional on survival, small firms are likely to grow quickly. Hence firms in small size group are likely to be young. This is the case in all of the comparator countries except Poland. However, in Turkey there are quite many small firms that are old. This observation might reflect that small firms do not grow enough relative to corresponding firms in the same size group in other countries. Comparison of the growth rates of firms at different size groups in Turkey with the comparator countries supports this argument. Small and medium size firms (SMEs) grow at a slower rate in Turkey.
The rest of the paper is organized as follows. Section 2 explains the data and provides a descriptive analysis of firm growth. Section 3 elaborates on analyzing firm growth. Section 4 compares firm evolution in Turkey with comparator countries from the region as well as with all ECA region combined. Section 5 analyzes effects of business environment on firm evolution. Section 6 provides robustness analysis for the main results. Section 7 provides a policy evaluation and concluding remarks.
2.
Data
and
Descriptive
Analysis
Data for this analysis were collected through World Bank’s Enterprise Surveys. It is a comprehensive establishment level database of 1,152 establishments who are interviewed between April 2008 and January 20095. In the survey, a random sample of firms is selected that is representative of the economy. The sample of firms is stratified by sector, size, and location. The survey provides information on firm characteristics, various performance measures, and the business environment. Same survey is implemented in 28 other countries in the ECA region during 2008 and 2009.
In analyzing how firm evolution changes with size, we divide firms into four size groups measured in full‐time employment levels: Micro: ≤10, Small: 11‐50, Medium: 51‐250, and Large: ≥251. These groups are constructed according to the employment level of the firms in 20046. We also divide firms into three age groups as: 1‐5, 6‐15, and ≥16. In addition to the cross‐sectional data from 2008 survey, there are 419 firms that were surveyed both in 2005 and 2008. The firms in this panel dataset are from manufacturing sector7. Number of firms in the sample in each size and age group for both all data and the panel data are shown in Table 1. As expected, larger firms are more likely to be older.
The survey includes data from manufacturing, retail, and other service sectors. The two digit classification of the industries is made according to ISIC revision 3.1. The list of industries covered in the data and the number of firms at different size groups are given in Table 2. The biggest industry in terms of number of observations is Textiles which is followed by Food industry. For most of the industries size distribution has a long right tail. Small firms make the largest group of firms in almost all industries. Textile industry has the highest share of large firms. The survey data is also inclusive of all regions in
4 EU‐10 includes 2009 data from Bulgaria, Czech Republic, Estonia, Hungary, Latvia, Lithuania, Poland, Romania,
Slovak Republic, and Slovenia and EU‐8 excludes Bulgaria and Romania from EU‐10 group.
5 From here on, I’ll refer to the unit of observation as firm instead of establishment.
6 The questions in the survey refer to the last complete fiscal year which is 2007. The survey asks the number of full‐time employees in the last fiscal year and three fiscal years ago which is 2004. Annual growth rates are
calculated using these questions.
4 Turkey. There are five big regions covered which are listed in Table 38. Around 40% of firms in all regions are small firms. 40% of firms in Black Sea‐Eastern region are micro firms. This region has the lowest share of large firms.
Using the size and age groups described above, we calculate the growth rates for firms as the annual increase in full‐time employment level between 2004 and 2007. Table 4 shows the average growth rates of firms controlling for both size and age groups for all firms and for the panel firms9. Growth rates decrease as size increases and medium size firms are the slowest growing group in the economy. The table also shows that when age is controlled medium size firms grow at the slowest rate among firms at 1‐5 and 6‐15 years age group. Similar results emerge for the panel data. This result is in opposition with the stylized facts about size and growth rate. Since the study of Dunne, Roberts, and Samuelson (1989), many studies have shown that growth rate decreases monotonically in size when age is controlled.
Next, we look at the growth rates of firms at different size groups in 2‐digit industries in Table 5. In two of the biggest manufacturing industries, Food and Garments, medium size firms grow at a slower rate than large firms. In garments industry, medium size firms have contracted by 11 percent. Similarly, in wholesale and retail sectors medium size firms grow less than large firms. However the result for wholesale sector can be affected by small sample problem because there is only one large firm in the sample for this industry. Investment climate is likely to differ across different regions of the country. Hence the irregularities in firm growth could be caused by regional factors. How employment growth rates change across size groups within five major regions are given in Table 6. Micro firms have the highest growth rate. In Central Anatolia and Black Sea‐Eastern regions small firms have the lowest growth rates. In Marmara and Central Anatolia small and medium firms have slower growth rates than large firms.
3.
Regression
Analysis
To elaborate on the findings from descriptive tables presented in the previous section, we perform regression analysis. We analyze how growth rates of firms differ by size controlling for certain firm characteristics, industry, and regional fixed effects. Then we incorporate certain investment climate (IC) variables to see whether they play any role in explaining the differences in the growth rates of firms. In the regression analysis, we include the four size groups described above: micro, small, medium, and large firms. These size groups are determined according to firm employment level at 2004. Since firm growth can be affected by certain firm characteristics, we control for age, trade orientation, and ownership status of the firm. There is a vast amount of evidence showing that globally engaged firms through exporting or foreign ownership grow faster than non‐trading and completely domestically
8
There are 7 geographic regions in Turkey. Mediterranean and South East Anatolia regions were combined and
named as South. Black Sea and Eastern Anatolia regions are also combined and named as Black Sea‐Eastern.
9 In the growth rates of employment, there was a single firm with annual growth rate of 300%. That observation was excluded from the analysis. For alternative controls of outliers, we checked the firms that were 4 standard
deviations outside the mean growth rate. There were only three additional entries. Their exclusion didn’t affect
the results. For the panel firms, three observations with growth rates more than 200% were excluded. This value
5 owned firms. We include a dummy variable to control for firms that generate more than 10% of their sales from exports and another variable to control for foreign ownership defined as 10% or more share in firm ownership. Firms with government ownership might also grow at different rates because their objectives might differ from a completely private owned firm. To control for this factor, we include a dummy variable defined as 10% or more share in the ownership10. In addition to these firm characteristics, we control for 2‐digit industry and the region fixed effects.
The specification used in the regression analysis is given in equation 1. Annual growth rate of full‐time employment of firm i at between t and t‐3 (between 2007 and 2004) is represented by git.
Smallit‐3, Mediumit‐3, and Largeit‐3 stand for the indicators for firm size in 2004 which are obtained from
the survey11. The omitted group is micro firms. Ageit‐3 is the age of the firm in 2004. Exportit, Foreignit,
and Govtit are the other firm level control variables which are only available in 2007. However, in the
regressions for the panel data we use the values of the control variables directly from 2005 survey. Similarly the size groups for panel data are constructed from the 2005 survey. Finally Industryt and
Regiont control for the 2‐digit industry and the region of the firm. In all regression analyses performed in
this study, probability weights are used in order to get results that are representative for all firms in Turkey. All standard errors are clustered to allow for possible correlations in growth rates across firms within the same industry and region,
ε . (1)
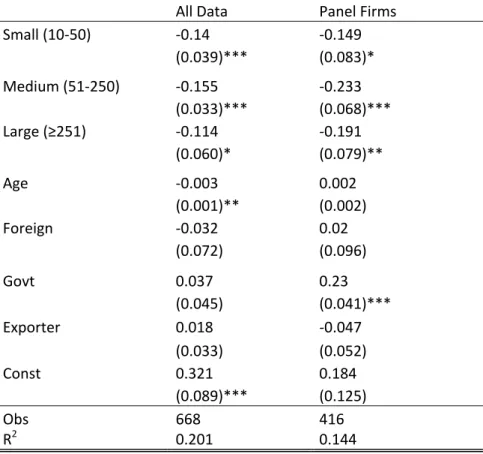
The regression results are given in Table 7. All regression results show that micro firms are the fastest growing group and growth rate decreases as size increases. However the decrease is not monotonic. Medium size firms are the least growing group in both regressions. As expected, younger firms grow faster than old firms.
4.
Comparison
with
Other
Countries
in
the
Region
In this section, we compare firms in Turkey with firms from several other countries in ECA region. The survey that was implemented in Turkey in 2008 was also implemented to other countries in the region which makes it possible to make cross‐country comparisons. A list of these countries is given in Table 18. Among these countries, we compare firm growth in Turkey with Russia, Ukraine, Poland, Romania, EU‐8, EU‐10, and “All ECA” region combined. Table 8 shows the proportion of firms in each size‐age group for each country. The values in the total row and total column in each table show the total number of firms in each cell incorporating the probability weights in the calculations. Hence the tables are representative of the firm population in each country. There are three age groups: 1‐5 years, 6‐15 years, and ≥ 16 years and four size groups as described before. All size and age groups are constructed using the 2004 values.
10
The firms that are 100% government owned are excluded from the survey.
11 The survey included questions asking the levels of employment and sales for last fiscal year and three fiscal years before.
6 As expected, in all comparator countries as well as in Turkey, large firms are more likely to be older. On the other hand, in Turkey, there are quite many micro and small firms who survive for longer than 16 years (see Figure 1). 26 % of micro firms and 31% of small firms are more than 16 years old. The values in these cells are much smaller in the other countries except Poland. In Russia only 5 % of micro firms are older than 16 years, and in EU‐10 countries it is only 11%. A similar result emerges for medium size firms. 60% of medium size firms in Turkey are more than 16 years old, whereas in the comparator countries this share is around 20% and 25% in the all region. This observation might imply that firms in these size groups don’t grow enough in Turkey. Dunne, Roberts, and Samuelson (1989) perform the same descriptive analysis for the US firms. Table 1 in their study shows the fraction of firms in each size‐ age group. However their size and age classification is slightly different than the ones used here. They find that fraction of firms with 5‐19 employees who are between 11‐15 years old is 7%. In the same age group, fraction for firms with 20‐49, 50‐99, and 100‐249 employees vary around 9%. These values are consistent with the values for “All ECA” region.
Next we compare the growth rates across countries. We run the same regression equation given in equation 1 for all comparator countries. The results are given in Table 9. Relative to micro firms, small and medium size firms have the slowest growth rate in Turkey. In the ECA region, growth rates decrease monotonically. Moreover, in all comparator countries, small and medium size firms grow faster than large firms.
Finally we analyze whether the growth rates of firms in Turkey are significantly different from the comparator countries. For this analysis, we combine the data from Turkey with each comparator country. Then we include dummy variable indicating Turkish firms. Interaction of this dummy variable with the size groups measures if the average growth rate in each size group in Turkey differs from the growth of firms in the same size group in the comparator countries. We use the regression equation specified in equation 2 where TRt is the dummy variable for Turkey,
ε . (2)
Regression results are given in Table 10. Each column shows the result of the regression that includes only the data from the comparator country (or group of countries) and Turkey. All_ECA column includes all countries in the region. Results show that small and medium size firms in Turkey grow at a slower rate than the same size firms in the comparator countries. This result can explain why there are more SMEs at old ages in Turkey relative to the comparator countries. On the other hand, regression results show that there is not much difference in the growth rates of large firms across countries.
5.
Effects
of
Investment
Climate
on
Firm
Growth
Here, we analyze whether business environment plays any role in affecting growth rates. For this purpose, we incorporate the IC variables from the survey in the regression analysis. However, inclusion of the IC variables as explanatory variables is not straight forward. Since the main data source is cross‐sectional, inclusion of the IC variables can cause endogeneity problem even when the chosen variables are not subjective measures that depend on firms’ perceptions of the business environment.
7 Faster growing firms might be more likely to have access to external finance or they might be interacting more with government officials. To alleviate this problem, we use industry‐region averages for the IC variables. With this averaging, we intend to capture the total effect of the business environment in which firm operates. We exclude the cells with less than 5 observations from the analysis. These observations correspond to 5% of the all dataset. The list of the objective IC variables used in the analysis is given in Table 11.
Including each IC variable one at a time, we run the regression specified in equation 3. This specification is same as the one presented in equation 1. In addition, ICvarjct is included which
represents the value of the average investment climate variable at industry j, region c, and time t,
ε . (3)
The results of this regression are given in Table 12. For brevity we included some of the IC variables with which the regression analysis is performed12. Each row shows an IC variable that is included in the regression equation. In all regressions micro firms are the fastest growing group. They are followed by small firms. In most of the regressions medium size firms are the slowest growing group. Two of the IC variables significantly contribute to firm growth. They are access to external finance and having a line of credit13. One percent increase in access to external finance increases growth by 0.3 percentage points. Similarly as the probability of having a line of credit increases by one percent, growth rate increases by 33 percentage points. The only other IC variable that had a significant coefficient is time it takes to export products. However the coefficient has a positive sign which might be due to reverse causality. Firms that grow faster are likely to export more and hence might be spending more time at the customs. Next, we analyze whether the IC variables have any differential affect on the growth rates of firms at different size levels. In order to do this, we include interaction terms of the IC variables with the size dummies. This specification is given in equation 4, ε . (4)
The results of this regression are given in Table 13. Two IC variables, access to external finance and having a line of credit continue to be positive contributors of employment growth. When access to finance is controlled for, medium size firms are the lowest growing group. However, this IC variable does not affect firms at any size group differently. On the other hand, small and large firms find line of credit more constraining than the firms in other size groups. Another interesting result emerges for the informal payments. When included in the regression, amount of informal payments is positively correlated with growth; however it significantly reduces growth rates of small and large firms.
12 Results for the regressions with other IC variables are available upon request. 13
External finance for investment includes all sources other than internal funds or retained earnings such as
issuance of new equities, public and private banks, purchases on credit from suppliers and advances from
8 Aterido, Hallward‐Driemier, and Pages (2009) perform a similar analysis on the relation between firm growth and investment climate using a more comprehensive dataset from Enterprise Surveys. They use data from over around 80,000 firms from 110 developing countries in seven different regions of the world. Their analysis shows that growth rate decreases monotonically as size increases. The results that are presented for Turkey in Table 12 and Table 13 are not in accordance with their findings.
6.
Robustness
Although averaging the firm level values of IC variables over industry‐region alleviates the endogeneity problem, it might not remove it completely. We perform the same regression analysis specified in equation 3 restricting the sample to panel firms. In the panel regressions, we use the values of firm characteristics and IC variables from the 2005 survey and analyze how these factors relate to firm growth between 2004 and 207. Here we cluster the standard errors at 2‐digit industry level.
Results of the regression for the panel data are given in Table 14. Despite of the small sample size of the panel data and the inclusion of the controls for IC variables, for most of the regressions, medium size firms have the lowest growth rate. On the IC variables, time to clear customs for both exporting and importing is negatively related to firm growth.
As an alternative to four size groups, we constructed three size groups measured as total full‐ time employment. In this grouping, size classes are Small: Size≤19, Medium: 20‐99, Large: ≥100. This is the classification used in Enterprise Surveys for stratifying the population of firms in size. In Table 15, for brevity, we only present the results that include external finance and line of credit as IC variables. These IC variables were the ones that had significant coefficients in the main regression results and they are the only variables that persisted to be significant in this alternative size grouping. In these regressions, the group of firms with less than or equal to 19 employees is omitted. The non‐monotonic decrease in growth rates as size increases is observable in this size grouping as well.
We also used several alternative definitions of growth rates. One is log of employment growth and another one is an extensively used measure of job creation and destruction. It is calculated by dividing the difference in employment levels over the past three years by the simple average of employment levels over the same period. This measure is bounded by values of ‐2 and 2 and provides more robust estimates to outliers. In either case the relation between size and employment growth was not sensitive to these alternative measures of growth.
The non‐monotonic decrease in growth rates could be affected by labor regulations. The stringent labor regulations can distort firm growth by increasing the opportunity costs of hiring. This could have the most negative effect on SMEs as these firms have neither the capacity of large firms nor the flexibility of micro firms to cope with the effects of these policies. The survey includes a question that asks the firm’s perception on how constraining labor regulations are to its current operations. Firm can choose one of the five options which are no obstacle, minor obstacle, moderate obstacle, major obstacle, very severe obstacle. I set a dummy variable equal to one if the firm’s response is major or very severe obstacle. Then following the same methodology applied to other IC variables, I average the value of this variable for all firms that responded at industry‐region level.
9 Table 16 shows the regression results using this generated variable as a control for the stringency of current labor regulations. Medium size firms are the least growing firms relative to micro firms. Interestingly, the coefficient of this IC variable is positive and significant. This could mean that firms that grow faster complain more about labor regulations. The second column in the table includes interaction terms with size classes. The coefficient of labor regulation loses significance and the interaction terms are not significant as well14.
To provide further support to the significance of access to finance for firm growth, we used principal component method. First we determined the principles of the IC variables that measure access to finance. The first regression uses six of the seven IC variables that are related to access to finance in Table 11. The excluded variable is the use of collateral. Collateral variable is included in the second estimation15. Since very few firms answered the question for collateral usage, the sample size in the second regression is much smaller. The principal component analysis allows me explain the overall effects of variables representing access to finance. In the regressions, we only included the first component. Higher ranked components didn’t have significant coefficients. In both regressions, access to finance contributes positively to growth and medium size firms grow significantly less than micro and large firms.
7.
Policy
Evaluation
and
Conclusion
In this study, we analyze how firms evolve in Turkey. A well established fact on firm evolution is that the growth rate decreases in size and age. Analyzing a recent firm level dataset from Enterprise Surveys, we show that the growth rate decreases in a non‐monotonic way in Turkey as size increases. Comparison of evolution of Turkish firms with several comparator countries in the ECA region shows growth rates of SMEs are significantly lower in Turkey than the firms at the same size group in comparator countries. One possible explanation for why SMEs grow less goes in line with the discussions of missing middle hypothesis. There are several studies which discuss this issue such as Gauthier and Gersovitz (1997), Sleuwaegen and Goedhuys (2002), and Van Biesebroeck (2005). They argue that
existing policies and regulations can be more distortive to SMEs than micro and large firms. As a
result, these firms might have difficulties evolving into larger firms.
From a policy perspective, development of efficient institutions that improve functioning of markets is crucial for firm growth. Reforms that focus on improving opportunities and incentives for SMEs to grow can be productive for these firms to catch up with their counterparts in other countries in the region. It is important to implement policies that promote economic activity by these groups of firms. The analysis performed in this study shows that among all measures of investment climate increased access to finance stands out as an important contributor of firm growth. The firms that finance their investments through external sources and that have a line of credit or a loan from a financial institution grow faster in Turkey. This finding is robust to alternative definitions of firm growth and when the analysis is performed with the panel data alleviating the endogeneity problem. This strong
14
I perform the same analysis using 3 size groups as an alternative. The results are quite similar.
15 For all variables but collateral, higher values should lead to higher growth. To be consistent with this definition, I multiplied collateral variable with ‐1 and then included in the principal component analysis.
10 evidence from the analysis shows that improvements in these areas will help firms to reach to their full potentials.
Access to finance is perceived as the single most severe obstacle by firms of all sizes (see Figure 2). Especially the medium size firms are the most constrained group of firms. The stringency of labor regulations which could be a quite distortive for growth, rank relatively low among firms’ concerns. It is cited as the most severe obstacle by only 4 percent of medium size firms. Several other indicators in the survey confirm that SMEs in Turkey are dependent on bank finance. Turkish firms are more dependent than their peers in other countries on bank finance to fund their investments in fixed assets16. This is especially true for medium size firms, for which bank finance accounts for 47 percent of total funding. However when compared to micro and large firms, applications of SMEs for bank credit are faced with onerous collateral requirements and high rejection rates. Small and medium size firms are required 100 and 91 percent of loan value as collateral in respective order (see Figure 3). Notwithstanding the higher collateral requirements, the amount of rejected loan applications is also substantially higher for SMEs (17 percent) compared to more creditworthy large firms (12 percent).
In Turkey, there are several organizations that address the financial bottlenecks to the expansion of SMEs. Organizations such as the Small and Medium Scale Enterprises Development Organization (KOSGEB), the Credit Guarantee Fund (KGF), and the union of Chambers and Commodity Exchanges of Turkey (TOBB) provide financial and/or non‐financial assistance for development of SMEs. However many SMEs are either not aware of alternative financial sources that are available to them or they have difficulties in accessing these sources. Hence expanding the reach of support schemes of these organizations would lead to significant improvements in the growth prospects of SMEs in Turkey.
11
8.
References
Aterido, Reyes, Mary Hallward‐Driemeier, Carmen Pages (2009), “Big Constraints to Small Firms’ Growth? Business Environment and Employment Growth across Firms,” World Bank Policy Research Working Paper No: 5032.
Beck, Thorsten, Asli Demirgüç‐Kunt and Vojislav Maksimovic. 2005. “Financial and Legal Constraints to Growth: Does Firm Size Matter?” Journal of Finance 60(1): 131‐177
Cooley, Thomas F. and Vincenzo Quadrini (2001), "Financial Markets and Firm Dynamics," American Economic Review, 91(5):1287‐1310.
Dunne, Timothy, Mark J. Roberts, Larry Samuelson (1989),”The Growth and Failure of U.S. Manufacturing Plants,” The Quarterly Journal of Economics, Vol. 104, No.4, pp.671‐698.
Evans, David S. (1987a), “The Relationship between Firm Growth, Size, and Age: Estimates for 100 Manufacturing Industries,” Journal of Industrial Economics, Vol. 35, pp.567‐82.
____ (1987b), “Tests of Alternative Theories of Firm Growth,” Journal of Political Economy, Vol. 95, pp.657‐74
Gauthier, Bernard and Mark Gersovitz (1997), “Revenue Erosion through Exemption and Evasion in Cameroon 1993,” Journal of Public Economics, Vol.64, pp.407‐24.
Jovanovic, Boyan (1982), "Selection and the Evolution of Industry," Econometrica, 50(7): 649‐67
Klepper, Steven and Peter Thompson (2007), "Submarkets and the Evolution of Market Structure," Rand Journal of Economics, 34(4):862‐888.
Klette, Tor J, and Samuel S. Kortum (2004), "Innovating Firms and Aggregate Innovation," Journal of Political Economy, 112(5):986‐1018.
Sleuwaegen, Leo and Micheline Goedhuys (2002), ”Growth of Firms in Developing Countries, Evidence from Cote d’Ivoire,” Journal of Development Economics, Vol. 68, pp.117‐35.
Van Biesebroeck, Johannes (2005), “Firm size matters: growth and productivity growth in African manufacturing,” Economic Development and Cultural Change, Vol. 53(3), pp.545– 83.
World Bank (2010), Investment Climate Assessment of Turkey. Washington DC.
12
9.
Appendix
Figure 1 Percentage of Firms that are above 16 years old
Figure 2 Single Most Severe Investment Climate Obstacles, by Firm Size
26 5 1 1 11 10 31 9 19 2 9 13 60 19 25 15 20 25 49 48 62 20 32 46 0 10 20 30 40 50 60 70
Turkey
Russia
Ukraine
Romania
EU10
All
ECA
Micro
Small
Medium
Large
26.3 19.5 19.1 15.3 4.8 1.7 1.3 0.2 3.8 2.1 3.0 24.2 19.4 17.7 14.6 10.6 3.3 2.9 2.6 2.2 0.9 0.6 33.6 14.1 13.3 13.1 7.5 2.6 1.2 3.9 4.5 0.2 4.3 18.6 11.8 18.5 14.9 24.7 0.9 1.0 2.8 2.0 0.2 1.6 0 5 10 15 20 25 30 35 40 Access to finance
Tax rates Political
instability Informal competition Inadequately educated workforce Business licensing and permits
Corruption Customs and
trade
regulations
Electricity Transport Labor
regulations
13
Figure 3 Value of Collateral as % of Loan Value
Table 1 Data Details
Size and Age Distribution ‐ All Firms Employ\Age 1‐5 6‐15 ≥16 Total Micro 0.30 0.42 0.28 206 Small 0.18 0.48 0.33 374 Medium 0.09 0.38 0.53 223 Large 0.05 0.38 0.57 111 Total 155 395 364 914 Size and Age Distribution ‐ Panel Only Employ\Age 1‐5 6‐15 ≥16 Total Micro 0.18 0.42 0.40 60 Small 0.15 0.48 0.37 158 Medium 0.09 0.36 0.55 139 Large 0.03 0.29 0.68 62 Total 50 169 200 419 76 100 91 70 0 20 40 60 80 100 120
14 Table 2 Proportion of Firms in Industries Included in the Survey
2 Digit Industries Micro Small Medium Large Total
Food 0.22 0.42 0.26 0.10 130 Textiles 0.07 0.30 0.35 0.28 149 Garments 0.13 0.38 0.35 0.15 96 Chemicals 0.26 0.44 0.22 0.07 95 Plastics & rubber 0.19 0.37 0.33 0.11 27 Non metallic mineral 0.28 0.49 0.22 0.01 83 Basic metals 0.23 0.38 0.31 0.08 13 Fabricated metal products 0.23 0.57 0.10 0.10 30 Machinery and equipment 0.34 0.28 0.28 0.09 32 Electronics (31 & 32) 0.33 0.11 0.44 0.11 9 Services of motor vehicles 0.39 0.45 0.03 0.13 31 Wholesale 0.32 0.57 0.09 0.02 53 Retail 0.38 0.33 0.13 0.16 93 Others* 0.13 0.53 0.25 0.09 68 Total 208 375 223 114 920
* Other industries include Other manufacturing, IT and Transportation Section
Table 3 Proportion of Firms in Regions Included in the Survey
Regions Micro Small Medium Large Total
Marmara 0.14 0.39 0.28 0.19 334
Aegean 0.18 0.39 0.29 0.14 156
Central Anatolia 0.28 0.39 0.26 0.08 145
South 0.29 0.45 0.19 0.07 196
Black Sea ‐ Eastern 0.40 0.44 0.12 0.03 89
Total 208 375 223 114 920
Table 4 Growth Rates of Firms at Different Size and Age Groups ALL DATA Growth\Age 1‐5 6‐15 ≥16 Total Micro 0.29 0.14 0.14 0.18 Small 0.14 0.02 ‐0.02 0.03 Medium 0.00 0.03 0.01 0.02 Large 0.26 0.14 ‐0.04 0.06
PANEL FIRMS ONLY
Growth\Age 1‐5 6‐15 ≥16 Total
Micro 0.22 0.13 0.24 0.19
Small ‐0.02 0.02 0.03 0.02
Medium ‐0.31 ‐0.08 ‐0.05 ‐0.08
15
Table 5 Growth Rates of Firms in Industries
2 Digit Industry Micro Small Medium Large
Food 0.12 0.01 0.05 0.08 Textiles 0.17 0.09 0.01 0.00 Garments 0.04 0.07 ‐0.11 0.00 Chemicals 0.13 0.07 ‐0.03 ‐0.12 Plastics & rubber 0.26 ‐0.05 0.05 ‐0.01 Non metallic mineral 0.02 0.05 0.10 0.00 Basic metals 0.09 0.06 0.19 0.17 Fabricated metal products 0.18 0.06 0.05 0.03 Machinery and equipment 0.20 ‐0.09 0.10 0.16 Electronics 0.27 0.01 0.02 ‐0.34 Services of motor vehicles 0.13 0.10 0.71 0.10 Wholesale 0.12 ‐0.03 0.13 0.59 Retail 0.21 0.03 0.11 0.28
Table 6 Growth Rates of Firms in Regions
Regions Micro Small Medium Large Total
Marmara 0.21 0.01 ‐0.01 0.05 0.08 Aegean 0.06 0.03 ‐0.02 ‐0.04 0.02 Central Anatolia 0.14 ‐0.01 0.10 0.15 0.07 South 0.22 0.14 0.06 0.03 0.16 Black Sea ‐ Eastern 0.15 0.03 0.08 0.06 0.11
16
Table 7 Regression of Employment Growth Rates
All Data Panel Firms Small (10‐50) ‐0.14 ‐0.149 (0.039)*** (0.083)* Medium (51‐250) ‐0.155 ‐0.233 (0.033)*** (0.068)*** Large (≥251) ‐0.114 ‐0.191 (0.060)* (0.079)** Age ‐0.003 0.002 (0.001)** (0.002) Foreign ‐0.032 0.02 (0.072) (0.096) Govt 0.037 0.23 (0.045) (0.041)*** Exporter 0.018 ‐0.047 (0.033) (0.052) Const 0.321 0.184 (0.089)*** (0.125) Obs 668 416 R2 0.201 0.144
Robust standard errors which are given in parentheses are clustered by
region and 2‐digit industry for all data and by 2‐digit industry for the panel
data. Additionally control for 2‐digit industry and region fixed effects. ***
p<0.01, ** p<0.05, * p<0.1.
Table 8 Fraction of Firms in Each Size‐Age Cell in Comparator Countries
Turkey Russia
Employ\Age 1‐5 6‐15 >=16 Total Employ\Age 1‐5 6‐15 >=16 Total
Micro 0.29 0.45 0.26 16,572 Micro 0.37 0.58 0.05 19,554 Small 0.15 0.54 0.31 17,710 Small 0.28 0.63 0.09 28,318 Medium 0.09 0.31 0.60 5,065 Medium 0.08 0.73 0.19 21,734 Large 0.06 0.45 0.49 1,932 Large 0.02 0.50 0.48 7,387 Total 7,945 19,511 13,822 41,279 Total 17,258 48,659 11,077 76,994 Ukraine Poland
Employ\Age 1‐5 6‐15 >=16 Total Employ\Age 1‐5 6‐15 >=16 Total
Micro 0.36 0.63 0.01 20,933 <=10 0.09 0.63 0.28 34,911
Small 0.24 0.58 0.19 16,489 11‐50 0.05 0.62 0.32 15,928
Medium 0.15 0.60 0.25 4,887 51‐249 0.04 0.46 0.50 5,920
Large 0.10 0.28 0.62 1,920 >=250 0.13 0.56 0.31 1,176
17
Romania All ECA
Employ\Age 1‐5 6‐15 >=16 Total Employ\Age 1‐5 6‐15 >=16 Total
Micro 0.36 0.63 0.01 26,556 Micro 0.25 0.64 0.10 269,735 Small 0.17 0.81 0.02 20,608 Small 0.19 0.68 0.13 225,957 Medium 0.11 0.73 0.15 5,195 Medium 0.11 0.63 0.25 76,951 Large 0.31 0.49 0.20 1,010 Large 0.09 0.45 0.46 20,678 Total 13,944 37,720 1,706 53,370 Total 121,983 384,250 87,087 593,320 EU8 EU10
Employ\Age 1‐5 6‐15 >=16 Total Employ\Age 1‐5 6‐15 >=16 Total
Micro 0.18 0.69 0.13 124,967 Micro 0.21 0.68 0.11 166,805 Small 0.18 0.71 0.11 88,097 Small 0.18 0.73 0.09 121,066 Medium 0.11 0.67 0.21 25,969 Medium 0.12 0.68 0.20 32,964 Large 0.17 0.48 0.35 4,501 Large 0.18 0.50 0.32 5,938 Total 42,038 167,904 33,592 243,534 Total 61,424 227,221 38,128 326,773
Table 9 Firm Growth in Comparator Countries
Russia Poland Ukraine Romania All_ECA EU8 EU10 Turkey
Small ‐0.068 ‐0.069 ‐0.094 ‐0.085 ‐0.058 ‐0.057 ‐0.058 ‐0.14 (0.024)*** (0.021)*** (0.023)*** (0.023)*** (0.011)*** (0.019)*** (0.016)*** (0.039)*** Medium ‐0.069 ‐0.058 ‐0.088 ‐0.070 ‐0.059 ‐0.053 ‐0.052 ‐0.155 (0.017)*** (0.020)*** (0.032)*** (0.047) (0.011)*** (0.019)*** (0.017)*** (0.033)*** Large ‐0.075 ‐0.094 ‐0.122 ‐0.165 ‐0.071 ‐0.059 ‐0.071 ‐0.114 (0.023)*** (0.037)** (0.041)*** (0.053)*** (0.017)*** (0.037) (0.031)** (0.060)* Age ‐0.003 ‐0.001 ‐0.001 ‐0.003 ‐0.002 ‐0.002 ‐0.002 ‐0.003 (0.000)*** (0.001) (0.001) (0.001)*** (0.000)*** (0.001)*** (0.001)*** (0.001)** Foreign 0.378 ‐0.003 0.046 ‐0.126 0.014 0.014 0.012 ‐0.032 (0.108)*** (0.024) (0.053) (0.097) (0.015) (0.017) (0.020) (0.072) Gov_Own 0.059 ‐0.026 0.157 0.121 ‐0.010 ‐0.026 ‐0.019 0.037 (0.072) (0.029) (0.059)** (0.105) (0.018) (0.041) (0.037) (0.045) Exporter ‐0.048 0.044 0.029 ‐0.053 0.022 0.036 0.028 0.018 (0.040) (0.027) (0.023) (0.072) (0.011)** (0.016)** (0.015)* (0.033) Const 0.115 0.095 0.075 0.211 0.107 0.067 0.072 0.321 (0.037)*** (0.039)** (0.054) (0.041)*** (0.033)*** (0.050) (0.031)** (0.089)*** Obs 754 248 622 288 7392 1452 1918 668 R2 0.249 0.150 0.250 0.193 0.113 0.120 0.113 0.201
Robust standard errors clustered by region and 2‐digit industry are in parentheses. Additionally control for 2‐digit industry and
region fixed effects. Regressions for EU8, EU10 and All_ECA include controls for countries. *** p<0.01, ** p<0.05, * p<0.1.
18
Table 10 How Firms in Turkey Differ from the Firms in Comparator Countries in Their Growth Rates
Russia Poland Ukraine Romania All_ECA EU8 EU10
Small ‐0.073 ‐0.059 ‐0.077 ‐0.077 ‐0.055 ‐0.056 ‐0.057 (0.025)*** (0.022)*** (0.023)*** (0.021)*** (0.011)*** (0.019)*** (0.016)*** Medium ‐0.058 ‐0.038 ‐0.066 ‐0.064 ‐0.056 ‐0.051 ‐0.050 (0.022)*** (0.022)* (0.032)** (0.042) (0.012)*** (0.019)*** (0.017)*** Large ‐0.063 ‐0.088 ‐0.068 ‐0.182 ‐0.069 ‐0.058 ‐0.071 (0.024)*** (0.040)** (0.037)* (0.049)*** (0.017)*** (0.036) (0.031)** Small*Turkey ‐0.085 ‐0.098 ‐0.088 ‐0.076 ‐0.108 ‐0.106 ‐0.098 (0.039)** (0.036)*** (0.036)** (0.035)** (0.031)*** (0.035)*** (0.034)*** Medium*Turkey ‐0.112 ‐0.127 ‐0.107 ‐0.077 ‐0.119 ‐0.124 ‐0.113 (0.041)*** (0.035)*** (0.042)** (0.049) (0.031)*** (0.034)*** (0.033)*** Large*Turkey ‐0.081 ‐0.048 ‐0.074 0.069 ‐0.073 ‐0.083 ‐0.060 (0.048)* (0.057) (0.050) (0.063) (0.045) (0.055) (0.052) Turkey 0.037 0.148 0.109 0.073 0.068 0.120 0.109 (0.046) (0.032)*** (0.032)*** (0.034)** (0.037)* (0.033)*** (0.033)*** Constant 0.103 0.111 0.061 0.190 0.105 0.064 0.075 (0.037)*** (0.025)*** (0.045) (0.032)*** (0.033)*** (0.052) (0.030)** Obs 1594 1088 1462 1128 7392 2292 2758 R2 0.188 0.191 0.187 0.188 0.117 0.130 0.121
Robust standard errors clustered by region and 2‐digit industry are in parentheses. Additionally control for foreign and
government ownership, age, export status, 2‐digit industry, and region fixed effects. Regressions for EU8, EU10 and
All_ECA include controls for countries. *** p<0.01, ** p<0.05, * p<0.1.
19
Table 11 Investment Climate Variables Used in the Analysis
Investment Climate Variables Finance External Fin % of investments financed externally Collateral Value of collateral required as a % of loan value or value of line of credit Sales on Credit % of sales of goods or services that are sold on credit Overdraft (y/n) % of firms with an overdraft facility Purch on Credit (y/n) % of firms purchasing material or service on credit Purch on Credit % of purchases of materials that are bought on credit Line of credit (y/n) % of firms with a line of credit or loan from a financial institution Infrastructure Dur PowOut Duration of power outages (hrs) Loss PowOut Loss from power outages as a % of annual sales Power out (y/n) % of firms that had a power outage # PowOut # of power outages Regulations Tax Inspect # of meetings or inspections with tax officials Time Tax % of time spent with government regulation Days to Export # of days to clear exports customs Days to Import # of days to clear imports customs Inspections Total number of inspections Days for Inspect # of days spent by staff members dealing with procedures related to inspections Operating License # days waited to get an operating license Certificate # of days waited to get compulsory certificate Permits # of days waited to get permit Labor Reg % of firms that find labor regulations major or very severe obstacle for to their current operations
Training and Others
Training (y/n) % of firms having formal training NonProd Train % of nonproduction workers trained Prod Train % of production workers trained Infor Pay % of sales paid as informal payments Comp Informal (y/n) % of firms competing against unregistered or informal firms
20
Table 12 Firm Size Growth and Investment Climate Variables
IC Variable Used Smallt‐3 Mediumt‐3 Larget‐3 Aget‐3 IC Vart Const Obs R2
External Fin ‐0.13 ‐0.152 ‐0.113 ‐0.003 0.003 0.316 668 0.21 (0.040)*** (0.032)*** (0.060)* (0.001)** (0.001)** (0.090)*** Collateral ‐0.10 ‐0.156 ‐0.153 ‐0.005 ‐0.001 0.475 219 0.35 0.102 (0.092)* 0.127 0.004 0.001 (0.129)*** Sales on Credit ‐0.14 ‐0.157 ‐0.114 ‐0.003 0.000 0.333 660 0.20 (0.039)*** (0.033)*** (0.060)* (0.001)** 0.002 (0.150)** Overdraft (y/n) ‐0.137 ‐0.154 ‐0.11 ‐0.003 ‐0.144 0.348 656 0.21 (0.040)*** (0.033)*** (0.062)* (0.001)** 0.122 (0.076)*** Line of credit (y/n) ‐0.145 ‐0.163 ‐0.125 ‐0.003 0.334 0.216 665 0.22 (0.039)*** (0.034)*** (0.064)* (0.001)** (0.079)*** (0.087)** Loss PowOut ‐0.218 ‐0.266 ‐0.22 0.000 0.003 0.272 223 0.33 (0.094)** (0.073)*** (0.081)*** 0.002 0.006 0.204 Infor Pay ‐0.157 ‐0.167 ‐0.096 ‐0.003 0.029 0.281 551 0.23 (0.044)*** (0.041)*** (0.053)* (0.001)** 0.024 (0.084)*** Tax Inspect ‐0.195 ‐0.199 ‐0.155 ‐0.004 0.000 0.525 324 0.30 (0.084)** (0.057)*** (0.084)* (0.001)*** ‐0.001 (0.133)*** Time Tax ‐0.116 ‐0.123 ‐0.086 ‐0.003 0.002 0.207 617 0.18 (0.037)*** (0.032)*** 0.063 (0.001)** ‐0.002 (0.104)* Days to Export ‐0.171 ‐0.247 ‐0.229 ‐0.004 0.010 0.316 336 0.38 0.13 (0.114)** 0.138 (0.002)** (0.004)** (0.112)*** Days to Import ‐0.379 ‐0.489 ‐0.501 ‐0.005 0.002 0.414 208 0.52 (0.142)** (0.125)*** (0.122)*** (0.002)** 0.003 (0.139)*** Inspections ‐0.13 ‐0.159 ‐0.121 ‐0.003 ‐0.005 0.253 636 0.19 (0.043)*** (0.037)*** (0.063)* (0.001)** 0.003 (0.065)*** Robust standard errors clustered by region and 2‐digit industry are in parentheses. Additionally control for foreign and government ownership, export status, 2‐digit industry, and region fixed effects. *** p<0.01, ** p<0.05, * p<0.1.
21
Table 13 Firm Size Growth and Investment Climate Variables with Interactions (All Data)
IC Variable Small Medium Large IC IC*Small IC*Medium IC*Large Const Obs R2
External Fin ‐0.031 ‐0.223 ‐0.149 0.004 ‐0.005 0.003 0.002 0.158 668 0.23 0.078 (0.089)** (0.082)* (0.002)* 0.004 0.004 0.004 (0.074)** Collateral ‐0.086 ‐0.244 ‐0.044 ‐0.001 0.000 0.001 ‐0.001 0.086 219 0.35 0.196 0.168 0.208 0.001 0.001 0.001 0.001 0.219 Sales on Credit ‐0.251 0.015 0.32 0.000 0.002 ‐0.002 ‐0.006 0.319 660 0.21 0.196 0.232 0.234 0.003 0.003 0.003 (0.004)* (0.175)* Overdraft (y/n) ‐0.112 ‐0.426 ‐0.32 ‐0.161 ‐0.038 0.382 0.286 0.352 656 0.21 0.132 0.28 0.265 0.168 0.196 0.387 0.412 (0.103)*** Line of credit 0.261 0.019 0.378 0.783 ‐0.629 ‐0.294 ‐0.79 ‐0.105 665 0.24 0.185 0.165 0.236 (0.252)*** (0.320)* 0.262 (0.413)* 0.163 Loss PowOut ‐0.263 ‐0.362 ‐0.255 ‐0.001 0.01 0.023 0.007 0.165 223 0.33 (0.119)** (0.109)*** (0.117)** 0.009 0.015 0.019 0.019 0.11 Infor Pay ‐0.054 ‐0.133 0.006 0.14 ‐0.171 ‐0.08 ‐0.196 0.226 551 0.28 0.036 (0.054)** 0.051 (0.051)*** (0.059)*** 0.048 (0.052)*** (0.085)*** Tax Inspect ‐0.193 ‐0.2 ‐0.148 0.000 0.000 0.000 ‐0.002 0.524 324 0.31 (0.088)** (0.058)*** (0.087)* 0.001 0.001 0.001 (0.001)** (0.135)*** Time Tax ‐0.094 ‐0.109 0.338 0.003 ‐0.001 ‐0.001 ‐0.015 0.174 617 0.19 0.095 0.136 0.216 0.003 0.003 0.005 (0.007)** 0.132 Days to Export ‐0.095 ‐0.237 ‐0.162 0.016 ‐0.013 ‐0.001 ‐0.012 0.296 336 0.39 0.171 0.151 0.181 0.012 0.012 0.011 0.013 (0.121)** Days to Import ‐0.606 ‐0.796 ‐0.903 ‐0.025 0.025 0.032 0.045 0.885 208 0.55 (0.218)*** (0.198)*** (0.212)*** (0.013)* (0.014)* (0.015)** (0.017)** (0.194)*** Inspections ‐0.111 ‐0.162 ‐0.09 0.003 ‐0.008 0.001 ‐0.013 0.236 636 0.19 (0.054)** (0.056)*** 0.095 0.016 0.015 0.017 0.024 (0.070)***
Robust standard errors clustered by region and 2‐digit industry are in parentheses. Control for foreign and government ownership,
export status, 2‐digit industry, and region fixed effects. *** p<0.01, ** p<0.05 p<0.1
22
Table 14 Effects of IC Variables on Firm Growth – Panel Firms
Small Medium Large Age IC Const Obs RSqr
External Fin ‐0.149 ‐0.233 ‐0.19 0.002 0.000 0.196 416 0.14 (0.084)* (0.067)*** (0.079)** (0.002) (0.001) (0.100)* Collateral ‐0.177 ‐0.235 ‐0.098 0.002 0.000 0.212 116 0.51 (0.067)** (0.043)*** (0.040)** (0.002) (0.000)** (0.101)* Sales on Credit ‐0.148 ‐0.233 ‐0.19 0.002 ‐0.001 0.232 414 0.15 (0.084)* (0.067)*** (0.080)** (0.002) (0.000) (0.142) Overdraft (y/n) ‐0.143 ‐0.241 ‐0.207 0.002 0.048 0.127 416 0.15 (0.081)* (0.068)*** (0.082)** (0.002) (0.039) (0.110) Line of credit (y/n) ‐0.143 ‐0.241 ‐0.207 0.002 0.048 0.127 416 0.15 (0.081)* (0.068)*** (0.082)** (0.002) (0.039) (0.110) Loss PowOut ‐0.202 ‐0.343 ‐0.276 0.003 0.004 0.171 308 0.22 (0.080)** (0.071)*** (0.080)*** (0.003) (0.002) (0.143) Infor Pay ‐0.15 ‐0.23 ‐0.208 0.002 ‐0.001 0.205 368 0.15 (0.089) (0.073)*** (0.089)** (0.002) (0.003) (0.145) Tax Inspect ‐0.145 ‐0.23 ‐0.2 0.002 0.001 0.175 406 0.14 (0.087) (0.070)*** (0.083)** (0.002) (0.002) (0.079)** Time Tax ‐0.144 ‐0.241 ‐0.202 0.003 0.001 0.198 403 0.14 (0.088) (0.077)*** (0.082)** (0.002) (0.001) (0.121) Days to Export ‐0.111 ‐0.295 ‐0.188 0.003 ‐0.008 0.25 201 0.27 (0.049)** (0.139)* (0.111) (0.001)** (0.002)*** (0.085)** Days to Import ‐0.065 ‐0.091 ‐0.027 0.001 ‐0.004 1.405 139 0.37 (0.095) (0.133) (0.097) (0.002) (0.002)** (0.128)*** Robust standard errors clustered by region and 2‐digit industry are in parentheses. Control for foreign and government ownership, export status, 2‐digit industry, and region fixed effects. *** p<0.01, ** p<0.05 p<0.1
23
Table 15 Employment Growth with Three Size Groups
(1) (2) Medium (20‐99) ‐0.097 ‐0.103 (0.032)*** (0.031)*** Large (≥100) ‐0.085 ‐0.088 (0.043)* (0.044)** Age ‐0.003 ‐0.003 (0.001)** (0.001)** External Fin 0.004 (0.001)*** Line of credit (y/n) 0.311 (0.073)*** Constant 0.197 0.09 (0.084)** ‐0.081 Observations 668 665 R‐squared 0.188 0.185 Robust standard errors clustered by region and 2‐digit industry are in parentheses. Additionally control for foreign and government ownership, export status, 2‐digit industry, and region fixed effects. *** p<0.01, ** p<0.05, * p<0.1.
24
Table 16 How Constraining Labor Regulations Are?
Basic Interaction Smallt‐3 ‐0.131 ‐0.167 (0.040)*** (0.070)** Mediumt‐3 ‐0.148 ‐0.122 (0.034)*** (0.052)** Larget‐3 ‐0.107 ‐0.098 (0.060)* (0.089) Aget‐3 ‐0.003 ‐0.003 (0.001)** (0.001)** Foreign ‐0.033 ‐0.024 (0.072) (0.070) Govt 0.038 0.025 (0.042) (0.044) Exporter 0.018 0.014 (0.033) (0.032) LaborReg 0.414 0.230 (0.195)** (0.378) LaborReg*Small 0.457 (0.466) LaborReg*Medium ‐0.238 (0.431) LaborReg*Large ‐0.076 (0.555) Constant 0.170 0.181 (0.085)* (0.093)* Obs 668 668 R2 0.214 0.220 Robust standard errors clustered by region and 2‐digit industry are in parentheses. Additionally control for 2‐digit industry and region fixed effects. *** p<0.01, ** p<0.05, * p<0.1.
25
Table 17 Growth Rates with Principal Component Method
(1) (2) Small ‐0.163 ‐0.177 (0.075)** (0.145) Medium ‐0.135 ‐0.249 (0.055)** (0.103)** Large ‐0.159 ‐0.253 (0.097) (0.159) Age ‐0.004 ‐0.004 (0.002)** (0.005) Principal Comp without Collateral 0.06 (0.020)*** Principal Comp with Collateral 0.067 (0.029)** Constant 0.304 0.002 (0.115)** (0.191) Obs 419 170 R2 0.248 0.435
Robust standard errors clustered by region and 2‐digit industry are in
parentheses. Additionally control for foreign and government ownership, export
status, 2‐digit industry, and region fixed effects. *** p<0.01, ** p<0.05, * p<0.1.
26
Table 18 List of Countries in East Europe and Central Asia Region
Country # of Observations % of Total
Albania 175 1.55 Belarus 273 2.41 Georgia 373 3.3 Tajikistan 360 3.18 Turkey 1,152 10.19 Ukraine 851 7.53 Uzbekistan 366 3.24 Russia 1,004 8.88 Poland 455 4.02 Romania 541 4.79 Serbia 388 3.43 Kazakhstan 544 4.81 Moldova 363 3.21 Bosnia 361 3.19 Azerbaijan 380 3.36 FYROM 366 3.24 Armenia 374 3.31 Kyrgyzstan 235 2.08 Estonia 273 2.41 Kosovo 270 2.39 Czech 250 2.21 Hungary 291 2.57 Latvia 271 2.4 Lithuania 276 2.44 Slovakia 275 2.43 Slovenia 276 2.44 Bulgaria 288 2.55 Croatia 159 1.41 Montenegro 116 1.03 Total 11,306 100