Introduction
Broadly speaking, there are three types of wholesalers in the food industry. Merchant wholesalers typically buy and resell food (primarily from a variety of manu-facturers), assemble it for distribution, load it onto trucks, and deliver it to retailers, food service estab-lishments, government, or the export market, making profits on the services they provide. They also may purchase grocery items from, or deliver to, other wholesalers. Merchant wholesalers account for over half of all grocery and related product sales, which reached $589 billion in 1997 (fig. 2-1).1The remain-der of wholesale sales is accounted for by manufactur-ers’ sales branches and offices (MSBO) (25 percent), and agents and brokers (19 percent). MSBOs are maintained by manufacturers, apart from their plants, to market their products at wholesale. Branches carry inventory, while offices do not. Agents and brokers buy or sell goods owned by others on commission. Grocery wholesalers are also classified by the type of products they handle. Specialty wholesalers might spe-cialize in dairy, poultry, meats, or fresh fruits/vegeta-bles, and they account for most wholesale sales (fig. 2-2). Of these, distributors of packaged frozen foods, meats, and fresh produce lead in sales value (fig. 2-3). Miscellaneous wholesalers primarily
distrib-ute products such as coffee, baked goods, soft drinks, and canned goods; general line distributors sell a broad range of dry groceries, perishable food products, and nonfood products found in grocery stores.
Distribution Channels to Retail
Food Stores
Retail food stores buy approximately 40 percent of wholesalers’ grocery and related products (fig. 2-4). Another 25 percent is sold to other wholesalers.2From
Food Wholesaling
Steve W. Martinez
The food wholesaling sector continues to enjoy steady growth in sales and undergo concentration through acquisitions. Merchant food wholesalers work with proces-sors to distribute products to retailers and food service establishments. As their cus-tomer base continues to shrink due to rapid consolidation by supermarket chains, many broadline merchant distributors to retail food stores continue to acquire retail operations. Concentration has also become international in scope as companies from outside the United States purchase U.S. food wholesalers.
Figure 2-1
Total wholesale sales by type of wholesaler, 1997
Source: Bureau of the Census, Census of Wholesale Trade, 1997, U.S. Department of Commerce.
Merchants—56% Manufacturers'
sales branches and offices—25% Agents and brokers—19%
($589 billion)
1 The U.S. Census Bureau double-counts wholesale sales to other
wholesalers. Product sales are counted once when sold to another wholesaler and counted again when the wholesaler resells the products to a retailer. In 1997, sales of grocery and related prod-ucts to retail food outlets and food service establishments account-ed for 62 percent of total wholesale sales of grocery and relataccount-ed products, or $365 billion.
2Other wholesalers include small specialty wholesalers who tend
to purchase product from larger wholesalers rather than directly from manufacturers (Kaufman et al., 2000).
1992 to 1997, sales to retail stores declined as a per-centage of total wholesale sales, perhaps due to inte-gration by retailers into wholesaling and the growing importance of the food service sector.3
Distribution to retail food stores (excluding brokers) can be classified into merchant, or third-party
whole-salers (for example Supervalu, Fleming, Nash Finch), direct-store delivery (DSD), and self-distributing retailers. Nontraditional relationships between whole-salers and retailers are becoming increasingly impor-tant (Kinsey, 1999). Self-distributing retailers—includ-ing Kroger, Albertsons, Wal-Mart, Safeway, Ahold, and a number of smaller grocery chains—own their own distribution facilities.4Manufacturers deliver product directly to these retailers’ distribution centers. Self-distributing retailers account for about 34 percent of all food distribution centers in the United States (Kinsey, 2001).
As consolidation continues in food retailing (see “Food Retailing” chapter), retail chains with their own distribution centers will become more prevalent. This arrangement reduces labor and nonlabor expenses. Self-distributing retailers move more cases of produce per hour in their warehouses than do traditional whole-salers, so their operating costs as a proportion of sales are lower compared with traditional merchant whole-salers (Kinsey, 1999). In 1999, 47 of the 50 largest food retailers were self-distributors.
While self-distributing food retailers manage invento-ries more efficiently, there remains a role for tradition-al third-party wholestradition-alers, who account for 38 percent of wholesale distribution to retail food stores. For example, they service niche retailers with specialty
Figure 2-2
Wholesale sales by type of products handled, 1997
Source: Bureau of the Census, Census of Wholesale Trade, 1997, U.S. Department of Commerce.
Miscellaneous—32%
General line—25% Specialty—43%
Figure 2-3
Specialty wholesale sales by type of product, 1997
Source: Bureau of the Census, Census of Wholesale Trade, 1997, U.S. Department of Commerce.
Dairy—14%
Fresh fruit & vegetables—18% All other—16%
Poultry—5%
Meat—20% Packaged
frozen food—27%
3While the food service outlets compete with retail food stores for
the consumer’s food dollar, food service wholesalers, such as Sysco and U.S. Foodservice, do not compete directly with retail food wholesalers, such as Supervalu and Nash Finch.
Figure 2-4
Food wholesale sales by type of customer
Percent
Exports Retailers Government 0 10 20 30 40 50 Food service Other wholesalers Other 1992 1997
Source: Bureau of the Census, Census of Wholesale Trade, 1992 and 1997, Miscellaneous Subjects, U.S. Department of Commerce.
4Apparently, the U.S. Census Bureau classifies distribution
facili-ties of self-distributing retailers as auxiliaries, not wholesale estab-lishments (U.S. Department of Commerce, 2002).
foods, unique displays, and a wide variety of conven-ience foods (Kinsey, 2000). Unified Western Grocers, the tenth largest U.S. broadline food wholesaler, acquired a specialty wholesaler to meet the needs of retailers catering to growing Asian and Hispanic com-munities in California (Veiders).
Manufacturers that deliver their own products to indi-vidual stores, and usually arrange it on the shelves for retailers (DSD), account for the remaining distribution to retail food stores (28 percent). These companies usually strongly advocate scan-based trading (Kinsey, 1998, 2000). Here, retailers are not billed by manufac-turers until after the good is scanned and sold to the consumer. This gives the manufacturers—such as Coca Cola, Dreyers/Edy’s Grand Ice Cream, and Frito-Lay—direct and immediate access to sales information so that stocks can be replenished quickly (Kinsey, 1999). These manufacturers deliver food products that typically have a relatively short shelf life, such as bev-erages, sweet/salty snacks, bread, and ice cream. This makes efficient delivery of fresh product doubly cru-cial. In this arrangement, retailers do not own the
products until they are sold, so their money is not tied up in slow-moving inventory.
Distribution Channels for
Food Service
5Food service outlets buy over 20 percent of whole-salers’ grocery and related products (fig. 2-4).
Distribution channels to restaurants and other food serv-ice establishments can be classified as broadliners, sys-tems distributors, and specialty distributors. Broadliners (for example, Sysco and U.S. Foodservice), who account for half of U.S. food service distribution sales, serve a diverse customer base consisting of single estab-lishments and small chains (Kinsey, 2001). Broadliners offer one-stop shopping by carrying a wide range of food, equipment, and supplies.
Specialty distributors (for example, Costco, McLane, Smart & Final) focus on a product (dairy, meat) or a customer segment (airlines, convenience stores), or may
Wholesale Sector Definitions
Grocery and related product wholesaling: Part of
the food system in which goods are assembled, stored, and transported to retailers, food service organizations (hotels, restaurants, and institutions (HRI)), other wholesalers, export, and other types of businesses. Institutions include schools, prisons, and other government operations.
Merchant wholesalers: Operators of firms primarily
engaged in buying groceries and grocery products, and reselling to retailers, institutions, and other businesses.
Manufacturers’ sales branches and offices:
Wholesale operations maintained by grocery manufac-turers or processors to market their own products. Manufacturers’ sales branches carry stocks of merchan-dise for delivery to customers. Manufacturers’sales offices do not stock merchandise for sale.
Brokers and agents: Wholesale operators who buy or
sell as representatives of others for a commission and typically do not physically handle the products. They may serve as representatives of manufacturers or processors, but normally do not take title to the goods.
General line or broadline distributors: Merchant
wholesale operators that handle a broad line of gro-ceries, health and beauty aids, household products. Also referred to as general-line and full-line dis-tributors. Examples include Supervalu, Fleming, and Sysco.
Specialty wholesalers: Establishments primarily
engaged in the wholesale distribution of items such as frozen foods, bakery, dairy products, poultry prod-ucts, fish, meat and meat prodprod-ucts, or fresh fruits and vegetables.
Miscellaneous food wholesalers: Establishments
specializing in the wholesale distribution of a narrow range of dry groceries such as canned foods, coffee, tea, or spices. Also referred to as systems distributors.
Warehouse clubs: A hybrid wholesaler and retailer
that sells food, appliances, hardware, office supplies, and similar products to members (both individuals and small businesses) at prices slightly above whole-sale. Examples include Sam’s, BJ’s, and Costco.
be warehouse clubs or cash-and-carry establishments. These distributors, accounting for a third of food service sales, often serve niches that require specialized knowl-edge in product sourcing, handling, or service.
Systems distributors (for example, AmeriServe/McLane, Martin Brower) account for 17 percent of food service distribution sales and serve multi-unit customers and large chains by offering low-cost, reliable delivery serv-ices. They may also serve convenience stores, hospitals, and hotels and typically carry low inventory and have low overheads. While systems distributors operate on lower margins relative to broadliners, typically their lower overhead and larger asset turnover offset this. Small and medium-sized food service distributors of all three types may join buying groups (for example, UniPro, Pocahontas, Premier), which offer buying clout and benefits such as private labels, merchandising and marketing programs, and other support services.
Concentration
Unlike food retailing and manufacturing, where large companies have existed for over 50 years, large general-line grocery wholesalers emerged in the 1980s (Manchester). In 1954, five large general-line whole-sale companies ($93 million or more in whole-sales) account-ed for only 9 percent of general-line wholesale sales. By 1987, 32 large companies accounted for 65 percent of sales.
Among merchant wholesalers, general-line distributors (Supervalu, Fleming, Nash Finch) are the most concen-trated, while fresh fruit and vegetable distributors are the least concentrated (app. table 17). Meat, general-line, and especially poultry merchant wholesalers have experienced greater concentration since 1987 than other merchant wholesalers.
Mainstream economic theory predicts that increased concentration confers increased market power, and that increased market power should increase profits
(Kinsey, 1998). One profit measure commonly used is gross margins. Among all types of grocery whole-salers, gross margin rose from 14.3 percent in 1990 to 15.3 percent in 1997 (U.S. Department of the
Treasury). However, this increase was associated with a two-percentage-point reduction in concentration from 1992 to 1997, as measured by the sales share of the top four grocery wholesalers (CR4) (app. table 16).
For merchant wholesalers of grocery products, gross margin was two percentage points higher (17.2 per-cent) than that for all grocery wholesalers combined in 1997. From 1993 to 1999, merchant wholesalers’ gross margin remained stable (16-18 percent) (fig. 2.5).6 Small increases in merchant wholesalers’ gross mar-gins were associated with slight reductions in the CR4 from 1992 to 1997 (app. table 16).
Supply Chain Initiatives
Firms throughout the retail food industry have adopted various practices from a 1992 industrywide initiative, referred to as Efficient Consumer Response (ECR), designed to emulate the logistic expertise of Wal-Mart (Kinsey, 2001). Under this initiative, firms are to group individual products into categories based on consumer sales and use of the product to ensure desired products are available when demanded (Kinsey, 2001). Efficient replenishment, whereby product flows cheaper and quicker through the food system, reduces inventories and ensures freshness. Under continuous replenishment practices, the retail customer shares data on item movement and inventory with the supplier/wholesaler, reducing the costs of stocking retail shelves. For example, a manufacturer
1993 94 95 96 97 98 99 15.5 16.0 16.5 17.0 17.5 18.0 Figure 2-5
Gross margin as a percentage of sales for merchant wholesalers of grocery and related products
Percent
Source: Bureau of the Census, Annual Benchmark Report for Wholesale Trade: January 1992 to March 2001, U.S. Department of Commerce.
6 Gross margin is defined as sales less cost of goods sold, divided by
sales (Kinsey, 1998). U.S. Bureau of the Census tabulates profits only for merchant wholesalers.
may adjust production or shipments to more effective-ly meet the needs of the distribution center.
Enabling technologies—which include Electronic Data Interchange (EDI), barcodes, and Internet platforms such as UCCNet—facilitate category management and efficient replenishment. EDI allows instantaneous, paperless transmission of data between firms. Potential gains from EDI are substantial, as are costs of imple-menting it. Net benefits can be fully realized only through widespread adoption.
Attempts at implementing these initiatives have met with mixed success. In 1994, the top two general-line merchant distributors to retail food stores, Supervalu and Fleming, announced ECR initiatives. Supervalu noted that it has been pleased with its progress in implementing its program and improved performance
of retail operations. Fleming, on the other hand, found sales to be disappointing. By the end of 1995, the company scaled back its application of ECR principles and chose to implement specific aspects of ECR that best fit their needs. Successful implementation of effi-ciency-enhancing activities launched by Supervalu helped to increase its sales relative to Fleming (Margulis) (table 2.1).
Efficient Foodservice Response (EFR) is a similar ini-tiative by the food service industry. A study conducted by Computer Sciences Corporation, Consulting and Systems Integration, and the Stanford Global Supply Chain Forum of Stanford University concluded that the food service system could save $14.3 billion by adopting EFR practices, potentially resulting in lower menu prices (Perkins). Savings to food service whole-salers, in particular, would amount to $4.7 billion.
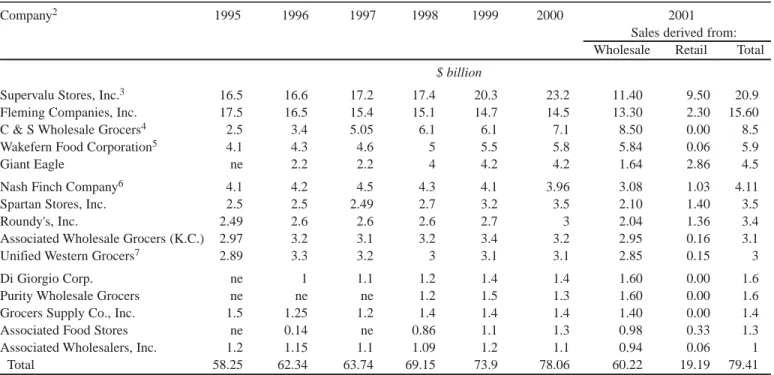
Table 2.1—Sales of top 15 general-line grocery wholesalers1
Company2 1995 1996 1997 1998 1999 2000 2001
Sales derived from: Wholesale Retail Total
$ billion
Supervalu Stores, Inc.3 16.5 16.6 17.2 17.4 20.3 23.2 11.40 9.50 20.9
Fleming Companies, Inc. 17.5 16.5 15.4 15.1 14.7 14.5 13.30 2.30 15.60
C & S Wholesale Grocers4 2.5 3.4 5.05 6.1 6.1 7.1 8.50 0.00 8.5
Wakefern Food Corporation5 4.1 4.3 4.6 5 5.5 5.8 5.84 0.06 5.9
Giant Eagle ne 2.2 2.2 4 4.2 4.2 1.64 2.86 4.5
Nash Finch Company6 4.1 4.2 4.5 4.3 4.1 3.96 3.08 1.03 4.11
Spartan Stores, Inc. 2.5 2.5 2.49 2.7 3.2 3.5 2.10 1.40 3.5
Roundy's, Inc. 2.49 2.6 2.6 2.6 2.7 3 2.04 1.36 3.4
Associated Wholesale Grocers (K.C.) 2.97 3.2 3.1 3.2 3.4 3.2 2.95 0.16 3.1
Unified Western Grocers7 2.89 3.3 3.2 3 3.1 3.1 2.85 0.15 3
Di Giorgio Corp. ne 1 1.1 1.2 1.4 1.4 1.60 0.00 1.6
Purity Wholesale Grocers ne ne ne 1.2 1.5 1.3 1.60 0.00 1.6
Grocers Supply Co., Inc. 1.5 1.25 1.2 1.4 1.4 1.4 1.40 0.00 1.4
Associated Food Stores ne 0.14 ne 0.86 1.1 1.3 0.98 0.33 1.3
Associated Wholesalers, Inc. 1.2 1.15 1.1 1.09 1.2 1.1 0.94 0.06 1
Total 58.25 62.34 63.74 69.15 73.9 78.06 60.22 19.19 79.41
ne = New entrant. A consistent time series was not maintained for these companies in earlier years as they were new entrants into the top 15. 1Firms primarily serving supermarkets and retail foodstores.
2Companies are listed in order, according to sales rank.
3Sales reflect Richfood's acquisition of Super Rite Foods, and subsequent purchase of Richfood by Supervalu. 4C&S plans to operate corporate stores purchased from Grand Union.
5Wakefern is the merchandising and distribution arm of ShopRite supermarkets, the largest retailer-owned cooperative in the United States. 6Sales reflect Nash Finch's acquisition of Super Food Services.
7Unified Western Grocers is the company resulting from the merger between Certified Grocers of California and United Grocers.
Sources: Supermarket News, various issues; Food Institute Report, various issues; Progressive Grocer Annual Report, April 2001; Wall Street Journal, selected issues; American Institute of Food Distribution, Inc.; Company 10K's filed with the Security and Exchange Commission.
Recent Developments in
Food Wholesaling
Supervalu and Fleming remain, by far, the largest broadline wholesalers of retail food (table 2.1). The companies plan to follow divergent strategies. Fleming announced plans to sell company-owned conventional supermarket chains to focus on food distribution facili-ties and its Food 4 Less warehouse stores, emphasiz-ing value pricemphasiz-ing. For the first time in Flememphasiz-ing’s 86-year history, supermarkets account for less than half its sales to retailers, with the remainder going to alterna-tive store formats. For example, by supplying Prima Marketing and Quarles Food Stores, which operate convenience stores, like the Pantry Store and Q-Stop, Fleming is building its presence there in response to changes in consumer purchasing patterns (see “Food Retailing”). Sales to online food retailers are also expected to be an important driver for future growth. On the other hand, Supervalu, also the 10th largest supermarket retailer, announced that it would focus on building its retail business and continue its long-term strategy of retail acquisitions. In 2001, as part of its restructuring, the company announced plans to focus its retail operations and capital spending on retail mar-kets with higher-return growth. The company is also accelerating the growth of its Save-A-Lot stores, which is a limited-assortment, “extreme value” chain of supermarkets that targets households with annual income of $35,000 or less. The goal in 2002 is to grow retail earnings to overcome the loss of its Kmart account in 2001. Thus far, Supervalu has chosen to focus on its supply chain logistics in the United States, rather than expanding internationally through export markets or investments in retail operations.
Consolidation Among General-Line Retail
Food Wholesalers
The retail food wholesaling sector continues to experi-ence consolidation through acquisitions. Mergers by leading wholesalers, both horizontal and vertical, are reshuffling the ranks of the top companies (app. table 35). Acquisitions can lead to efficiency gains that reduce costs and enable wholesalers to offer more variety to customers throughout a market region. With rapid consolidation by supermarket chains, many gro-cery wholesalers continue to acquire retail operations to maintain their customer base. Such vertical expan-sion enables companies to create synergies, cut operat-ing costs, and cater to the geographic idiosyncrasies of
consumers and retailer customers. Leading wholesalers Supervalu, Fleming, and Giant Eagle (along with BJ’s Wholesale Club) are now among the top U.S. food retailers, with a combined market share of 5 percent. Richfood Holdings has been especially active in merg-er activity, acquiring othmerg-er grocmerg-ery wholesalmerg-ers to become more cost-effective while servicing a smaller number of small chains. The addition of Super Rite’s distribution facilities significantly increased
Richfood’s warehouse space. And by acquiring the supermarket chain Farm Fresh in 1997, Richfood mul-tiplied its supermarket establishments six-fold. In 1999, Supervalu purchased Richfood, at that time the sixth leading food wholesaler.
Nash Finch, Spartan Stores, and Roundy’s are also pursuing a strategy of supermarket acquisitions. In 2002, Nash Finch had 111 supermarkets, warehouse stores, and mass merchandise stores to better compete with large self-distributing supermarket chains. In 2001, C&S Wholesale Grocers made its first signifi-cant entry into retailing by purchasing Grand Union, a retailer that it formerly supplied.
In an industry in which wholesalers’ main customers are independent retailers and small chains, some whole-salers are courting large and medium-sized chains. For example, C&S Wholesale Grocers is a supplier to Giant Food Stores, whose parent company, Ahold, is the Nation’s fifth largest grocery retailer. These wholesalers provide service to chains that, by virtue of their size, are capable of self-supplying but do not.
Top Food Service Distributors Continue
Rapid Consolidation
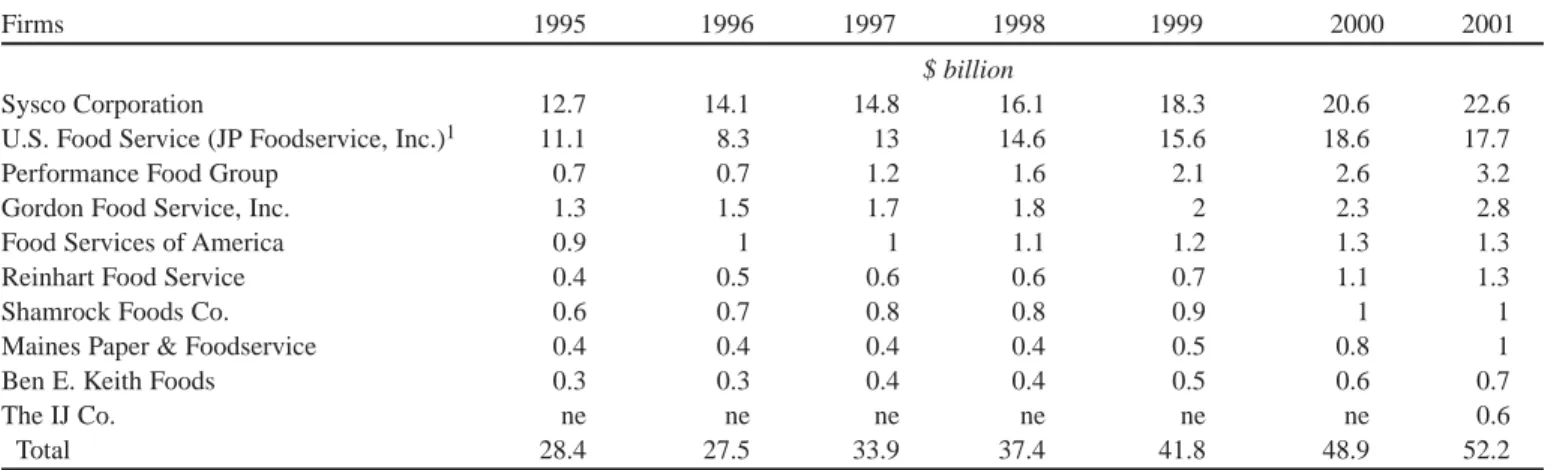
In 2001, the ten largest broadline distributors to food service establishments accounted for nearly 31 percent of total food service distributor sales ($170 billion) (table 2-2). Sysco Corporation is the Nation’s largest broadline food service distributor, outpacing its nearest competitor by $4.9 billion in sales, or 28 percent. The company accounted for 13 percent of total food serv-ice distribution sales. Sysco also ranked 80th in the S&P 500 (based on growth in sales, profits, return to shareholders, etc.); the nearest food industry company, Kroger, ranked 120th. Through a series of vertical acquisitions, Sysco has also entered specialty meat processing (app. table 35).
In recent years, food service distributors have been especially active in acquiring other food service
dis-tributors (table 2-3, app. table 35). The pace and com-plexity of consolidation among food service distribu-tors is demonstrated by acquisitions involving U.S. Foodservice. The company initially was purchased by JP Foodservice, which was extremely active in merg-ers and acquisitions, and operated under the “U.S. Foodservice” name. As a result, U.S. Foodservice moved ahead of Alliant Foodservice, Inc., to become the second largest food service distributor. Reasons given for the merger included efficiency gains from greater purchasing power, lower transportation costs by rescheduling of customer drops for greater route density, and elimination of administrative cost redun-dancies. The merger extended JP’s presence to 85 per-cent of the Nation, with customers such as Subway and Pizzeria Uno. Subsequently, in April 2000, Royal Ahold, the fourth largest grocery retailer in the world, moved into the food service business by purchasing U.S. Foodservice. The acquisition gave Ahold a reli-able supply of food service products for its instore cafe and deli. U.S. Foodservice subsequently pur-chased Alliant Foodservice and GFG Foodservice, moving it ever closer to Sysco’s sales.
Performance Food Group’s (PFG) recent acquisitions extended the company geographically and diversified its customer mix. While these acquisitions increase the number of large, higher volume chain accounts serv-iced (which are generally lower gross-margin
accounts), they allow for more efficient operations and lower operating costs. In 2001, PFG vertically inte-grated into fresh-cut produce by purchasing the largest independent processing company, Fresh Express, a pioneer in retail packaged salads.
In a major development, Ameriserve Food Distribution, Inc., one of the largest quick-service food service dis-tributors to restaurants in North America, declared bankruptcy in 2000. After acquiring PepsiCo Food Systems and ProSource in 1997 and 1998, the company accumulated $2 billion in debt, stretching its leverage and management. The combined operation served restaurants such as Arby’s, Burger King, Pizza Hut, Long John Silver, KFC, and Taco Bell. Ameriserve recently lost one of its biggest accounts, Burger King, due to service complaints. These financial problems constrained earnings at quick-service restaurants and their suppliers, especially the poultry sector.
The consolidation trend among food service companies in the United States is expected to continue. In 2001, the top four distributors accounted for 27 percent of sales, compared with 15 percent in 1994. According to
infor-Table 2.2—Sales of the top 10 broadline food service distributors
Firms 1995 1996 1997 1998 1999 2000 2001
$ billion
Sysco Corporation 12.7 14.1 14.8 16.1 18.3 20.6 22.6
U.S. Food Service (JP Foodservice, Inc.)1 11.1 8.3 13 14.6 15.6 18.6 17.7
Performance Food Group 0.7 0.7 1.2 1.6 2.1 2.6 3.2
Gordon Food Service, Inc. 1.3 1.5 1.7 1.8 2 2.3 2.8
Food Services of America 0.9 1 1 1.1 1.2 1.3 1.3
Reinhart Food Service 0.4 0.5 0.6 0.6 0.7 1.1 1.3
Shamrock Foods Co. 0.6 0.7 0.8 0.8 0.9 1 1
Maines Paper & Foodservice 0.4 0.4 0.4 0.4 0.5 0.8 1
Ben E. Keith Foods 0.3 0.3 0.4 0.4 0.5 0.6 0.7
The IJ Co. ne ne ne ne ne ne 0.6
Total 28.4 27.5 33.9 37.4 41.8 48.9 52.2
ne = New entrant. A consistent time series was not maintained for this company in earlier years as it was a new entrant into the top 10 in 2001. 1Includes JP Foodservice's acquisition of U.S. Foodservice, Inc. and U.S. Food Service's (a subsidiary of Ahold) acquisitions of PYA/Monarch, Inc., and Alliant Foodservice, Inc. (formerly Kraft Foodservice).
Sources: Institutional Distribution, various issues; Food Institute Report, various issues; just-food.com.
Table 2.3—Grocery and foodservice wholesaler acquisitions by type of firm acquired
Acquisitions 1998 1999 2000 Number Food processors 10 7 5 Foodservice distributors 28 26 24 Retailers 6 13 4 Grocery wholesalers 21 13 9 Equipment suppliers 4 0 1
Raw product suppliers 0 1 0
Soft drink & water bottler 0 0 1
Restaurant 0 0 1
Unclassified 2 3 1
Total acquisitions by wholesalers 71 63 46 Source: Compiled by USDA/ERS from The Food Institute. “Food Business Mergers and Acquisitions,” 1998, 1999, and 2000.
mation documented by the Food Institute, food service distributors accounted for over half of all acquisitions by food wholesalers in 2000 (table 2-3).
Warehouse Clubs
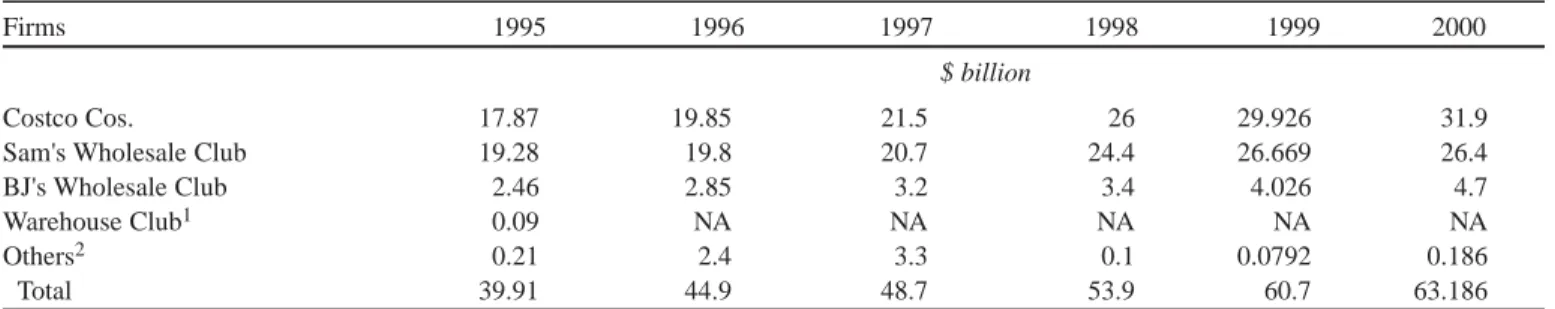
Rapid inventory turnover, high sales volume, and reduced operating costs enable warehouse clubs to oper-ate at lower gross margins (8-12 percent) than discount chains and supermarkets, which operate on gross mar-gins of 20 to 30 percent (Warehouse Club Focus). Warehouse clubs have become a powerful retailing force over the past decade, and their sales continue to increase both domestically and abroad (table 2-4). Costco and Sam’s (a subsidiary of Wal-Mart) account for 93 percent of the club store market. BJ’s is a distant third.
Grocery sales typically account for 30 to 40 percent of total wholesale club sales (The Food Institute Report). In 2000, club stores accounted for $23.7 billion in sales of grocery items (Progressive Grocer Annual Report). Despite predictions that rapid growth in the late 1980s would limit future growth, sales have contin-ued to increase each year. Operators have focused on renovating or relocating existing units, and maintain-ing and attractmaintain-ing new members. Sam’s Clubs and Costco intensified their emphasis on business cus-tomers and launched marketing efforts, such as coupons and gift catalogs. Leading clubs are adding fresh departments and convenience products, such as rotisserie chicken, microwaveable entrees, and home meal replacement lines.
Most of the expected growth in warehouse clubs will be from international markets where industry leaders Sam’s and Costco are focusing. In May 1995, Wal-Mart Stores opened its first Sam’s Club outlet in South America in Sao Paulo, Brazil. The store serves mainly
small dues-paying retail members such as restaurants, bars, and other businesses. The first Sam’s Club in Argentina opened in August 1995. Sam’s also operates 50 stores in Brazil, China, Mexico, and Puerto Rico. Costco operates 60 warehouses in Canada, 11 in the United Kingdom, 5 in Korea, 3 in Taiwan, 2 in Japan, and 20 in Mexico through a joint venture. The compa-ny recently opened its first Japanese units, both near Tokyo. On the other hand, BJs has chosen to grow domestically, not internationally.
References
The Food Institute Report, “Supercenter and
Wholesale Club Growth Continues,” July 30, 2001. Friddle, C.G., S. Mangaraj, and J.D. Kinsey. The Food
Service Industry: Trends and Changing Structure in the New Millennium, Working Paper 01-02. The Retail Food Industry Center, University of Minnesota, St. Paul, MN, March 2001.
Kaufman, P.R., C.R. Handy, E.W. McLaughlin, K. Park, and G.M. Green. Understanding the Dynamics of Produce Markets: Consumption and Consolidation Grow, AIB-758. U.S. Department of Agriculture, Economic Research Service, August 2000.
Kinsey, J.D. Concentration of Ownership in Food Retailing: A Review of the Evidence About
Consumer Impact, Working Paper 98-04. The Retail Food Industry Center, University of Minnesota, St. Paul, MN, 1998.
Kinsey, J.D. “The Big Shift From a Food Supply to a Food Demand Chain,” Minnesota Agricultural Economist, No. 698. University of Minnesota, St. Paul, MN, Fall 1999.
Table 2.4—Total sales by warehouse clubs, 1995 to 2000
Firms 1995 1996 1997 1998 1999 2000
$ billion
Costco Cos. 17.87 19.85 21.5 26 29.926 31.9
Sam's Wholesale Club 19.28 19.8 20.7 24.4 26.669 26.4
BJ's Wholesale Club 2.46 2.85 3.2 3.4 4.026 4.7
Warehouse Club1 0.09 NA NA NA NA NA
Others2 0.21 2.4 3.3 0.1 0.0792 0.186
Total 39.91 44.9 48.7 53.9 60.7 63.186
NA = Not applicable.
1Closed remaining units in August 1995.
2In 2000, based on sales of Cost-U-Less. In previous years, calculated as a residual using total segment sales. Source: Food Institute Report, Various issues; and www.warehouseclubfocus.com.
Kinsey, J. “A Faster, Leaner, Supply Chain: New Uses of Information Technology,” American Journal of Agricultural Economics, 82(2000):1123-29. Kinsey, J.D. Personal communication. December 18,
2001.
Manchester, A. Rearranging the Economic Landscape, AER-660. U.S. Department of Agriculture,
Economic Research Service, September 1992. Margulis, R. “Fleming to Rely on a Low-Cost Supply
Chain to Drive its Growth,” Retail NewsBeat, September 28, 2000.
Perkins, C. “EFR,” Institutional Distribution, May 1996.
Progressive Grocer Annual Report, April 2001.
U.S. Department of Commerce, U.S. Census Bureau. Personal communication, January 8, 2002.
U.S. Department of Commerce, Economics and Statistics Administration, U.S. Census Bureau. 1997 Economic Census: Wholesale Trade, September 2000.
U.S. Department of the Treasury, Internal Revenue Service. Corporation Source Book, 1990 and 1997. Veiders, C. “FDI Examines Impact of Consumer
Trends on Distribution,” Supermarket News, September 17, 2001.
Warehouse Club Focus. Warehouse Club Industry Guide. Accessed 28 March 2002, http://www.ware-houseclubfocus.com/issues/2001G-what%20is.pdf.