Seismic Evaluation and Retrofitting of RC Building by Using
Energy Dissipating Devices
S. I. Khan
1, Prof. P. O. Modani
21(Department of Civil Engineering, B.N.C.O.E, Pusad) 2(Assist. Professor Department of Civil Engineering, B.N.C.O.E, Pusad)
ABSTRACT
The Buildings, which appeared to be strong enough, may crumble like houses of cards during earthquake and deficiencies may be exposed. Experience gain from the recent earthquake of Bhuj, 2001 demonstrates that the most of buildings collapsed were found deficient to meet out the requirements of the present day codes. In last decade, four devastating earthquakes of world have been occurred in India, and low to mild intensities earthquakes are shaking our land frequently. It has raised the questions about the adequacy of framed structures to resist strong motions, since many buildings suffered great damage or collapsed. Under such circumstances, seismic qualification of existing buildings has become extremely important. Seismic qualification eventually leads to retrofitting of the deficient structures
In the proposed investigation a performance based evaluation and retrofit of an existing hostel building in Babasaheb Naik College of Engineering, Pusad. Built in 1987, the subject hostel building is a four-story, rectangular structure. A nonlinear static pushover analysis using the displacement coefficient method, as described in FEMA 356, is used to evaluate the seismic performance of the existing building. A seismic retrofit using energy dissipating device based on pushover analysis is proposed for the life-safety target performance of the existing building.
I.
INTRODUCTION
1.1 General
A large number of existing buildings in India are severely deficient against earthquake forces and the number of such buildings is growing very rapidly. This has been highlighted in the past earthquake. Retrofitting of any existing building is a complex task and requires skill, retrofitting of RC buildings is particularly challenging due to complex behavior of the RC composite material. The behavior of the buildings during earthquake depends not only on the size of the members and amount of reinforcement, but to a great extent on the placing and detailing of the reinforcement. There are three sources of deficiencies in a building, which have to be accounted for by the retrofitting engineer:
(i) Inadequate design and detailing
(ii) Degradation of material with time and use
(iii) Damage due to earthquake or other catastrophe.
The three sources, suggest a retrofit scheme to make up for the deficiencies and demonstrate that the retrofitted structure will be able to safety resist the future earthquake forces expected during the lifetime of the structure. In particular, the seismic rehabilitation of older concrete structures in high seismicity areas is a matter of growing concern, since structures vulnerable to damage must be identified and an acceptable level of safety must be determined [1].
Thus, the structural engineering community has developed a new generation of design and seismic procedures that incorporate performance based structures and is moving away from simplified linear elastic methods and towards a more non-linear technique. Recent interests in the development of performance based codes for the design or rehabilitation of buildings in seismic active areas show that an inelastic procedure commonly referred to as the pushover analysis is a viable method to assess damage vulnerability of buildings. Basically, a pushover analysis is a series of incremental static analysis carried out to develop a capacity curve for the building. Based on the capacity curve, a target displacement which is an estimate of the displacement that the design earthquake will produce on the building is determined. The extent of damage experienced by the structure at this target displacement is considered representative of the damage experienced by the building when subjected to design level ground shaking. Many methods were presented to apply the nonlinear static pushover (NSP) to structures. These methods can be listed as:
(1) Capacity Spectrum Method (CSM) (ATC)
(2) Displacement Coefficient Method (DCM) (FEMA-356)
(3) Modal Pushover Analysis (MPA). The approach has been developed by many researchers with minor variation in computation procedure. Since the behavior of reinforced concrete structures may be highly inelastic under seismic loads, the global inelastic performance of RC structures will be dominated by plastic yielding effects and consequently the accuracy of the pushover analysis will be influenced by the ability of
the analytical models to capture these effects. In general, analytical models for the pushover analysis of frame structures may be divided into two main types: (1) distributed plasticity (plastic zone) and (2) concentrated plasticity (plastic hinge). Although the plastic hinge approach is simpler than the plastic zone, this method is limited to its incapacity to capture the more complex member behavior that involve severe yielding under the combined actions of compression and bi-axial bending and buckling effects [1].
1.2 Seismic Retrofitting
All buildings those are constructed, before the modern regulations came up for the design of buildings in seismic areas, those which are constructed before thirty years or those constructed recently but not properly designed, constructed or maintained can be considered as a possible candidates for retrofitting. These buildings may be damaged by earthquake action. It is not always possible to strengthen the existing buildings to the level corresponding to modern seismic codes due to economic reasons. The building should be retrofitted to achieve the required performance level. Although engineering safety is the prime criterion, other criteria such as social, cultural, financial, historical, artistic, and political should also be considered [13].
Existing building can become seismically deficient when
a) Seismic design code requirements are up graded since the design of these buildings is with an older version of the code,
b) Seismic design codes used in their design are deficient,
c) Engineering knowledge makes advances rendering insufficient the previous understanding used in their design, and
d) Designers lack understanding of the seismic behavior of the structures.
Indian buildings built over the past two decades are deficient because of items (b), (c) and (d) above. The last revision of the Indian seismic code in 1987 IS 1893 (1984) is deficient from many points of view, and engineering knowledge has advanced significantly from what was used. Also the seismic design was not practiced in most buildings being built [2].
1.3 Seismic Design
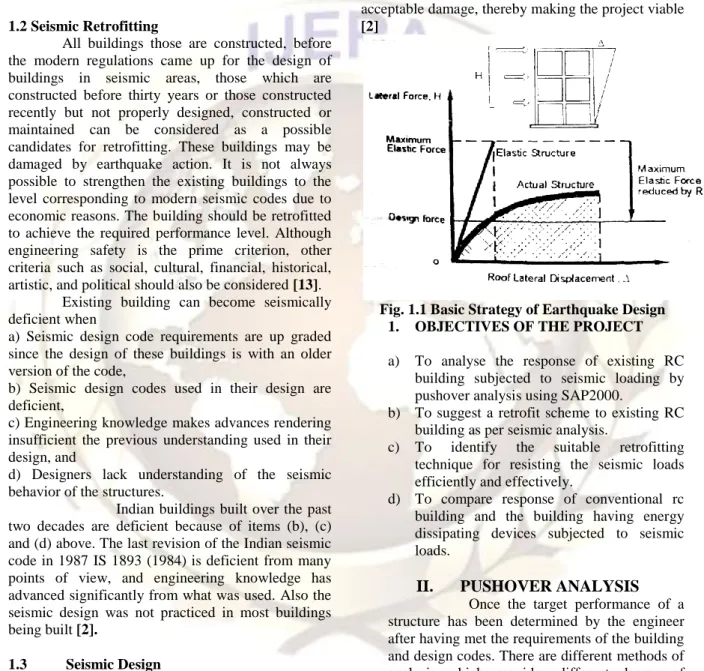
RC frame building would become massive if they were to be designed to behave elastically without incurring damage, and hence the project may become economically unviable. On the contrary, the building must undergo damage necessarily to be able to dissipate the energy input to it during the earthquake. Thus, as per the seismic design philosophy, (a) under occasional strong shaking, structural damage is acceptable. Therefore,
structures are designed philosophy, (a) under occasional strong shaking, structural damage is acceptable, but collapse is not, and (b) under semi occasional moderate shaking, structural damage is limited oven though non-structural damage is not acceptable. Therefore, structures are designed only for a fraction of the force that they would experience if they were designed to remain elastic during the expected strong ground shaking and thereby permitting damage under minor shaking refer figure 2.1 Thus, seismic design balances reduced cost and acceptable damage, thereby making the project viable [2]
Fig. 1.1 Basic Strategy of Earthquake Design 1. OBJECTIVES OF THE PROJECT a) To analyse the response of existing RC
building subjected to seismic loading by pushover analysis using SAP2000.
b) To suggest a retrofit scheme to existing RC building as per seismic analysis.
c) To identify the suitable retrofitting technique for resisting the seismic loads efficiently and effectively.
d) To compare response of conventional rc building and the building having energy dissipating devices subjected to seismic loads.
II.
PUSHOVER ANALYSIS
Once the target performance of a structure has been determined by the engineer after having met the requirements of the building and design codes. There are different methods of analysis which provides different degree of accuracy. Based on the type of external action and behavior of structure the seismic analysis methods are classified asTable 3.1: Types of analysis methods
Static Dynamic
Linear Nonlinear Linear Nonlinear Seismic coefficient Pushover analysis Response spectrum Time history
method method method method
Nonlinear static analysis is an improvement over the linear static or dynamic analysis in the sense that it allows the inelastic behavior of the structure. The method assumes a set of static incremental lateral load over the height of the structure. The method is relatively simple to be implemented, and provides information of the strength, deformation and ductility of the structure and the distribution of demands.
1.1 3D Pushover Analysis
In this analysis method, earthquake load is applied on the model in an incremental basis. Earthquake load distribution is selected for which analysis is required. For this load distribution an initial load step is selected 3 D static analysis is done for this initial load step and checking for plastic moment capacity of elements to reach. If no element reaches plastic moment capacity, then load applied increase and analysis is done for new load. When in any element, plastic moment capacity is reached, plastic hinge is introduced in that element now. New analysis is done on this structure with new earthquake distribution (since earthquake load distribution will depend on structural properties. We can also continue with same distribution of earthquake load).and checking plastic moment capacity in other elements. And when plastic moment capacity is reacted, plastic hinge is introduced in that element.
At each step, load required for each event to occurred is noted down (event is the formation of plastic hinge in any element) same procedure is repeated until plastic mechanism is formed in the entire structure that leads to collapse of structure. Now collapse load is calculated which’s nothing but load required for final event to occur.
3.2 Advantages of Pushover Analysis
1) It allows us to evaluate overall structural behaviors and performance characteristics. 2) It enables us to investigate the sequential
formation of plastic hinges in the individual structural elements constituting the entire structure.
3) When a structure is to be strengthened through a rehabilitation process, it allows us to selectively reinforce only the required members maximizing the cost efficiency
4) The pushover analysis provides good estimate of global and local inelastic deformation demands for structures that vibrate primarily in the fundamental mode.
3.3 Limitations of Pushover Analysis
1) Deformation estimates obtained from a pushover analysis may be grossly
inaccurate for structures where higher mode effects are significant.
2) In most cases it will be necessary to perform the analysis with displacement rather than force control, since the target displacement may be associated with very small positive or even a negative lateral stiffness because of the development of mechanisms and P-delta effects.
3) Pushover analysis implicitly assurances that damage is a function only of the lateral deformation of the structure, neglecting duration effects, number of stress reversals and cumulative energy dissipation demand 4) The procedure does not take into account
for the progressive changes in modal properties that take place in a structure as it experiences cyclic non-linear yielding during earthquake.
5) Most critical is the concern that the pushover analysis may detect only the first local mechanism that will form in an earthquake mechanism that will form in an earthquake and may not expose other weakness that will be generated when the structures dynamic characteristics change after formation of first local mechanism.
III.
MODELING AND ANALYSIS OF
BUILDING
4.1 Introduction to SAP 2000
The software used for the present study is SAP 2000. It is product of Computers and Structures, Berkeley, USA. SAP 2000 is used for analyzing general structures including bridges, stadiums, towers, industrial plants, offshore structures, buildings, dam, silos, etc. It is a fully integrated program that allows model creation, modification, execution of analysis, design optimization, and results review from within a single interface. SAP 2000 is a standalone finite element based structural program for analysis and design of civil structures. It offers an intuitive, yet powerful user interface with many tools to aid in quick and accurate construction of models, along with sophisticated technique needed to do most complex projects.
SAP 2000 is objecting based, meaning that the models are created with members that represent physical reality. Results for analysis and design are reported for the overall object, providing information that is both easier to interprets and consistent with physical nature.
The SAP 2000 structural analysis programme offers following features-
Static and Dynamic Analysis
Linear and Nonlinear Analysis
Dynamic seismic analysis and Static push over analysis
Frame and shell structural elements
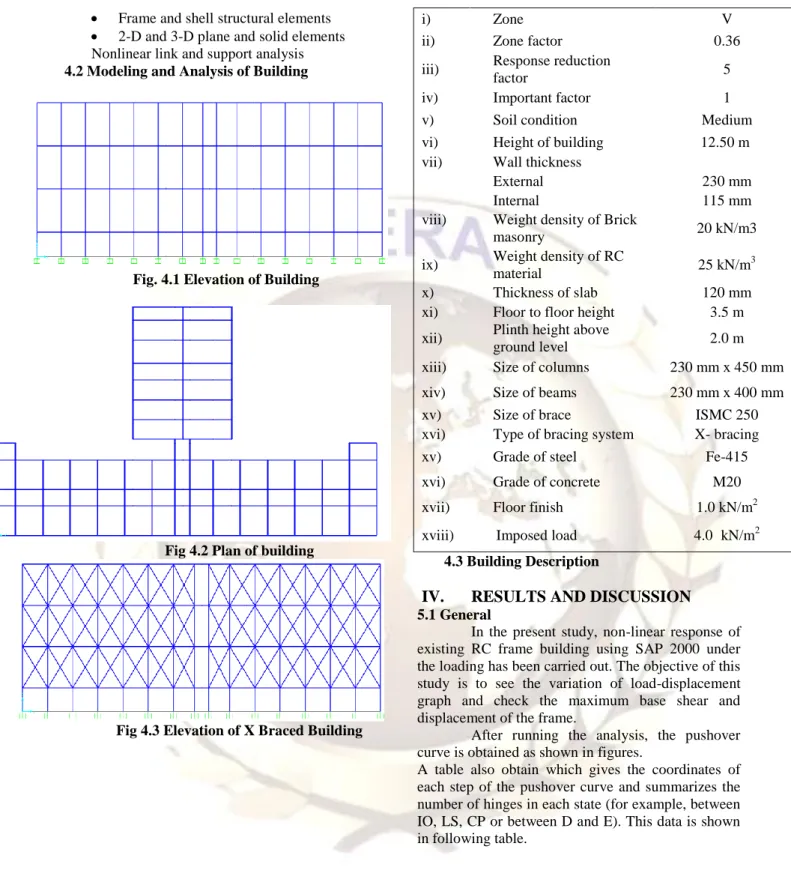
2-D and 3-D plane and solid elements Nonlinear link and support analysis 4.2 Modeling and Analysis of Building
Fig. 4.1 Elevation of Building
Fig 4.2 Plan of building
Fig 4.3 Elevation of X Braced Building
4.3 Building Description
IV.
RESULTS AND DISCUSSION
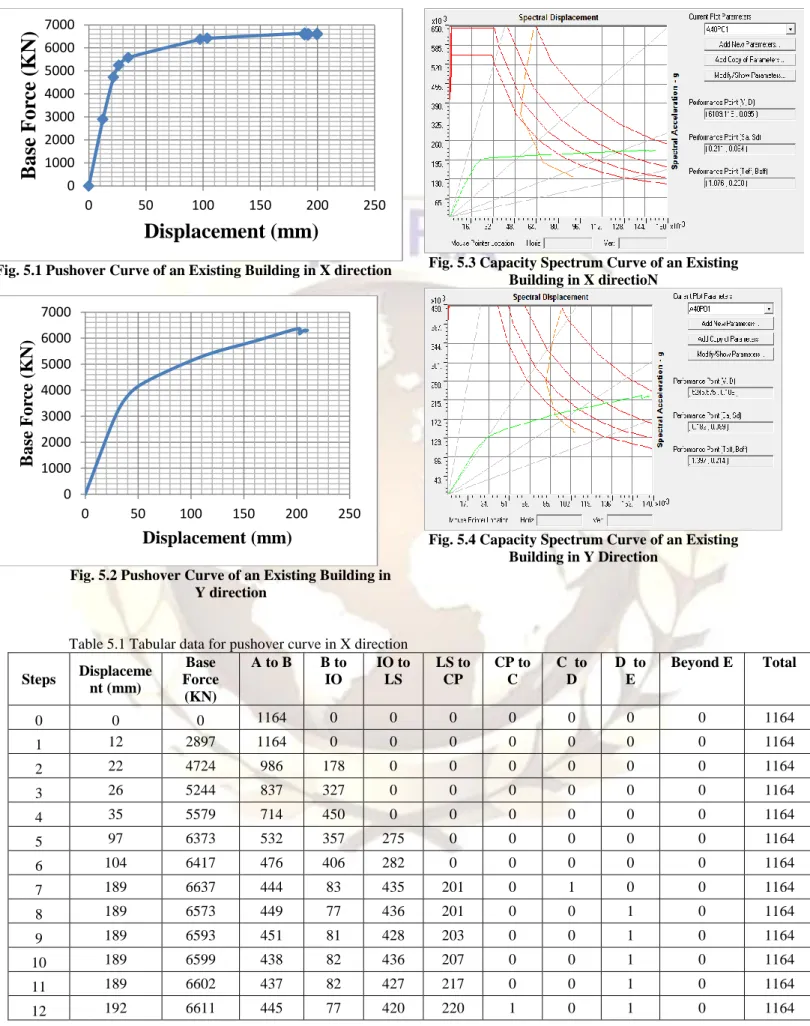
5.1 GeneralIn the present study, non-linear response of existing RC frame building using SAP 2000 under the loading has been carried out. The objective of this study is to see the variation of load-displacement graph and check the maximum base shear and displacement of the frame.
After running the analysis, the pushover curve is obtained as shown in figures.
A table also obtain which gives the coordinates of each step of the pushover curve and summarizes the number of hinges in each state (for example, between IO, LS, CP or between D and E). This data is shown in following table.
i) Zone V
ii) Zone factor 0.36
iii) Response reduction
factor 5
iv) Important factor 1 v) Soil condition Medium vi) Height of building 12.50 m
vii) Wall thickness
External 230 mm
Internal 115 mm
viii) Weight density of Brick
masonry 20 kN/m3
ix) Weight density of RC
material 25 kN/m
3
x) Thickness of slab 120 mm xi) Floor to floor height 3.5 m xii) Plinth height above
ground level 2.0 m xiii) Size of columns 230 mm x 450 mm xiv) Size of beams 230 mm x 400 mm xv) Size of brace ISMC 250 xvi) Type of bracing system X- bracing xv) Grade of steel Fe-415 xvi) Grade of concrete M20 xvii) Floor finish 1.0 kN/m2 xviii) Imposed load 4.0 kN/m2
Fig. 5.1 Pushover Curve of an Existing Building in X direction
Fig. 5.2 Pushover Curve of an Existing Building in Y direction
Fig. 5.3 Capacity Spectrum Curve of an Existing Building in X directioN
Fig. 5.4 Capacity Spectrum Curve of an Existing Building in Y Direction
Table 5.1 Tabular data for pushover curve in X direction
Steps Displaceme nt (mm) Base Force (KN) A to B B to IO IO to LS LS to CP CP to C C to D D to E Beyond E Total 0 0 0 1164 0 0 0 0 0 0 0 1164 1 12 2897 1164 0 0 0 0 0 0 0 1164 2 22 4724 986 178 0 0 0 0 0 0 1164 3 26 5244 837 327 0 0 0 0 0 0 1164 4 35 5579 714 450 0 0 0 0 0 0 1164 5 97 6373 532 357 275 0 0 0 0 0 1164 6 104 6417 476 406 282 0 0 0 0 0 1164 7 189 6637 444 83 435 201 0 1 0 0 1164 8 189 6573 449 77 436 201 0 0 1 0 1164 9 189 6593 451 81 428 203 0 0 1 0 1164 10 189 6599 438 82 436 207 0 0 1 0 1164 11 189 6602 437 82 427 217 0 0 1 0 1164 12 192 6611 445 77 420 220 1 0 1 0 1164 0 1000 2000 3000 4000 5000 6000 7000 0 50 100 150 200 250
Ba
se
F
o
rce
(KN
)
Displacement (mm)
0 1000 2000 3000 4000 5000 6000 7000 0 50 100 150 200 250B
ase
F
or
ce
(K
N)
Displacement (mm)
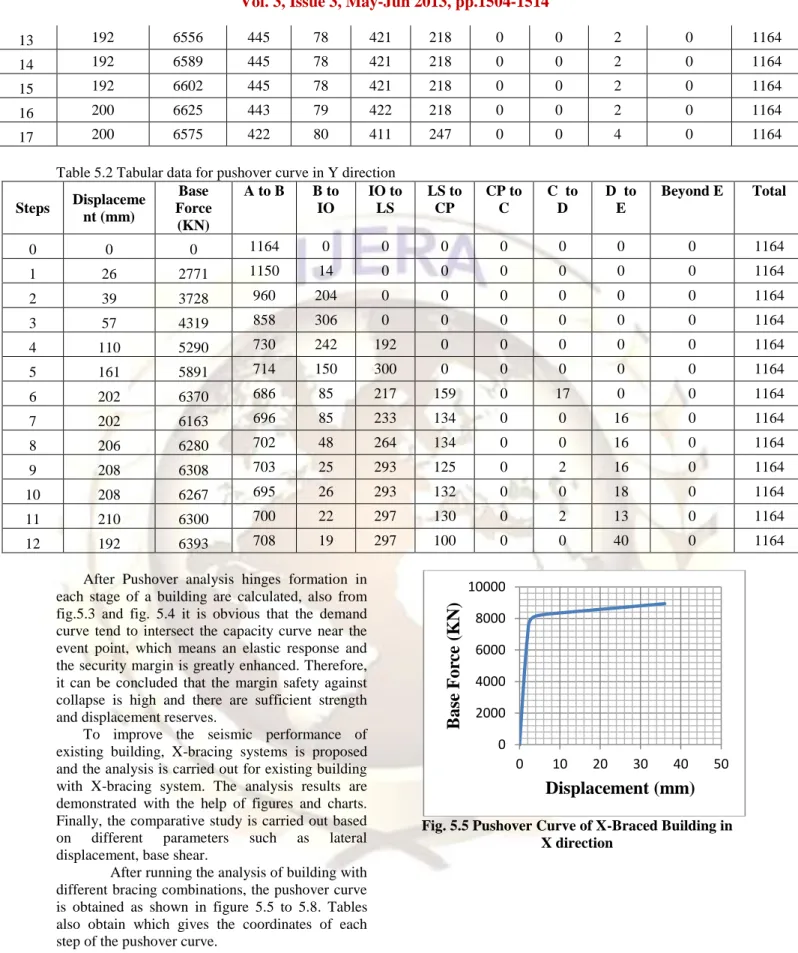
13 192 6556 445 78 421 218 0 0 2 0 1164
14 192 6589 445 78 421 218 0 0 2 0 1164
15 192 6602 445 78 421 218 0 0 2 0 1164
16 200 6625 443 79 422 218 0 0 2 0 1164
17 200 6575 422 80 411 247 0 0 4 0 1164
Table 5.2 Tabular data for pushover curve in Y direction
Steps Displaceme nt (mm) Base Force (KN) A to B B to IO IO to LS LS to CP CP to C C to D D to E Beyond E Total 0 0 0 1164 0 0 0 0 0 0 0 1164 1 26 2771 1150 14 0 0 0 0 0 0 1164 2 39 3728 960 204 0 0 0 0 0 0 1164 3 57 4319 858 306 0 0 0 0 0 0 1164 4 110 5290 730 242 192 0 0 0 0 0 1164 5 161 5891 714 150 300 0 0 0 0 0 1164 6 202 6370 686 85 217 159 0 17 0 0 1164 7 202 6163 696 85 233 134 0 0 16 0 1164 8 206 6280 702 48 264 134 0 0 16 0 1164 9 208 6308 703 25 293 125 0 2 16 0 1164 10 208 6267 695 26 293 132 0 0 18 0 1164 11 210 6300 700 22 297 130 0 2 13 0 1164 12 192 6393 708 19 297 100 0 0 40 0 1164
After Pushover analysis hinges formation in each stage of a building are calculated, also from fig.5.3 and fig. 5.4 it is obvious that the demand curve tend to intersect the capacity curve near the event point, which means an elastic response and the security margin is greatly enhanced. Therefore, it can be concluded that the margin safety against collapse is high and there are sufficient strength and displacement reserves.
To improve the seismic performance of existing building, X-bracing systems is proposed and the analysis is carried out for existing building with X-bracing system. The analysis results are demonstrated with the help of figures and charts. Finally, the comparative study is carried out based on different parameters such as lateral displacement, base shear.
After running the analysis of building with different bracing combinations, the pushover curve is obtained as shown in figure 5.5 to 5.8. Tables also obtain which gives the coordinates of each step of the pushover curve.
Fig. 5.5 Pushover Curve of X-Braced Building in X direction 0 2000 4000 6000 8000 10000 0 10 20 30 40 50
Base
F
or
ce
(
K
N
)
Displacement (mm)
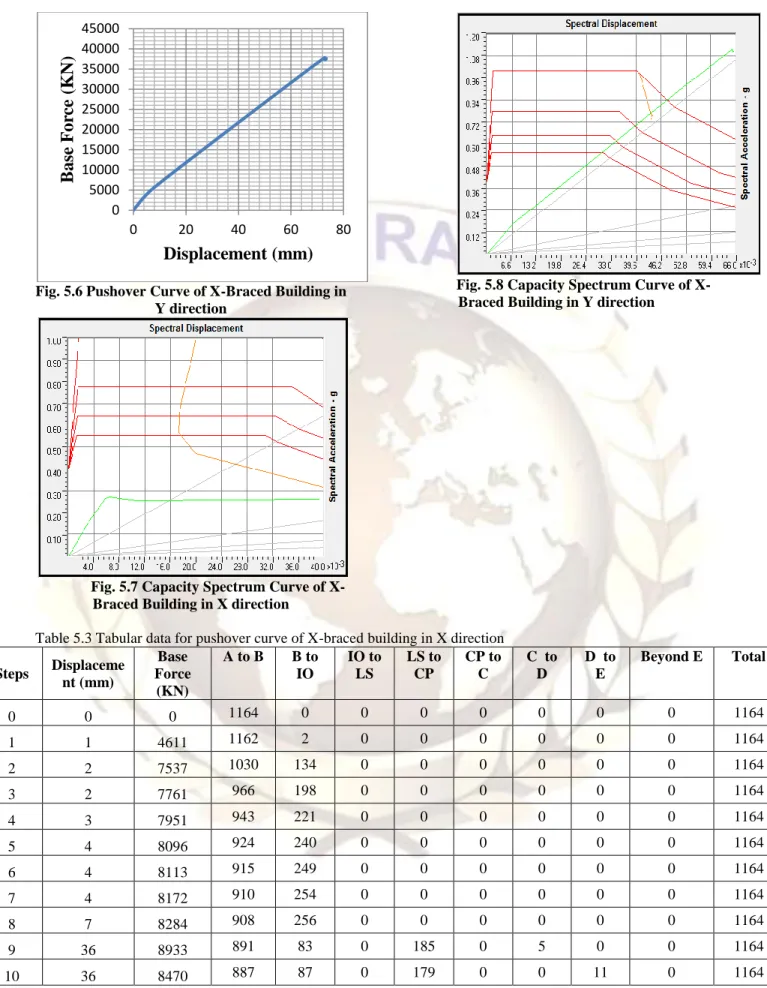
Fig. 5.6 Pushover Curve of X-Braced Building in Y direction
Fig. 5.7 Capacity Spectrum Curve of X-Braced Building in X direction
Fig. 5.8 Capacity Spectrum Curve of X-Braced Building in Y direction
Table 5.3 Tabular data for pushover curve of X-braced building in X direction
Steps Displaceme nt (mm) Base Force (KN) A to B B to IO IO to LS LS to CP CP to C C to D D to E Beyond E Total 0 0 0 1164 0 0 0 0 0 0 0 1164 1 1 4611 1162 2 0 0 0 0 0 0 1164 2 2 7537 1030 134 0 0 0 0 0 0 1164 3 2 7761 966 198 0 0 0 0 0 0 1164 4 3 7951 943 221 0 0 0 0 0 0 1164 5 4 8096 924 240 0 0 0 0 0 0 1164 6 4 8113 915 249 0 0 0 0 0 0 1164 7 4 8172 910 254 0 0 0 0 0 0 1164 8 7 8284 908 256 0 0 0 0 0 0 1164 9 36 8933 891 83 0 185 0 5 0 0 1164 10 36 8470 887 87 0 179 0 0 11 0 1164
Table 5.4 Tabular data for pushover curve of X-braced building in Y direction
0 5000 10000 15000 20000 25000 30000 35000 40000 45000 0 20 40 60 80
B
ase
F
or
ce
(K
N)
Displacement (mm)
Steps Displaceme nt (mm) Base Force (KN) A to B B to IO IO to LS LS to CP CP to C C to D D to E Beyond E Total 0 0 0 1164 0 0 0 0 0 0 0 1164 1 8 5646 1163 1 0 0 0 0 0 0 1164 2 60 31370 994 8 138 24 0 0 0 0 1164 3 73 37814 991 23 0 133 0 17 0 0 1164 4 73 37298 989 25 0 123 0 0 27 0 1164 5 73 37573 986 27 0 115 0 8 28 0 1164 6 73 37279 981 33 0 114 0 0 36 0 1164
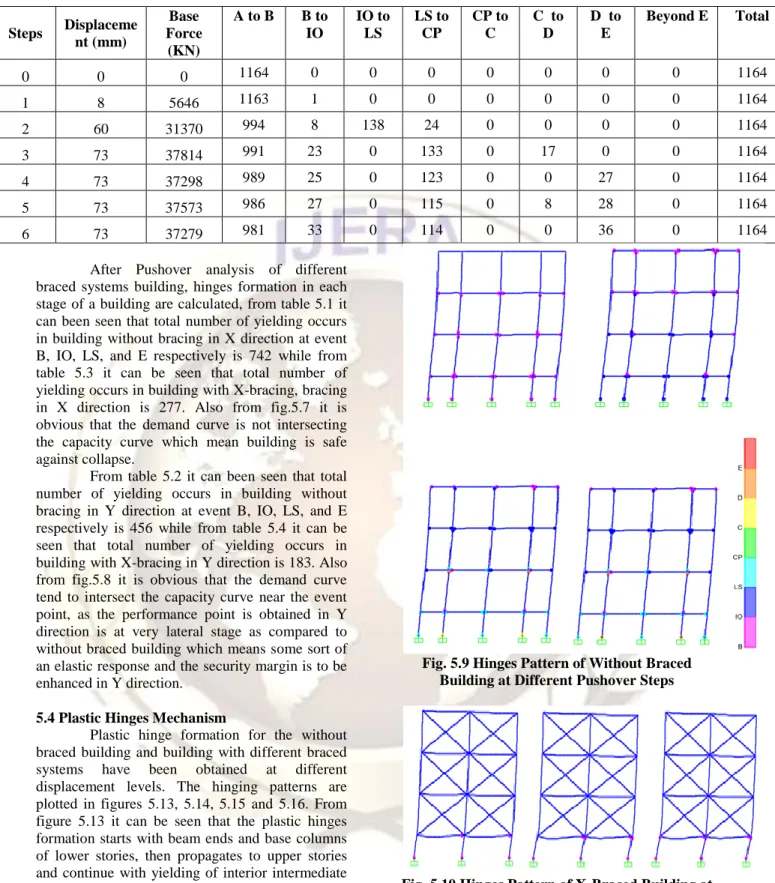
After Pushover analysis of different braced systems building, hinges formation in each stage of a building are calculated, from table 5.1 it can been seen that total number of yielding occurs in building without bracing in X direction at event B, IO, LS, and E respectively is 742 while from table 5.3 it can be seen that total number of yielding occurs in building with X-bracing, bracing in X direction is 277. Also from fig.5.7 it is obvious that the demand curve is not intersecting the capacity curve which mean building is safe against collapse.
From table 5.2 it can been seen that total number of yielding occurs in building without bracing in Y direction at event B, IO, LS, and E respectively is 456 while from table 5.4 it can be seen that total number of yielding occurs in building with X-bracing in Y direction is 183. Also from fig.5.8 it is obvious that the demand curve tend to intersect the capacity curve near the event point, as the performance point is obtained in Y direction is at very lateral stage as compared to without braced building which means some sort of an elastic response and the security margin is to be enhanced in Y direction.
5.4 Plastic Hinges Mechanism
Plastic hinge formation for the without braced building and building with different braced systems have been obtained at different displacement levels. The hinging patterns are plotted in figures 5.13, 5.14, 5.15 and 5.16. From figure 5.13 it can be seen that the plastic hinges formation starts with beam ends and base columns of lower stories, then propagates to upper stories and continue with yielding of interior intermediate columns in the upper stories.
Comparison of the figures 5.14, 5.15 and 5.16 reveals that the patterns of plastic hinge formation for the different braced building are quite similar. But since yielding occurs at events B, IO and LS respectively, the amount of damage in the three buildings will be limited
Fig. 5.9 Hinges Pattern of Without Braced Building at Different Pushover Steps
Fig. 5.10 Hinges Pattern of X-Braced Building at Different Pushover Steps
From figure 5.10 it can be seen that maximum plastic hinges are forming at the base storey because due to practical difficulty bracing cannot be provided below the ground level. Though the base force is increasing.
The graphs are plotted taking pushover steps as the abscissa and displacement as ordinate for different bracing systems.
5.5.1 Comparison of displacement at various pushover steps of without braced building and building with different bracing system.
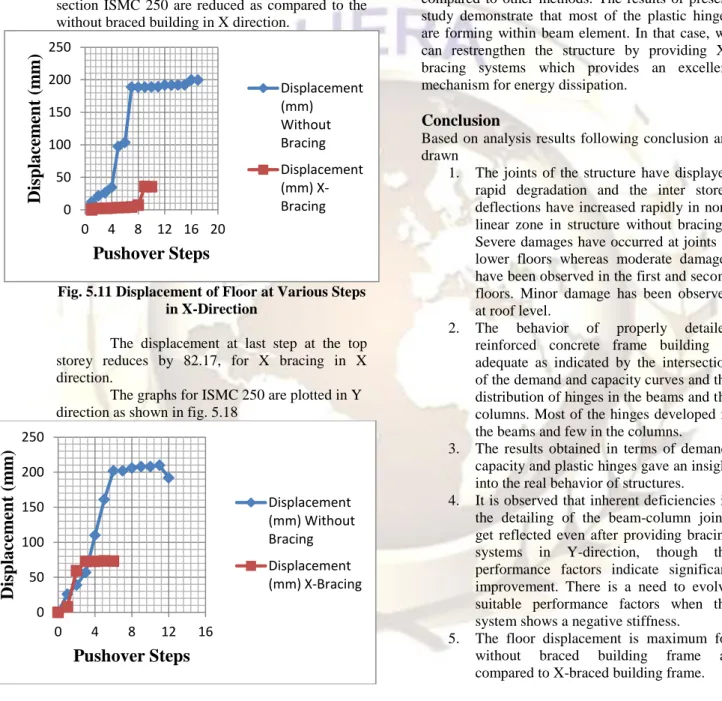
The graphs for ISMC 250 are plotted in X direction as shown in fig. 5.17
From fig. 5.17 it can be seen that lateral displacement in braced buildings with bracing section ISMC 250 are reduced as compared to the without braced building in X direction.
Fig. 5.11 Displacement of Floor at Various Steps in X-Direction
The displacement at last step at the top storey reduces by 82.17, for X bracing in X direction.
The graphs for ISMC 250 are plotted in Y direction as shown in fig. 5.18
Fig. 5.12 Displacement of Floor at Various Steps in Y-Direction
The displacement at last step at the top storey reduces by 61.93% for X bracing in Y direction.
V.
CONCLUSION
A. Introduction
For buildings that needed to be rehabilitated, it is easy to investigate the effect of different strengthening and retrofitting schemes. By using pushover analysis we can select the suitable strengthening and retrofitting schemes by changing member properties of weaker sections and carrying out the analysis again. For retrofitting pushover analysis provides better and economical solution as compared to other methods. The results of present study demonstrate that most of the plastic hinges are forming within beam element. In that case, we can restrengthen the structure by providing X-bracing systems which provides an excellent mechanism for energy dissipation.
Conclusion
Based on analysis results following conclusion are drawn
1. The joints of the structure have displayed rapid degradation and the inter storey deflections have increased rapidly in non- linear zone in structure without bracings. Severe damages have occurred at joints at lower floors whereas moderate damages have been observed in the first and second floors. Minor damage has been observed at roof level.
2. The behavior of properly detailed reinforced concrete frame building is adequate as indicated by the intersection of the demand and capacity curves and the distribution of hinges in the beams and the columns. Most of the hinges developed in the beams and few in the columns. 3. The results obtained in terms of demand,
capacity and plastic hinges gave an insight into the real behavior of structures. 4. It is observed that inherent deficiencies in
the detailing of the beam-column joints get reflected even after providing bracing systems in Y-direction, though the performance factors indicate significant improvement. There is a need to evolve suitable performance factors when the system shows a negative stiffness.
5. The floor displacement is maximum for without braced building frame as compared to X-braced building frame.
REFERENCES
[1] V.S.R. Pavan Kumar.Rayaprolu, P. Polu Raju, Incorporation of Various Seismic Retrofitting Techniques and Materials for RC Framed Building Using SAP2000,
International Journal of Emerging trends in 0 50 100 150 200 250 0 4 8 12 16 20
Disp
lace
m
en
t
(m
m
)
Pushover Steps
Displacement (mm) Without Bracing Displacement (mm) X-Bracing 0 50 100 150 200 250 0 4 8 12 16Disp
lace
m
en
t
(m
m
)
Pushover Steps
Displacement (mm) Without Bracing Displacement (mm) X-BracingEngineering and Development ISSN 2249-6149 Issue 2,Vol.3 (April-2012)
[2] Murty C.V.R. (2002). “Quantitative approach to seismic strengthening of RC frame buildings”, Seminar on seismic assessment and retrofitting of buildings at mumbai, 16th Feb 2002
[3] W. Huang, L.A. Toranzo-Dianderas, A Case Study Of Performance-Based Seismic Evaluation And Retrofit Of An Existing Hospital Building In California, U.S, The 14thWorld Conference on Earthquake Engineering October12-17, 2008, Beijing, China.
[4] Giuseppe Oliveto and Massimo Marletta, Seismic Retrofitting Of Reinforced Concrete Buildings Using Traditional And Innovative Techniques, ISET Journal of Earthquake Technology, Paper No. 454, Vol. 42, No. 2-3, June-September 2005, pp. 21-46
[5] Ghobarah, Rehabilitation of a Reinforced Concrete Frame Using Eccentric Steel Bracing, Engineering Structures Volume. 23 Pages 745–755, 2001.
[6] Keiji Kitajima, Hideaki Chikui, Hideaki Ageta and Hajime Yokouchi, Application To Response Control Retrofit Method By Means Of External Damping Braces Using Friction Dampers, 13th World Conference on Earthquake Engineering Vancouver, B.C., Canada August 1-6, 2004 Paper No. 2112
[7] Mitsukazu Nakanishi and Hiromi Adachi, Pseudo-Dynamic Test On An Existing R/C School Building Retrofitted With Friction Dampers, 13th World Conference on Earthquake Engineering Vancouver, B.C., Canada August 1-6, 2004 Paper No. 2112
[8] N. Lakshmanan, Seismic Evaluation And Retrofitting Of Buildings And Structures,
ISET Journal of Earthquake Technology, Paper No. 469, Vol. 43, No. 1-2, March-June 2006, pp. 31-48
[9] CERONI. Francesca, MANFREDI Gaetano, Maria Rosaria PECCE. A formulation of plastic hinge length in R.C. Columns. Department of Engineering, University of Sannio. Department of Analysis and Structural Design, University of Naples Federico II. 17 May 2007.
[10] X.-K. Zou, C.-M. Chan. Optimal seismic performance-based design of reinforced concrete buildings using nonlinear pushover analysis. Department of Civil Engineering, Hong Kong University of Science and Technology, Kowloon, Hong Kong, China. May 2005.
[11] Cosenza, E., Greco, C., Manfredi, G. An equivalent steel index in the assessment of
the ductility performances of the reinforcement. Ductility-Reinforcement, Comitè Euro- International du Béton, Bulletin N°242: 157-170, 1998.
[12] A. Shuraim, A. Charif. Performance of pushover procedure in evaluating the seismic adequacy of reinforced concrete frames. King Saud University
ashuraim@gmail.com.(2007)
[13] Collins K. R. (1995). “A reliability based dual level seismic design procedure for building structures”, Earthquake spectra, Vol. 11 No. 3, August.
[14] Sermin Oguz. A thesis on “EVALUATION OF PUSHOVER ANALYSIS PROCEDURES FOR FRAME STRUCTURES‖, April, 2005.
[15] Fib Bulletin of TG7.2 (in press). Displacement-based design and assessment, (2003).
[16] ATC (1996). Seismic Evaluation and Retrofit of Concrete Buildings, Volume 1, ATC – 40 Report, Applied Technology Council, Redwood City, California.
[17] FEMA (1997). NEHRP Guidelines for the Seismic Rehabilitation of Buildings, Developed by the Building Seismic Safety Council for the Federal Emergency Management Agency (Report No. FEMA 273), Washington, D.C)
[18] IS: 1893 (Part1): 2002. “Criteria for earthquake resistant design of structure “Bureau of Indian Standards, New Delhi. [19] IS: 456 (2000) “Indian standard code of
practice for plain reinforced concrete “Bureau of Indian standards, New Delhi. [20] P. Poluraju, Pushover Analysis Of
Reinforced Concrete Frame Structure Using SAP 2000, International Journal of Earth Sciences and Engineering ISSN 0974-5904, Volume 04, No 06 SPL, October 2011, pp. 684-690
[21] Egor Popov, Seismic Steel Framing Systems for Tall Buildings, Sino-American Symposium on Bridge and Structural Engineering, Volume. 17 (3), Sept. 1982. [22] A. Kadid∗ and A. Boumrkik, “PUSHOVER
ANALYSIS OF REINFORCED CONCRETE FRAME STRUCTURE”,
Asian Journal Of Civil Engineering (Building And Housing) Vol. 9, NO. 1 PAGES 75-83 (2008)
[23] Priestley, M. J. N. & Park, R. “Strength and Ductility of Concrete Bridge Columns Under Seismic Loading”’. ACI Structural Journal, Technical paper, Title n° 84-S8, 79(1), pp. 61-76, January-February, 1987.
[24] Rohit Bansal. A thesis on “PUSHOVER ANALYSIS OF REINFORCED CONCRETE FRAME”, July, 2011.
[25] Michael Fardis. (April 2005) “Seismic
Performance Assessment and Rehabilitation of Existing Buildings”. Proceedings of International workshop at European Laboratory for Structural Assessment (ELSA) I-21020 Ispra – Italy
[26] S. S. Vidhale. “SEISMIC RESPONSE OF STEEL BUILDING WITH LINEAR BRACING SYSTEM (A Software Approach)”. International Journal of Electronics, Communication & Soft Computing Science and Engineering ISSN: 2277-9477, Volume 2.
[27] Pankaj Agrawal, Manish Shrikhande. “Earthquake Resistant Design of Structures”.2006 PHI Learning Private Limited, New Delhi.
[28] www.mosttutorials.blogspot.com
[29] www.slideserve.com/delling/analysis-and-design-of-rc-buildings-using-sap-2000.