Pepperdine University
Pepperdine Digital Commons
Pepperdine Market Pulse Report
12-31-2012
2012 Q4 Market Pulse Report
John K. Paglia
Pepperdine University
Follow this and additional works at:
http://digitalcommons.pepperdine.edu/gsbm_pcm_pmp
Part of the
Corporate Finance Commons,
Entrepreneurial and Small Business Operations
Commons, and the
Finance and Financial Management Commons
This Article is brought to you for free and open access by Pepperdine Digital Commons. It has been accepted for inclusion in Pepperdine Market Pulse Report by an authorized administrator of Pepperdine Digital Commons. For more information, please [email protected].
Recommended Citation
Paglia, John K.,"2012 Q4 Market Pulse Report" (2012). Pepperdine University Private Capital Markets Project. http://digitalcommons.pepperdine.edu/gsbm_pcm_pmp/13
INTERNATIONAL BUSINESS BROKERS ASSOCIATION | M&A SOURCE | PEPPERDINE PRIVATE CAPITAL MARKETS PROJECT
MARKET
PULSE
Q U A R T E R LY S U R V E Y R E P O R T
Q 4 2 0 1 2
he International Business Broker Association (IBBA) and M&A Source present the Market Pulse Quarterly Survey Reportt with the support of the Pepperdine Private Capital Markets Project and the Graziadio School of Business and Management at Pepperdine University. The quarterly IBBA and M&A Source Market Pulse survey was created to gain an accurate understand-ing of the market conditions for businesses beunderstand-ing sold in the Main Street market (values $0-2 million) and lower middle market (values $2 million to $50 million). The national survey was conducted with the intent of providing a valuable resource to
MARKET SEGMENTS STUDIED
Figure 1
MAIN STREET LOWERMIDDLE MARKET
< 500K $2MM-$5MM $500K-$1MM $5MM-$50MM $1MM-$2MM
MARKETPULSE | FOURTH QUARTER 2012 | 2
KEY FINDINGS
BOOMER RETIREMENT:
For the fi rst time, baby boomer retirement was the number one reason driving business sales across all Main Street and lower middle market sectors. The second most common reason was burnout for Main Street and family issues for the lower middle market. (Previous 2012 studies showed that potential tax increases were the top sale driver for businesses valued over $5 million.)
“Boomer retirement will be a consistent trend, particularly now that 2009 is four years behind us for valuation purposes and the fi rst boomers are now 67 years old,” says Scott Bushkie, principal of Cornerstone Business Services. “It’s not surprising that burnout is another common theme. Many boomers would have sold in 2009 or 2010 but they got blindsided by the recession and had to hold on much longer than expected.”
MARKET CLARITY:
Overall, brokers and M&A advisors are feeling decidedly optimistic about market activity in 2013. They’re expecting activity to increase due to baby boomer retirements (35 percent) and market clarity following the presidential election (20 percent) and fi scal cliff resolutions (14 percent).
“People might not like everything that happened in Washington over the last few months, but at least now they have the answers they need to move forward,” says George Lanza, president of Plethora Businesses and chairman of IBBA. “Combine the U.S. election and fi scal uncertainty with the fi nancial mess over in Europe, and it’s not hard to see why many sellers were just sitting tight and waiting for the dust to clear in 2012.”
BUYER AND SELLER MARKETS:
Main Street M&A continues to shift away from a buyer’s market sentiment, suggesting a balancing of leverage in this sector. In Q4, 53 percent of Main Street brokers representing deals of $500K or less said they were operating in a buyer’s market. That’s a decline from 70 percent in Q2 and 60 percent in Q3.
TIME TO CLOSE:
The Q4 study showed that larger businesses take longer to close. In all Main Street sectors, the majority of companies (56 percent or better) sold in six months. For businesses in the lower middle market, the majority closed between eight months and two years.
“Companies in the lower middle market really need to be proactive in their planning,” said Kevin Dempsey, principal of Summa Financial Group and chairman of the M&A Source. “Burnout and family issues are leading reasons these owners sell, but when it takes a year or more to sell a company, you don’t want to be reacting to negative triggers— especially as buyers put the most value on your last 12 months of business performance.”
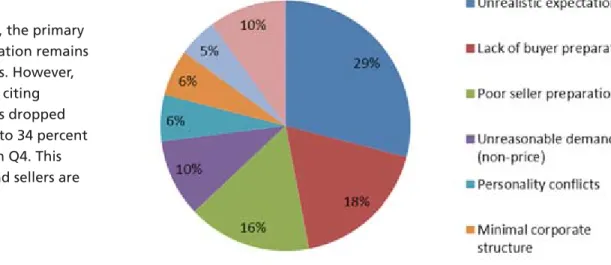
TERMINATIONS:
According to the study, the primary reason for deal termination remains unrealistic expectations. However, the number of brokers citing unrealistic expectations dropped from 50 percent in Q2 to 34 percent in Q3 and 29 percent in Q4. This may indicate buyers and sellers are getting closer on value
expectations.
MULTIPLES:
Multiples stayed nearly fl at for the fourth quarter, decreasing slightly for businesses valued at $500K or less and for those valued between $2 million and $5 million.
Figure 3: Multiples by Deal Size
MAIN STREET
SDE
MOST COMMON
EBITDA
MOST COMMON
< 500K 76% @ 1.5-2.5x 2.0 $500K - $1MM 80% @ 2.0-3.0x 2.5
$1MM - $2MM 79% @ 2.5-3.5x 3.5 38% @ 4.5-5.0x
LOWER MIDDLE MARKET
$2MM - $5MM 61% @ 3.5-5.0 3.5 $5MM+ 76% @ 4.5-6.0 4.5
* Up and down arrows indicate notable movement over Q3 2012.
SDE = Seller’s Discretionary Earnings
EBITDA = Earnings Before Interest, Taxes, Depreciation And Amortization
Transactions in the Main Street market are typically based on multiples of SDE, while those in the lower middle market are most commonly based on EBITDA. In some instances survey respondents reported multiples for both SDE and EBITDA.
The study also shows that fi nancing is relatively stable. In every sector, more than half of the survey respondents indicated “no change” in the fi nancing climate. However, there was an approximate 2-1 ratio of respondents indicating fi nancing was becoming more available vs. less available.
Likewise survey respondents indicated that they expect values will remain steady to increasing.
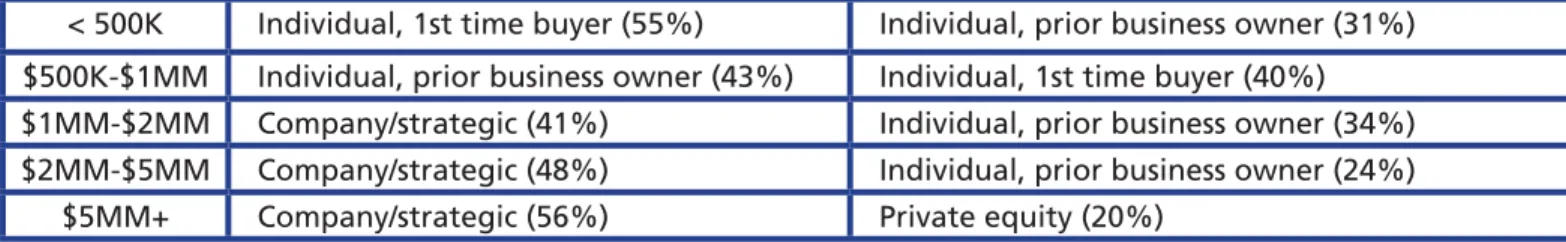
BUYER TYPES:
MARKETPULSE | FOURTH QUARTER 2012 | 4
Figure 4: Top Buyer Types
< 500K Individual, 1st time buyer (55%) Individual, prior business owner (31%) $500K-$1MM Individual, prior business owner (43%) Individual, 1st time buyer (40%) $1MM-$2MM Company/strategic (41%) Individual, prior business owner (34%) $2MM-$5MM Company/strategic (48%) Individual, prior business owner (24%)
$5MM+ Company/strategic (56%) Private equity (20%)
New for Q4, the study asked brokers and advisors to indicate buyer motivation. Not surprisingly, the top motivation for buyers of businesses valued at $1 million and less was “buying a job.” Above $1 million, buyers were focused on synergistic advantages.
“There are two strategies to grow, you either buy or you build. Many businesses are having a hard time building organically because of the tough economy, so companies are using acquisition to enhance their top and bottom lines,” says Dr. John Paglia, associate professor of fi nance and director of the Pepperdine Private Capital Markets Project at the Graziadio School of Business and Management.
For companies under $1 million, most buyers were located either within the same metro area or same state as the selling business. But for businesses valued over $1 million, buyer distance jumped considerably with more than half (55 percent) coming from out of state.
Figure 5: Buyer Proximity
IN CITY IN STATE IN COUNTRY INTERNATIONAL
< 500K 54% 87% 96% 4% $500K-$1MM 38% 73% 100% 0% $1MM-$2MM 25% 40% 95% 5% $2MM-$5MM 6% 43% 50% 7% $5MM+ 6% 44% 44% 6%
“Study results show that an advisor’s buyer reach becomes increasingly critical as deal size increases,” says Keith McLeod, president of Business Centre. “For businesses valued at $1 million or more, your advisor needs to have resources and connections outside your home state.”
BROKER ADDENDUM
LEAD GENERATION:
As usual, brokers and intermediaries report that their best new client arrived by referral (67 percent). But for the fi rst time they point to fi nancial advisors as the number one referral source (37 percent) followed by past clients (25 percent). In previous studies, fi nancial advisors had ranked third or even fourth behind clients, accountants, and attorneys.
A full copy of the IBBA and M&A Source Market Pulse Survey is available to IBBA and M&A Source members. This is a 70+page report of up-to-date relevant information on the state of the marketplace compiled by the Pepperdine Private Capital Markets Project under Dr. John Paglia. To receive your copy, please contact the IBBA and M&A Source headquarters at [email protected] or (888) 686-4222.
INTERNATIONAL BUSINESS BROKERS ASSOCIATION 3525 Piedmont Road
Building 5, Suite 300 Atlanta, GA 30305 USA
www.ibba.org
Scott Bushkie, CBI, M&AMI
Director
Pino Bacinello, CBI, M&AMI
Chairman
M&A SOURCE 3525 Piedmont Road Building Five, Suite 300 Atlanta, GA 30305 USA
www.masource.org
Karl Kirsch
Executive Director
Chet Walden, CBI, M&AMI
Chairman
PEPPERDINE PRIVATE CAPITAL MARKETS PROJECT Graziadio School of Business and Management Pepperdine University 6100 Center Drive Los Angeles, CA 90045 http://bschool.pepperdine.edu/privatecapital John Paglia, Ph.D. Director Linda A. Livingstone, Ph.D. Dean