Temi di discussione
(Working papers)
ec
em
b
er
2
00
8
698
um
be
r
Immigration and crime: an empirical analysis
The purpose of the Temi di discussione series is to promote the circulation of working papers prepared within the Bank of Italy or presented in Bank seminars by outside economists with the aim of stimulating comments and suggestions.
The views expressed in the articles are those of the authors and do not involve the responsibility of the Bank.
Editorial Board: Patrizio Pagano, Alfonso Rosolia, Ugo Albertazzi, Claudia Biancotti, Giulio Nicoletti, Paolo Pinotti, Enrico Sette, Marco Taboga, Pietro Tommasino, Fabrizio Venditti.
IMMIGRATION AND CRIME: AN EMPIRICAL ANALYSIS
by Milo Bianchi
*, Paolo Buonanno
**and Paolo Pinotti
***Abstract
In this paper we examine the empirical relationship between immigration and crime
across Italian provinces during the period 1990-2003. Drawing on police data, we first
document that the size of the immigrant population is positively correlated with the
incidence of property crimes and with the overall crime rate. We then use instrumental
variables based on migration towards other European countries to identify the causal impact
of exogenous changes in the immigrant population of Italy. According to these estimates,
immigration increases only the incidence of robberies and has no effect on all other types of
crime. Since robberies represent a very small fraction of all criminal offences, the effect on
the overall crime rate is not significantly different from zero.
JEL Classification
: F22, J15, K42, R10.
Keywords
: immigration, crime.
Contents
1. Introduction... 3
2. Immigration and crime in Italy: measurement and characteristics ... 5
3. Panel analysis... 7
4. Causality ... 8
5. Robustness ... 11
6. Conclusions... 12
References ... 14
Appendix ... 17
Figures and tables ... 19
*
Paris School of Economics **
Università di Bergamo. ***
1
Introduction
1Immigration is a contentious issue in all destination countries for at least two reasons. First, worker flows from countries characterized by a different composition of the labor force may have significant redistributive consequences for native population. Second, there are widespread concerns that immigrants increase crime rates. While the economic literature has devoted much attention to the first issue (Borjas, 1994; Friedberg and Hunt, 1995; Bauer and Zimmermann, 2002; Card, 2005) the second one has remained largely unexplored.
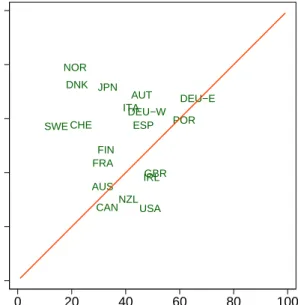
At the same time, citizens and policymakers in host countries seem more concerned about the impact of immigrants on crime. Figure 1 shows the results of the National Identity survey carried on in 1995 and 2003 by the International Social Survey Programme. It emerges clearly that the majority of population in OECD countries is worried that immigrants increase crime rates. In most cases this fraction is greater than that of people afraid of being displaced from the labor market. These perceptions may have far-reaching consequences for immigration policies (Bauer et al., 2000).
According to economic theories of crime (Becker, 1968; Ehrlich, 1973) immigrants and natives may have different propensities to commit crime because they face different legitimate earnings opportunities, different probabilities to be convicted and different costs of conviction. However, the direction of such effects is unclear. For example, immigrants may experience worse labor market conditions (LaLonde and Topel, 1991; Borjas, 1998) but higher costs of conviction (Butcher and Piehl, 2005). Hence, identifying the effect of immigration is ultimately an empirical issue. Somewhat surprisingly, however, there is little systematic evidence in this respect.
In this paper we estimate the causal effect of immigration on crime across Italian provinces during the period 1990-2003. For this purpose, we draw on police administrative records to document the patterns of criminal offenses, disaggregated along various typologies, and of immigration, both in its regular and irregular component.
As we discuss in the next Section, Italy displays several interesting features for our analy-sis. First, during the last few years Italy has experienced a considerable increase in migration pressures, mostly as a consequence of political turmoil in neighboring countries. Similarly to many other receiving countries, this phenomenon resulted in substantial concerns at the social and political level, mainly because of the alleged relationship between immigration and crime. Second, during our sample period Italian authorities have implemented several
1
We want to thank Giuseppe Casamassima of the Italian Ministry of Interior for the data on residence permits. We also thank Massimiliano Bratti, Matteo Cervellati, Antonio Ciccone, Federico Cingano, Francesco Drago, Giovanni Mastrobuoni, Ugo Melchionda, Franco Peracchi, Alfonso Rosolia, Enrico Sette, Andrea Tiseno and seminar participants at the Bank of Italy, CEIS Tor Vergata, Paris School of Economics, ESPE (London), NASM (Pittsburgh), FEMES (Singapore), EEA (Milan) and AIEL (Brescia) for many useful comments. All errors are our responsibility. Financial support from CEPREMAP and from Region Ile-de-France (Milo Bianchi) is gratefully acknowledged. The opinions expressed herein are those of the authors and do not necessarily represent those of the Bank of Italy.
massive regularizations of previously unofficial immigrants, which allow for an estimate of the irregular component of migration.
In Section 3 we start our econometric analysis with an OLS estimation in which we control extensively for other determinants of criminal activity, as well as for province- and year-specific unobserved heterogeneity. According to these estimates, a 1% increase in the total number of immigrants is associated with a 0.1% increase in the total number of criminal offenses. Once we distinguish among categories of crime, the effect seems particularly strong for property crimes, and in particular for robberies and thefts.
We go on in Section 4 by asking whether this evidence can be attributed to a causal effect of immigration on crime. Any interpretation in this sense must take into account that the location choice of immigrants within the destination country may respond to unobserved demand-pull factors that are also correlated with crime. As a result, OLS estimates may be biased.
In order to solve this problem, we exploit differences in the intensity of migration by origin country as a source of exogenous variation in the distribution of immigrants across Italian provinces. In particular, we use changes of immigrant population by nationality in the rest of Europe as an instrument for changes of immigrant population in Italy. Our identification strategy relies on the fact that the supply-push component of migration by nationality is common to flows toward all destination countries. At the same time, flows toward the rest of Europe are exogenous to demand-pull factors in Italian provinces. Variation across provinces of supply-driven shifts of immigrant population results from differences in the beginning-of-period distribution of immigrants by origin country. Indeed, first stage estimates confirm that our instrument provides a strongly statistically significant prediction of migration to Italy.
Once we take into account the endogeneity of immigrants’ distribution across provinces, the estimated effect of immigration on neither total nor property crimes is significantly dif-ferent from zero. Distinguishing among different types of property crime, the estimated coefficient is still statistically significant for robberies. However, the latter represent only a very minor fraction of all crimes in our sample, which explains why the effect on the total crime rate is not statistically significant.
In Section 5, we discuss the robustness of our results with respect to measurement error, spatial correlation and heterogeneity across different nationalities; Section 6 concludes.
Even though previous evidence on immigration and crime is very scant, there are some previous papers related to this work. Butcher and Piehl (1998b, 2005) find that current U.S. immigrants have lower incarceration rates than natives, while the pattern seems reversed for immigrants in the early 1900s (Moehling and Piehl, 2007). At the aggregate level, Butcher and Piehl (1998a) look at a sample of U.S. metropolitan areas over the 1980s and conclude that new immigrants inflows had no significant impact on crime rates.
2
Immigration and crime in Italy: measurement and
charac-teristics
Immigration to Italy displays several interesting features for the purpose of our analysis. First, it is a very recent phenomenon, which basically started in the early 1980s and took off during the 1990s. The first law regulating the inflows of foreigners was approved in 1990, later amended in 1998 and 2002. Throughout this period, Italian migration policy has remained grounded on the residence permit, which allows the holder to stay legally in the country for a given period of time. We have drawn directly on police administrative records for recovering the number of valid residence permits by province and nationality during the period 1990-2003. These data serve as our measure of legal immigration.
Second, immigration has increased dramatically over this period. The number of residence permits rose by a factor of 5, from 436,000 in 1990 (less than 1% of total population) to over 2.2 millions in 2003 (4% of population). Such growth was significantly driven by push factors in neighboring countries, like the collapse of Soviet Union and the Balkan Wars (see Del Boca and Venturini, 2003). Overall, immigration from Eastern Europe grew at a rate of 537% during the period 1990-2003, as compared to 134% from Northern Africa and 170% from Asia. Accordingly, our estimating strategy will exploit such push factors to identify the causal effect of immigration on crime.
Third, during this period Italy implemented several regularizations, which offered irreg-ular immigrants the possibility to obtain a residence permit. In particirreg-ular, regirreg-ularizations in 1995, 1998, and 2002 involved 246, 217 and 700 thousand individuals, respectively. For our purposes, regularizations are important as they provide snapshots of irregular migration. During these episodes, in fact, immigrants had clear incentives to report their irregular sta-tus. Hence, underreporting may be less serious and less correlated with other variables than in survey data and in apprehension statistics.2
Therefore, we obtained from police administrative records also the demands for regular-ization presented in 1995, 1998 and 2002. As it turns out, the distribution of regular and irregular immigrants are tightly related. In particular, the ratio of the two is very stable within provinces and (regularization) years. In order to see this, let M IGRit and IRRit be the number of regular and irregular immigrants in province iand yeart, respectively. Then, we predict the latter based on the OLS regression
[
IRRit= ˆµiM IGRit+ ˆµtM IGRit+ ˆνit,
where ˆµi and ˆµtare province- and year-specific estimated coefficients, respectively, and ˆνitis the estimated residual. Figure 2 shows that the difference between IRRit and IRR[it at the
2In any case, all these alternative measures of irregular migration are strongly correlated with each other,
province-year level is almost negligible. Actually, the variance of ˆνit is less than 2% of total variance. It follows that
M IGR∗it P OPit = M IGRit P OPit + IRRit P OPit ≈(1 +µi+µt) M IGRit P OPit ,
where M IGR∗it and P OPit are total immigrants and population in each province-year, re-spectively. Taking logarithms on both sides delivers
migr∗it=µi+µt+migrit+υit. (1)
where migr∗it and migrit are, respectively, the logarithms of total and regular immigrants over population, and υit is an error term. The OLS estimated coefficient of migrit is 0.92 (R2 = 99%), which confirms that (after controlling for province and year fixed effects) regular immigrants are approximately proportional to total immigrant population in each province-year. Since total immigrants would be unobserved out of regularization years, we will use the (log of) regular immigrants instead.
Turning to measures of criminal activity, we look at crimes reported by the police to the judiciary authority, which are published yearly by the Italian Statistics Institute (ISTAT). These data allow to distinguish among several types of criminal offenses: violent crimes, property crimes (robbery, common theft, car theft) and drug-related crimes. Availability of these data determined our sample period, 1990-2003. In 2004, in fact, a new national crime recording standard has been adopted, which implies a lack of comparability of data before and after that year (ISTAT, 2004, p.27).
In general, a major drawback of crime data is measurement error, caused for instance by under-reporting, heterogeneous law enforcement, and so on. Following a standard approach, we assume that, first, the number of reported crimes, CRIM Eit, is proportional to the true (unobserved) number of committed crimes,CRIM Eit∗; second, the constant of proportionality does not vary within provinces and years. It follows that
crime∗it=θi+θt+crimeit, (2)
where crime∗it and crimeit are, respectively, the logarithms of actual and reported crimes over total population, and θi and θt are province and year fixed effects. Therefore, we will use crimeit as a proxy for the true (unobserved) crime rate (Ehrlich, 1996; Levitt, 1996). Accordingly,total,violent,property and drugwill denote the logarithms of reported crimes over total population for each category of criminal offenses.
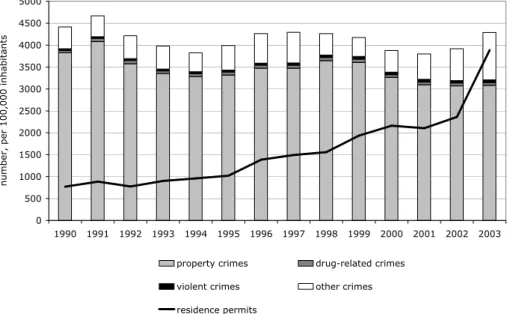
At a first glance, criminal activity and immigration are not systematically correlated over time (see Figure 3). On the other hand, immigration appears to be positively associated with crime across provinces; in particular, both tend to be higher in the North (Figure 4). However, both variables could respond to other (omitted) factors. For instance, higher wealth
in Northern Italy could encourage both immigration and property crimes, which represent 83% of all criminal offenses in our sample. Therefore, in the next section we move beyond simple correlations and into multivariate econometric analysis.
3
Panel Analysis
Identifying the effect of migration on crime is complicated by the fact that both variables are simultaneously determined in equilibrium. To address this issue, we start by controlling for other variables that may affect both immigration and crime, along with province- and year-specific unobserved heterogeneity. We thus assembled annual observations for all 95 Italian provinces during the period 1990-2003.3
Our main estimating equation is
crimeit=βmigrit+γ0Xit+φi+φt+εit, (3)
where crimeit is the log of the crime rate reported by the police in province iduring year t;
migrit is the log of immigrants over population; Xit is a set of control variables; finally, φi and φtare province- and year-specific unobserved fixed effect, while εit is an error term. We are mainly interested in identifying coefficient β.
The set of observablesXitcomprises demographic, socioeconomic and politico-institutional determinants of crime.4 Demographic variables include the log of resident population in the province, pop. Since equation (3) includes province fixed effects, pop implicitly controls for population density, which is considered a key determinant of the level of criminal activity (Glaeser and Sacerdote, 1999). For the same reason, we control for the share of population living in cities with more than 100,000 inhabitants,urban. Finally, since young men are said to be more prone to engage in criminal activities than the rest of the population (Freeman, 1991; Levitt, 1998; Grogger, 1998), we add the percentage of men aged 15-39, male1539.
Turning to the socioeconomic variables, we include the (log of) real GDP per capita,gdp, and the unemployment rate, unemp. These factors proxy for the legitimate and illegitimate earning opportunities (Ehrlich, 1973; Raphael and Winter-Ember, 2001; Gould et al., 2002). The probability of apprehension captures instead the expected costs of crime. As a proxy for such a probability, we use the clear−up rate, defined as the ratio of crimes cleared up by the police over the total number of reported crimes, for each category of crime (Ehrlich, 1996). The political orientation of the local government may affect the amount of resources devoted to crime deterrence and at the same time immigration restrictions at the local level.5
3
Italian provinces correspond to level 3 in the Eurostat classification (Nomenclature of Territorial Units for Statistics); they are comparable in size to U.S. counties. In 1995, 8 new provinces were created by secession. In order to keep our series consistent, we attribute their post-1995 data to the corresponding pre-1995 province.
4Freeman (1999), Eide et al. (2006) and Dills et al. (2008) review the empirical literature on the
determi-nants of crime.
5
We measure the ideology of the local government with the variable partisan, which takes higher values the more the local government leans toward the right of the political spectrum. Finally, fixed effects control for other unobserved factors that do not vary within provinces or years, including constants µ’s andθ’s in equations (1) and (2), respectively.
All variables’ detailed definitions and sources are presented in the Appendix. Table 1 shows some descriptive statistics and Table 2 reports the correlation matrix among all de-pendent and explanatory variables. The univariate correlation between the log of immigrants and crimes over population is positive for all types of crime.
OLS estimates on equation (3) are presented in Table 3 and suggest that the total crime rate is significantly correlated with the incidence of immigrants in the population. Such relationship is robust to controlling for other determinants of crime. According to these findings, a 1% increase in immigrant population is associated with a 0.1% increase of total crime.
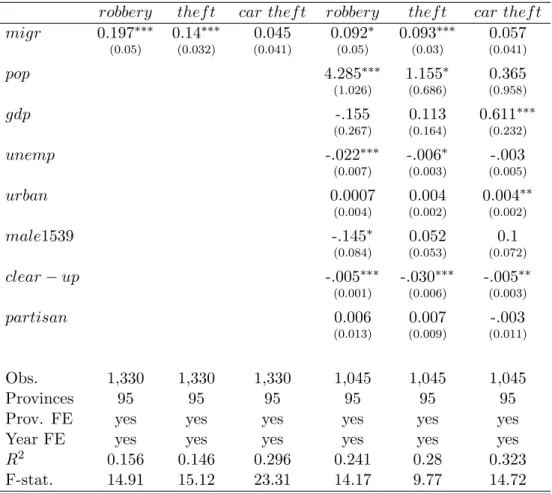
Distinguishing among types of crime, the effect is driven by property crimes (while violent and drug-related crimes are unaffected by immigration). In order to better uncover this rela-tionship, in Table 4 we disaggregate property crimes further. It turns out that immigration increases the incidence of robberies and thefts. Since the latter represent about 60% of total crimes in our sample, the relationship between immigration and property crimes may be the main channel through which immigrants increase the crime rate.
However, there could be several reasons why immigrant population is systematically cor-related with property crimes, some of which may not be adequately captured by control variables. Therefore, identifying causality requires a source of exogenous variation in immi-grant population, an issue that we tackle in the next Section.
4
Causality
Even after controlling for other determinants of crime and for fixed effects, the distribution of immigrant population across provinces could be correlated with the error term for at least two reasons. First, our set of controls could neglect some time-varying, possibly unobserved demand-pull factors that are also correlated with crime. For instance, improvements in labor market conditions that are not adequately captured by changes in official unemployment and income could increase immigration and decrease crime, which would bias OLS estimates downward. On the other hand, economic decline could attract immigrants to some areas (e.g. because of declining housing prices) where crime is on the rise, which would bias OLS estimates upward. Finally, changes in crime rates across provinces could have a direct effect on immigrants’ location.
In order to take these concerns into account, we adopt a Two-Stage-Least-Squares (2SLS) approach that uses the (exogenous) supply-push component of migration by nationality as an
instrument for shifts in immigrants population across Italian provinces. Supply-push factors are all events in origin countries that increase the propensity of population to emigrate; exam-ples include economic crises, political turmoil, wars and natural disasters (see, for instance, Card, 1990; Friedberg, 2001; Angrist and Kugler, 2003; Munshi, 2003; Saiz, 2007). Since these are both important in determining migration outflows and independent of regional dif-ferences within the host country, they have often been used as a source of exogenous variation in the distribution of immigrant population. In particular, several papers have constructed outcome-based measures of supply-push factors using total migration flows by nationality toward the destination country of interest.6
In principle, however, since new immigrants of a given nationality tend to settle into the same areas as previous immigrants from the same country (see e.g. Munshi, 2003; Jaeger, 2006; McKenzie and Rapoport, 2007), total flows by nationality could be still correlated with local demand-pull factors.7 For this reason, our instrument will be based on bilateral migration flows toward European countries other than Italy. Specifically, we first take within-province differences of equation (1) and decompose ∆migrit =migrit−migrit−1 as follows:
∆migrit≈ X
n
ωnit−1×∆ lnM IGRnit−∆popit, (4)
where the superscript n denotes nationalities and ωnit−1 =M IGRnit−1/M IGRit−1. The first term on the right-hand side is the sum of log-changes of immigrants from countryninto des-tination provincei, weighted at beginning-of-period nationality shares within each province. These depend on both supply-push factors in each origin country (which affect that national-ity in all provinces) and demand-pull factors in each province (which affect all nationalities in that province. In order to exclude the latter, we substitute ∆ lnM IGRnitwith the log-change of immigrants of nationalityn in the rest of Europe, ∆ lnM IGRn.
Hence, we define the predicted log-change of immigrants over population in each province as
\
∆migrit=X n
ωitn−1×∆ lnM IGRn. (5)
Since demand-pull factors in other European countries can be reasonably thought as exoge-nous to variation between Italian provinces, the correlation between ∆migrit and ∆\migrit must be due solely to supply-push factors in origin countries.
To construct our instrument we use the log changes of immigrant population from 13 origin countries in 11 European countries using decennial census data in the host countries.8 Figure
6
See, among others, Card (2001), Lewis (2005) and Ottaviano and Peri (2006).
7
In the limit, if all immigrants from a given country moved to the same Italian province, it would be impossible to disentangle push and pull factors.
8
Ideally, one would use total outflows from origin countries (possibly excluding inflows to Italy) as a measure of supply-push factors. Unfortunately, these data are generally not available. The destination countries for which we obtained census data are Austria, Belgium, Denmark, Finland, France, Greece, Netherlands, Norway, Spain, Sweden and Switzerland. Information on the stock of immigrants in those countries was
5 shows that the patterns of immigration toward the rest of Europe resemble those observed in Italy, which points at the importance of supply-push factors. Indeed, the univariate regression confirms that our instrument fits well the actual changes of immigrant population across provinces over the 1990s,
∆migrit= 0.671
(0.094)+ 0(0..673178)
\ ∆migrit.
where the numbers in parenthesis are the standard errors of the estimated coefficients. The F-statistic of the regression is equal to 14.24, which is above the lower bounds indicated by the literature on weak instruments (see Bound et al., 1995; Stock and Yogo, 2002).
Once equipped with this instrument for immigrant population, we turn to examine its effect on crime rates in the second stage. The results are reported in Tables 5 and 6. For the sake of comparability between OLS and 2SLS, in each table we also present OLS estimates on the cross section of log changes between 1991 and 2001.
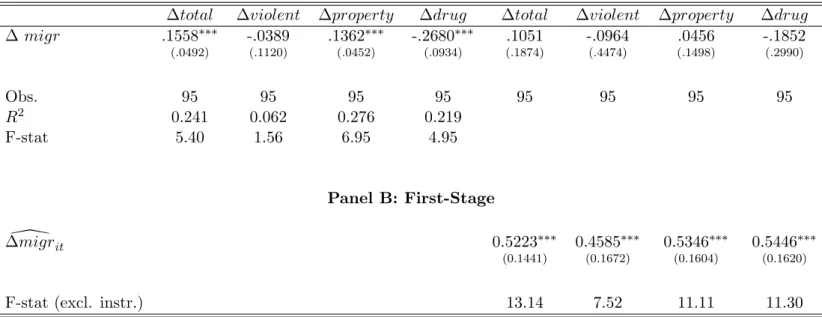
While the OLS estimates on 10-years changes are broadly consistent with panel estimates using all years, the 2SLS estimates present significant differences. First, the effect of immi-gration on the total number of criminal offenses is smaller and not statistically significant anymore, and the same is true for property crimes. Once we distinguish among different ty-pologies of property crimes (Table 6), immigration has no significant effect on thefts. On the other hand, the effect on robberies is still significant. Indeed, its magnitude is much greater than the OLS estimate. This finding may point at the existence of demand-pull factors (not captured by control variables) that have opposite effects on immigration and on the incidence of robberies.9
Overall, these results suggest that the causal effect of immigration on either violent, property or drug-related crimes is not significantly different from zero. Robberies are the only type of criminal activity that we found to be positively and significantly affected by immigration. According to our estimates, the incidence robberies varies approximately one-to-one (in percentage) with the ratio of immigrants over population. Yet, within our sample robberies represent only 1.8% and 1.5% of property and total crimes, respectively, which explains why the incidence of neither property nor total crimes is significantly related to immigration.
available for the following nationalities: Albania, Algeria, Brazil, China (excluding Hong Kong), Egypt, India, Morocco, Nigeria, Pakistan, Philippines, Romania, Tunisia, Former Yugoslavia. Overall, immigrants from these countries accounted for 48% and 56% of Italian residence permits in 1991 and 2001, respectively.
9
An alternative explanation could be that OLS estimates suffer from attenuation bias due to measurement errors in immigrant population. However, if this was the reason, we should observe an analogous bias for all types of crime, which does not seem to be the case.
5
Robustness
Our findings may be subject to several caveats, the most significant of which concern the measurement of immigrant population. A first issue relates to its composition by nationality. In order to avoid arbitrary classifications, our measure includes all residence permits, regard-less of immigrants’ origin countries. On the other hand, most crime concerns are directed toward immigrants from developing countries. While it is beyond the scope of this paper to investigate the relationship between nationality and propensity to crime, one may won-der whether adopting this broawon-der definition introduces error in the measurement of those immigrants that could be more at risk of committing crime.10 Therefore, we checked the robustness of our estimates to using only residence permits awarded to immigrants from de-veloping countries, migrdcit. The results are presented in Tables 7 and 8, and are remarkably similar to those obtained using all residence permits.
Also, differences among nationalities could explain the differences between OLS and 2SLS estimates. The latter are based on a subset of nationalities (those for which we found Cen-sus data for other European countries). Therefore, if the excluded nationalities had higher propensity to crime than those included in the instrument, that would cause the observed drop in magnitude and significance from OLS to 2SLS (Imbens and Angrist, 1994). In order to check whether that is the case, we run again OLS regressions including in the measure of immigration only those nationalities included in the instrument. Results are reported in Tables 9 and are not significantly different from those in Tables 5 and 6. Hence, basing our instrument on a subset of nationalities does not drive the difference between 2SLS and OLS estimates.
Another issue relates to the dimension of irregular immigration in Italy. As discussed in Section 3, we used demands for regularization to infer the distribution of irregular immigrants, arguing that this approach minimizes under-reporting. In principle, however, one can not exclude that immigrants self-select into regularization, which would introduce measurement error into equation (1). In particular, if immigrants who are more at risk of committing crime are also less likely to apply for a regular permit, we would be understating immigrants exactly where they contribute the most to crime, which in turn would bias the coefficient of
migr downward.
For this reason, we looked also at apprehensions of irregular immigrants (as recorded by Ministero dell’Interno (2007)) which do not depend on self-selection. Indeed, after controlling for province- and year-specific constants (which are always included in our specifications) the log of apprehensions is positively and significantly related to the log of demands for regularization. In particular, the OLS estimated coefficient of the univariate regression is
10
This measurement issue is particularly relevant for Italy. In our sample, about 85% of all immigrants from outside developing countries came from U.S. and Switzerland. These are very peculiar groups: the first includes mostly U.S. military servants, the second Swiss citizens that commute daily between Switzerland and Italy.
0.35, the t-ratio is 3.87 and the R2 is 85%. Therefore, apprehension- and regularization-based measures of irregular immigration seem consistent with each other. At the same time, regularizations provide a more representative picture of the phenomenon.11
In addition, the 2SLS approach adopted in Section 5 would attenuate any bias due to under-reporting of irregular immigrants. In fact, if both regular and irregular immigrants of the same nationality cluster into the same areas, then our instrument provides a measure for the predicted log-change of total immigrants that depends solely on geographic distribution and supply-push factors by nationality.
Finally, mobility across the borders of different provinces may give rise to spatial corre-lation in provincial crime data. In line with the literature on spatial econometrics and crime (Anselin, 1988; Gibbons, 2004; Zenou, 2003), we thus control for spatially lagged crime rates. These consist of weighted averages of crime rates in neighboring provinces. In particular, crime in province i is assumed to depend also on crime observed in any other province j, weighted by the inverse of the distance between their capital cities. The results, presented in Table 10, are consistent with those in our baseline specification. Hence, spatial correlation does not affect affect our results. This is probably due to the fact that provinces are rather large geographical areas, so that crime trips occur within rather than across provinces.
6
Conclusions
In this paper, we investigated the causal impact of immigration on crime across Italian provinces during the 1990s. According to our estimates, total criminal offenses as well as most types of crime are not related to the size of immigrant population once endogeneity is taken into account.
We view our contribution as a first step towards a better understanding of this relation-ship. There are several ways in which our analysis can be extended in search of more detailed mechanisms, and we sketch only a few here.
First, one can explore natives’ response to an increase in immigration. Our result, in fact, could be due to the fact that immigrants and natives have similar propensities to commit crime and/or there is substitution between immigrants’ and natives’ crime. 12 Moving in this direction would require more detailed criminal statistics, which allow to distinguish the nationality of the offender.13
Second, we estimate the average effect of immigration conditional on its current composi-tion. However, this effect is probably different for regular and irregular immigrants. Indeed, it would be extremely interesting to estimate separately the effect of the two. But while the
11In 1995 there were less than 64,000 apprehensions and 260,000 demands for regularization; this ratio was
61,000 over 250,000 in 1998 and 106,000 over 700,000 in 2002
12Borjas et al. (2006) argues that recent immigrants have contributed to the criminal activity of native black
males in the U.S. by displacing them from the labor market.
13
strong correlation between the two is useful for recovering the variation in total immigrants using only the regular ones, it does not allow to disentangle their separate effects.
A better understanding of such mechanisms seems crucial also for policy prescriptions. In fact, any change in migration restrictions is likely to affect both the size and composition of immigrant population (Bianchi, 2007; Giordani and Ruta, 2008). Therefore, its effect may differ from the one estimated by keeping immigrants’ composition constant. This effect has to be considered before arguing in favor or against tighter immigration restrictions.
References
Angrist, J. D. and A. D. Kugler (2003). Protective or counter-productive? labour market institutions and the effect of immigration on eu natives. Economic Journal 113(488), 302–331.
Anselin, L. (1988).Spatial Econometrics: Methods and Models. Dordrecht: Kluwer Academic Publishers.
Bauer, T. K., M. Lofstrom, and K. F. Zimmermann (2000). Immigration policy, assimila-tion of immigrants and natives’ sentiments towards immigrants: Evidence from 12 oecd-countries. IZA Discussion Papers 187, Institute for the Study of Labor (IZA).
Bauer, T. K. and K. F. Zimmermann (Eds.) (2002). The Economics of Migration. Volume I-IV. Edward Elgar Publishing Ltd.
Becker, G. S. (1968). Crime and punishment: An economic approach. Journal of Political Economy 76(2), 169–217.
Benoit, K. and M. Laver (2006). Party Policy in Modern Democracies. London: Routledge. Bianchi, M. (2007). Immigration policy and self-selecting migrants. PSE Working Paper No.
2007-41.
Borjas, G. J. (1994). The economics of immigration. Journal of Economic Literature 32(4), 1667–1717.
Borjas, G. J. (1998). The economic progress of immigrants. NBER Working Paper No. 6506.
Borjas, G. J., J. Grogger, and G. H. Hanson (2006). Immigration and african-american employment opportunities: The response of wages, employment, and incarceration to labor supply shocks. NBER Working Paper No. 12518.
Bound, J., D. A. Jaeger, and R. M. Baker (1995). Problems with instrumental variables estimation when the correlation between the instruments and the endogeneous explanatory variable is weak. Journal of the American Statistical Association, 90(430), 443–450. Butcher, K. F. and A. M. Piehl (1998a). Cross-city evidence on the relationship between
immigration and crime. Journal of Policy Analysis and Management 17(3), 457–493. Butcher, K. F. and A. M. Piehl (1998b). Recent immigrants: Unexpected implications for
crime and incarceration. Industrial and Labor Relations Review 51(4), 654–679.
Butcher, K. F. and A. M. Piehl (2005). Why are immigrants’ incarceration rates so low? evidence on selective immigration, deterrence, and deportation. Federal Reserve Bank of Chicago WP-05-19.
Card, D. (1990). The impact of the mariel boatlift on the miami labor market. Industrial and Labor Relations Review 43(2), 245–257.
Card, D. (2001). Immigrant inflows, native outflows, and the local labor market impacts of higher immigration. Journal of Labor Economics 19(1), 22–64.
Card, D. (2005). Is the new immigration really so bad? Economic Journal 115(507), 300–323. Del Boca, D. and A. Venturini (2003). Italian migration. IZA Discussion Paper No. 938.
Dills, A. K., J. A. Miron, and G. Summers (2008). What do economists know about crime? NBER Working Paper No. 13759.
Ehrlich, I. (1973). Participation in illegitimate activities: A theoretical and empirical inves-tigation. Journal of Political Economy 81(3), 521–65.
Ehrlich, I. (1996). Crime, punishment, and the market for offenses. Journal of Economic Perspectives 10(1), 43–67.
Eide, E., P. H. Rubin, and J. M. Shepherd (2006). Economics of Crime. Now Publishers. Freeman, R. B. (1991). Crime and the employment of disadvantaged youths. NBER Working
Paper No. 3875.
Freeman, R. B. (1999). The economics of crime. In O. Ashenfelter and D. Card (Eds.),
Handbook of Labor Economics, Chapter 52, pp. 3529–3571. Elsevier.
Friedberg, R. M. (2001). The impact of mass migration on the israeli labor market. Quarterly Journal of Economics 116(4), 1373–1408.
Friedberg, R. M. and J. Hunt (1995). The impact of immigrants on host country wages, employment and growth. Journal of Economic Perspectives 9(2), 23–44.
Gibbons, S. (2004). The costs of urban property crime.Economic Journal 114(499), 441–463. Giordani, P. E. and M. Ruta (2008). Prejudice and immigration. Levine’s bibliography,
UCLA Department of Economics.
Glaeser, E. L. and B. Sacerdote (1999). Why is there more crime in cities? Journal of Political Economy 107(6), 225–229.
Gould, E. D., B. A. Weinberg, and D. B. Mustard (2002). Crime rates and local labor market opportunities in the united states: 1979-1997. Review of Economics and Statistics 84(1), 45–61.
Grogger, J. (1998). Market wages and youth crime. Journal of Labor Economics 16(4), 756–91.
Imbens, G. W. and J. D. Angrist (1994). Identification and estimation of local average treatment effects. Econometrica 62(2), 467–75.
ISTAT (2004). Statistiche giudiziarie penali. Technical report, Italian Statistics Institute.
Jaeger, D. A. (2006). Green cards and the location choices of immigrants in the united states, 1971-2000. IZA Discussion Paper No. 2145.
LaLonde, R. J. and R. H. Topel (1991). Immigrants in the american labor market: Quality, assimilation, and distributional effects. American Economic Review 81(2), 297–302. Levitt, S. D. (1996). The effect of prison population size on crime rates: Evidence from prison
overcrowding litigation. Quarterly Journal of Economics 111(2), 319–51.
Levitt, S. D. (1998). Juvenile crime and punishment. Journal of Political Economy 106(6), 1156–1185.
Lewis, E. (2005). Immigration, skill mix, and the choice of technique. Working Papers 05-8, Federal Reserve Bank of Philadelphia.
McKenzie, D. and H. Rapoport (2007). Self-selection patterns in mexico-u.s. migration: The role of migration networks. CReAM Discussion Paper No. 0701.
Ministero dell’Interno (2007). Rapporto sulla criminalit`a in Italia. Analisi, Prevenzione, Contrasto. Italian Ministry of Interior.
Moehling, C. and A. M. Piehl (2007). Immigration and crime in early 20th century america. NBER Working Paper No. 13576.
Munshi, K. (2003). Networks in the modern economy: Mexican migrants in the u.s. labor market. Quarterly Journal of Economics 118(2), 549–599.
Ottaviano, G. I. and G. Peri (2006). The economic value of cultural diversity: evidence from US cities. Journal of Economic Geography 6(1), 9–44.
Raphael, S. and R. Winter-Ember (2001). Identifying the effect of unemployment on crime.
Journal of Law & Economics 44(1), 259–83.
Saiz, A. (2007). Immigration and housing rents in american cities. Journal of Urban Eco-nomics 61(2), 345–371.
Stock, J. H. and M. Yogo (2002). Testing for weak instruments in linear iv regression. NBER Working Paper No. 0284.
Zenou, Y. (2003). The spatial aspects of crime. Journal of the European Economic Associa-tion 1(2-3), 459–467.
Appendix
Variables: definitions and sources
migr: log of residence permits over total province population, as of December 31 of each year. Source: Ministry of Interior.
total: log og reported crimes in each province and year. This category includes murder, serious assault, rape, sex offence, theft, robbery, extortion, kidnapping, incrimination for criminal association, arson, terrorism, drug-related crime, forgery and counterfeiting, fraud, prostitution, other crimes. Source: Statistiche Giudiziarie Penali - Italian National Institute of Statistics.
violent: log of reported violent crimes over total population in each province and year. Source: Statistiche Giudiziarie Penali - Italian National Institute of Statistics.
property: log of reported property crimes over total population in each province and year. This category includes robberies, thefts and car thefts. Source: Statistiche Giudiziarie Penali - Italian National Institute of Statistics.
thef t: log of reported thefts over total population in each province and year. This category includes several types of crime such as: bag snatch and pickpocketing. Source: Statistiche Giudiziarie Penali - Italian National Institute of Statistics.
robbery: log of reported robberies over total population in each province and year. Source: Statistiche Giudiziarie Penali - Italian National Institute of Statistics.
car thef t: log of reported car thefts over total population in each province and year. Source: Statistiche Giudiziarie Penali - Italian National Institute of Statistics.
drug: log of reported drug-related crimes over total population in each province and year. This category includes trafficking, consumption and pushing. Source: Statistiche Giudiziarie Penali - Italian National Institute of Statistics.
pop: log of resident population in each province and year. Source: Popolazione e movimento anagrafico dei comuni - Italian National Institute of Statistics.
urban: percentage of population living in cities with more than 100,000 inhabitants in each province and year. Source: Popolazione e movimento anagrafico dei comuni - Italian National Institute of Statistics.
male1539: percentage of young males aged 15-39 in the population in each province and year. Source: Popolazione e movimento anagrafico dei comuni - Italian National Institute of Statistics.
gdp: log of real GDP per-capita in each province and year. Source: Conti Economici Terri-toriali - Italian National Institute of Statistics.
unemp: percentage unemployment ratio in each province and year. Source: Labour Force Survey - Italian National Institute of Statistics.
clear−up: percentage ratio of the number of crimes cleared by the police to the total number of reported crimes, for each province, year and crime category. Source: Statistiche Giudiziarie Penali - Italian National Institute of Statistics.
partisan: ideology of the provincial government. This variable is constructed as follows. First, a score between 0 (extreme left) and 20 (extreme right) is attached to each political party according to the expert surveys presented in Benoit and Laver (2006) (these data are available at http://www.tcd.ie/Political Science/ppmd/). Then, the score of the local gov-ernment is computed as the average score of all parties entering executive cabinet weighted by the number of seats held by each party in the local council (the composition of Italian local councils is available at http://amministratori.interno.it/).
Figure 1: Opinions about immigrants: crime vs. labor market concerns AUS DEU−W DEU−E GBR USA AUT IRL NOR SWE NZL CAN JPN ESP FRA POR DNK CHE FIN ITA 0 20 40 60 80 100
% concerned with crime
0 20 40 60 80 100
% concerned with jobs
This graph presents the results of the “National Identity “survey conducted in 1995 and 2003 by the Inter-national Social Survey Programme. The vertical axis is the percentage of interviewed in each country that declared to “Strongly Agree”or “Agree”that “Immigrants increase crime rates ”. The horizontal axis is the percentage of interviewed in each country that declared to “Strongly Agree”or “Agree”that “Immigrants take jobs away from natives ”.
Figure 2: Actual and predicted irregular immigrants
This figure plots the actual number of irregular immigrants (on the vertical axis) against the number predicted based on regular immigrants (on the horizontal axis) along with the 45-degree line. The actual number of irregular immigrants is given by the number of demands for regularization presented in provinceiand yeart. The prediction is based on regressionIRR[it= ˆµiM IGRit+ ˆµtM IGRit+ ˆνit, whereM IGRitis the number of
residence permits in provinceiand yeartduring years 1995, 1998 and 2002 (see Section 2 for further details). The source of data on both residence permits and demands for regularization is the Italian Ministry of Interior.
Figure 3: Immigration and crime over time 0 500 1000 1500 2000 2500 3000 3500 4000 4500 5000 1990 1991 1992 1993 1994 1995 1996 1997 1998 1999 2000 2001 2002 2003 n u m b e r, p e r 1 0 0 ,0 0 0 i n h a b it a n ts
property crimes drug-related crimes
violent crimes other crimes
residence permits
This graph shows the evolution over time of reported crimes and residence permits in Italy. The histogram refers to the number of reported crimes per 100,000 inhabitants, distinguishing between different categories of criminal offenses. The line refers to the number of residence permits awarded to immigrants in Italy, per 100,000 inhabitants. The source of data on reported crimes and residence permits are ISTAT and the Italian Ministry of Interior, respectively.
Figure 4: Immigration and crime across provinces
These figures show the distribution, across Italian provinces, of the number of immigrants and reported crimes per 100,000 inhabitants. All variables are yearly averages during the period 1990-2003. Provinces are colored according to which quartile of the distribution they belong to; darker colors refer to higher values. The extremes of each quartile, along with the corresponding color, are reported at the bottom of each map. The sources of data for residence permits and reported crimes are ISTAT and the Italian Ministry of Interior, respectively.
Figure 5: Immigration to Italy and to the rest of Europe ALB BRA CHN DZA EGY FYR IND MOR NGA PHL PKT ROM TUN 0 .5 1 1.5 2 2.5
log−change of immigrants in Italy
−.5 0 .5 1 1.5 2 2.5 3 3.5
log−change of immigrants in the rest of Europe
This figure plots the log-change of immigrant population in Italy during the 1991-2001 period (on the vertical axis) against the log-change of immigrant population in other European countries during the same period (on the horizontal axis), by country of origin. Immigrant population in Italy is measured by the number of residence permits, as reported by the Italian Ministry of Interior. Immigrant population in other European countries is measured using the 1991 and 2001 rounds of national census. The destination countries for which we obtained census data are Austria, Belgium, Denmark, Finland, France, Greece, Netherlands, Norway, Spain, Sweden and Switzerland. Information on the stock of immigrants in those countries was available for the following nationalities: Albania, Algeria, Brazil, China (excluding Hong Kong), Egypt, India, Morocco, Nigeria, Pakistan, Philippines, Romania, Tunisia, Former Yugoslavia.
Table 1: Descriptive statistics
observations mean std. dev. min. max Residence permits per 100,000 inhabitants 1330 1353 1187 44 7873 Total crimes per 100,000 inhabitants 1330 3388 1350 1072 13404 Violent crimes per 100,000 inhabitants 1330 50 29 1 230 Property crimes per 100,000 inhabitants 1330 2615 1216 442 7879
robberies 1330 37 41 2 385 thefts 1330 1943 909 321 6049 car thefts 1330 287 281 29 1648 Drug-related crimes per 100,000 inhabitants 1330 64 45 5 918 migr 1330 -4.64 0.85 -7.73 -2.54 total 1330 -3.45 0.37 -4.54 -2.01 violent 1330 -7.75 0.55 -11.19 -6.07 property 1330 -3.75 0.45 -5.42 -2.54 robbery 1330 -8.23 0.75 -10.74 -5.56 thef t 1330 -4.04 0.45 -5.74 -2.81 car thef t 1330 -6.22 0.83 -8.14 -4.11 drug 1330 -7.52 0.57 -9.84 -4.69 pop 1330 13.01 0.70 11.41 15.18 urban 1235 14.62 20.15 0.00 88.11 male1539 1330 18.01 1.23 14.41 21.03 gdp 1235 9.55 0.26 8.94 10.11 unemp 1045 10.43 7.09 1.68 33.16
clear−up (total crimes) 1330 30.54 10.47 9.20 82.75
clear−up (violent crimes) 1330 82.03 12.93 23.32 100.00
clear−up (property crimes) 1330 6.92 3.18 1.60 30.83
clear−up (drug-related crimes) 1330 95.77 5.61 37.71 100.00
partisan 1330 10.26 1.75 5.90 16.30
Notes: This table reports the descriptive statistics for all dependent and explanatory variables across the 95 Italian provinces during the period 1990-2003.
Table 2: Correlation Matrix
migr total violent property drug pop urban male1539 gdp unemp clear−up total 0.356 violent 0.289 0.377 property 0.287 0.879 0.176 drug 0.205 0.383 0.147 0.244 pop 0.125 0.465 -0.062 0.598 0.036 urban 0.208 0.550 0.091 0.557 0.171 0.475 male1539 -0.471 -0.074 -0.120 0.036 -0.209 0.375 -0.053 gdp 0.710 0.328 0.266 0.298 0.199 0.072 0.216 -0.407 unemp -0.607 -0.084 -0.179 -0.070 -0.136 0.138 0.057 0.425 -0.858 clear−up -0.276 -0.511 0.069 -0.723 0.070 -0.459 -0.404 -0.009 -0.288 0.113 partisan 0.164 0.024 0.134 0.055 -0.065 0.116 -0.112 0.196 0.068 -0.060 -0.092
Notes: This table reports the correlation matrix between the ratio of immigrants over total population and the ratio of reported crimes over total population, distinguished by type of crime, across the 95 Italian provinces during the period 1990-2003.
Table 3: Panel regressions: baseline
total violent property drug total violent property drug migr 0.103∗∗∗ -.007 0.126∗∗∗ -.190∗∗∗ 0.102∗∗∗ 0.003 0.084∗∗∗ -.103 (0.034) (0.057) (0.031) (0.06) (0.039) (0.084) (0.028) (0.074) pop 0.028 -.338 0.96 -2.550 (0.641) (1.660) (0.718) (1.552) urban 0.003∗ -.003 0.003 -.010∗∗∗ (0.002) (0.003) (0.003) (0.002) male1539 0.131∗∗∗ 0.236∗∗ 0.041 0.325∗∗∗ (0.045) (0.11) (0.053) (0.108) gdp 0.15 -.116 0.171 0.423 (0.14) (0.319) (0.166) (0.378) unemp -.004 0.011 -.007∗ 0.019∗ (0.004) (0.01) (0.003) (0.01) clear−up -.004 -.008∗∗∗ -.030∗∗∗ 0.0003 (0.003) (0.002) (0.006) (0.003) partisan 0.007 0.045∗∗ 0.007 0.023 (0.01) (0.019) (0.009) (0.015) Obs. 1,330 1,330 1,330 1,330 1,045 1,045 1,045 1,045 Provinces 95 95 95 95 95 95 95 95
Prov. FE yes yes yes yes yes yes yes yes
Year FE yes yes yes yes yes yes yes yes
R2 0.153 0.266 0.162 0.171 0.220 0.321 0.302 0.189
F-stat. 21.54 9.69 17.70 35.76 14.81 7.37 11.68 17.26
Notes: This table presents the results of OLS estimates on a panel of yearly observations for all 95 Italian provinces during the period 1991-2003. The dependent variable is the log of crimes reported by the police over total population, for each category of criminal offenses. The variablemigris the log of immigrants (i.e. residence permits) over province population. The sources of data for residence permits and reported crimes are ISTAT and the Italian Ministry of Interior, respectively. All other variables are defined in the Appendix. Province and year fixed-effects are included in all specifications. Robust standard errors are presented in parenthesis. *, ** and ***
Table 4: Panel regressions: property crimes breakdown
robbery thef t car thef t robbery thef t car thef t
migr 0.197∗∗∗ 0.14∗∗∗ 0.045 0.092∗ 0.093∗∗∗ 0.057 (0.05) (0.032) (0.041) (0.05) (0.03) (0.041) pop 4.285∗∗∗ 1.155∗ 0.365 (1.026) (0.686) (0.958) gdp -.155 0.113 0.611∗∗∗ (0.267) (0.164) (0.232) unemp -.022∗∗∗ -.006∗ -.003 (0.007) (0.003) (0.005) urban 0.0007 0.004 0.004∗∗ (0.004) (0.002) (0.002) male1539 -.145∗ 0.052 0.1 (0.084) (0.053) (0.072) clear−up -.005∗∗∗ -.030∗∗∗ -.005∗∗ (0.001) (0.006) (0.003) partisan 0.006 0.007 -.003 (0.013) (0.009) (0.011) Obs. 1,330 1,330 1,330 1,045 1,045 1,045 Provinces 95 95 95 95 95 95
Prov. FE yes yes yes yes yes yes
Year FE yes yes yes yes yes yes
R2 0.156 0.146 0.296 0.241 0.28 0.323
F-stat. 14.91 15.12 23.31 14.17 9.77 14.72
Notes: This table presents the results of OLS estimates on a panel of yearly observations for all 95 Italian provinces during the period 1991-2003. The dependent variable is the log of crimes reported by the police over total population, for each category of criminal offenses. The variablemigris the log of immigrants (i.e. residence permits) over province population. The sources of data for residence permits and reported crimes are ISTAT and the Italian Ministry of Interior, respectively. All other variables are defined in the Appendix. Province
Table 5: Ten-year difference regressions
Panel A: Second-Stage
Ten-year differences: OLS Ten-year differences: IV
∆total ∆violent ∆property ∆drug ∆total ∆violent ∆property ∆drug
∆migr .1558∗∗∗ -.0389 .1362∗∗∗ -.2680∗∗∗ .1051 -.0964 .0456 -.1852 (.0492) (.1120) (.0452) (.0934) (.1874) (.4474) (.1498) (.2990) Obs. 95 95 95 95 95 95 95 95 R2 0.241 0.062 0.276 0.219 F-stat 5.40 1.56 6.95 4.95 Panel B: First-Stage \ ∆migrit 0.5223∗∗∗ 0.4585∗∗∗ 0.5346∗∗∗ 0.5446∗∗∗ (0.1441) (0.1672) (0.1604) (0.1620)
F-stat (excl. instr.) 13.14 7.52 11.11 11.30
Notes: The top panel of this table presents the results of OLS and IV (second-stage) estimates on the cross-section of ten-year differences between 1991 and 2001 across all 95 Italian provinces. The dependent variable is the log-change of the number of crimes reported by the police over total population, for each category of criminal offenses. The variable ∆migr is the log-change of immigrants (i.e. residence permits) over province population. The bottom panel reports first-stage estimates of IV regressions. The first-stage instrument, ∆ lnM IGRIV, is the weighted sum of the log-changes of immigrant population by nationality in other European countries. The weights are
the shares of permits held by each nationality over total permits in that province in 1990 (see equation 5 in the main text). The log-changes of all control variables in Tables 3 and 4 are always included, both in the first and second stage. The sources of data for residence permits and reported crimes are ISTAT and the Italian Ministry of Interior, respectively. Immigrant population in other European countries is measured using the 1991 and 2001 rounds of national census. The F-statistic for excluded instruments refers to the null hypothesis that the coefficient of the excluded instrument is equal to zero in the first stage. Robust standard errors are presented in parenthesis. *, **
Table 6: Ten-year difference regressions: property crimes breakdown
Panel A: Second-Stage
Ten-year differences: OLS Ten-year differences: IV ∆robbery ∆thef t ∆car thef t ∆robbery ∆thef t ∆car thef t
∆migr .3508∗∗∗ .1555∗∗∗ -.0328 1.0234∗∗∗ .1437 -.1167 (.0890) (.0453) (.0807) (.3602) (.1509) (.2412) Obs. 95 95 95 95 95 95 R2 0.193 0.308 0.124 F-stat 4.14 7.87 2.36 Panel B: First-Stage \ ∆migrit 0.5528∗∗∗ 0.5311∗∗∗ 0.5549∗∗ (0.1626) (0.1593) (0.1599) 1st stage F-stat. 11.56 11.11 12.04
Notes: The top panel of this table presents the results of OLS and IV (second-stage) estimates on the cross-section of ten-year differences between 1991 and 2001 across all 95 Italian provinces. The dependent variable is the log-change of the number of crimes reported by the police over total population, for each category of criminal offenses. The variable ∆migris the log-change of immigrants (i.e. residence permits) over province population. The bottom panel reports first-stage estimates of IV regressions. The first-stage instrument,
\
∆migrit, is the weighted sum of the log-changes of immigrant population by nationality in other European countries. The weights are the shares of permits held by each nationality over total permits in that province in 1990 (see equation 5 in the main text). The log-changes of all control variables in Tables 3 and 4 are always included, both in the first and second stage. The sources of data for residence permits and reported crimes are ISTAT and the Italian Ministry of Interior, respectively. Immigrant population in other European countries is measured using the 1991 and 2001 rounds of national census. The F-statistic for excluded instruments
Table 7: Robustness: immigrants from developing countries
Panel A: Second-Stage
Ten-year differences: OLS Ten-year differences: IV
∆total ∆violent ∆property ∆drug ∆total ∆violent ∆property ∆drug
∆ lnmigrdc .1477∗∗∗ -.0478 .1321∗∗∗ -.2462∗∗ .1009 -.0934 .0438 -.1779 (.0506) (.1155) (.0487) (.0936) (.1797) (.4345) (.1435) (.5669) Obs. 95 95 95 95 95 95 95 95 R2 0.236 0.062 0.273 0.210 F-stat 5.16 1.57 6.73 4.66 Panel B: First-Stage \ ∆migrit 0.5439∗∗∗ 0.4730∗∗∗ .5570∗∗∗ 0. .5670∗∗∗ (0.1533) (0.1735) (0.1698) (0.1714)
F-stat (excl. instr.) 12.59 7.44 10.76 10.94
Notes: The top panel of this table presents the results of OLS and IV (second-stage) estimates on the cross-section of ten-year differences between 1991 and 2001 across all 95 Italian provinces. The dependent variable is the log-change of the number of crimes reported by the police over total population, for each category of criminal offenses. The variable ∆migrdcis the log-change of immigrants from developing
countries over province population. The bottom panel reports first-stage estimates of IV regressions. The first-stage instrument,∆\migrit,
is the weighted sum of the log-changes of immigrant population by nationality in other European countries. The weights are the shares of permits held by each nationality over total permits in that province in 1990 (see equation 5 in the main text). The log-changes of all control variables in Tables 3 and 4 are always included, both in the first and second stage. The sources of data for residence permits and reported crimes are ISTAT and the Italian Ministry of Interior, respectively. Immigrant population in other European countries is measured using the 1991 and 2001 rounds of national census. The F-statistic for excluded instruments refers to the null hypothesis that the coefficient of the excluded instrument is equal to zero in the first stage. Robust standard errors are presented in parenthesis. *, **
Table 8: Robustness: immigrants from developing countries, property crimes breakdown
Panel A: Second-Stage
Ten-year differences: OLS Ten-year differences: IV ∆robbery ∆thef t ∆car thef t ∆robbery ∆thef t ∆car thef t
∆migrdc .3372∗∗∗ .1519∗∗∗ -.0370 .9846∗∗∗ .1379 -.1123 (.0884) (.0488) (.0787) (.3461) (.1440) (.2331) Obs. 95 95 95 95 95 95 R2 0.185 0.305 0.125 F-stat 4.03 7.69 2.36 Panel B: First-Stage \ ∆migrit 0.5746∗∗∗ 0.5537∗∗∗ 0.5769∗∗ (0.1833) (0.1802) (0.1816) 1st stage F-stat. 9.83 9.44 10.09
Notes: The top panel of this table presents the results of OLS and IV (second-stage) estimates on the cross-section of ten-year differences between 1991 and 2001 across all 95 Italian provinces. The dependent variable is the log-change of the number of crimes reported by the police over total population, for each category of criminal offenses. The variable ∆migrdcis the log-change of immigrants from developing countries over province population. The bottom panel reports first-stage estimates of IV regressions. The first-stage instrument,∆\migrit, is the weighted sum of the log-changes of immigrant population by nationality in other European countries. The weights are the shares of permits held by each nationality over total permits in that province in 1990 (see equation 5 in the main text). The log-changes of all control variables in Tables 3 and 4 are always included, both in the first and second stage. The sources of data for residence permits and reported crimes are ISTAT and the Italian Ministry of Interior, respectively. Immigrant population in other European countries is measured using the 1991 and 2001 rounds of national census. The F-statistic for
Table 9: Robustness: composition by nationality
∆total ∆violent ∆property ∆drug ∆robbery ∆thef t ∆car thef t
∆migrnat .1301∗∗∗ -.0252 .1224∗∗∗ -.2455∗∗∗ .3213∗∗∗ .1385∗∗∗ -.0120 (.0407) (.1176) (.0375) (.0754) (.0737) (.0373) (.0618)
Obs. 95 95 95 95 95 95 95
R2 0.236 0.061 0.282 0.227 0.210 0.314 0.123
F-stat 5.83 1.58 7.58 5.42 4.73 8.61 2.38
Notes: This table presents the results of OLS estimates on the cross-section of ten-year differences between 1991 and 2001 across all 95 Italian provinces. The dependent variable is the log-change of the number of crimes reported by the police over total population, for each category of criminal offenses. The variable ∆migrnatis the
log-change of immigrants of those nationalities included in∆\migr(listed in Section 4) over province population. The log-changes of all control variables in Tables 3 and 4 are always included, both in the first and second stage. The sources of data for residence permits and reported crimes are ISTAT and the Italian Ministry of Interior, respectively. Robust standard errors are presented in parenthesis. *, ** and *** denote rejection of the null hypothesis of the coefficient being equal to 0 at 10%, 5% and 1% significance level, respectively.
Table 10: Robustness: spatial correlation
∆total ∆violent ∆property ∆drug ∆robbery ∆thef t ∆car thef t
∆migr .0977 -.1349 .0453 -.1711 .9556∗∗∗ .1416 -.2015
(.1903) (.4395) (.1516) (.3015) (.2664) (.1525) (.2606)
Spatial lag .3799 .6074∗ .0588 .6601∗∗ .7216∗∗∗ .1644 .0581
(.4792) (.3281) (.6110) (.2914) (.2559) (.5716) (.5570)
Notes: This table presents the results of IV (second-stage) estimates on the cross-section of ten-year differences between 1991 and 2001 across all 95 Italian provinces. The dependent variable is the log-change of the number of crimes reported by the police over total population, for each category of criminal offenses. The variable ∆migr
is the log-change of immigrants over province population and is instrumented in the first stage by∆\migrit (see equation 5 in the main text). The spatial lag is the weighted sum of the log of crimes over ppopulation in all other provinces, with weighting matrix based on the inverse of road travelling distance between provinces. The log-changes of all control variables in Tables 3 and 4 are always included, both in the first and second stage. The sources of data for residence permits and reported crimes are ISTAT and the Italian Ministry of Interior, respectively. Robust standard errors are presented in parenthesis. *, ** and *** denote rejection of the null hypothesis of the coefficient being equal to 0 at 10%, 5% and 1% significance level, respectively.
(*) Requests for copies should be sent to:
RECENTLY PUBLISHED “TEMI” (*)
N. 670 – Credit risk and business cycle over different regimes, by Juri Marcucci and Mario Quagliariello (June 2008).
N. 671 – Cyclical asymmetry in fiscal variables, by Fabrizio Balassone, Maura Francese and Stefania Zotteri (June 2008).
N. 672 – Labour market for teachers: Demographic characteristics and allocative mechanisms, by Gianna Barbieri, Piero Cipollone and Paolo Sestito (June 2008). N. 673 – Output growth volatility and remittances, by Matteo Bugamelli and Francesco
Paternò (June 2008).
N. 674 – Agglomeration within and between regions: Two econometric based indicators, by Valter Di Giacinto and Marcello Pagnini (June 2008).
N. 675 – Service regulation and growth: Evidence from OECD countries, by Guglielmo Barone and Federico Cingano (June 2008).
N. 676 – Has globalisation changed the Phillips curve? Firm-level evidence on the effect of activity on prices, by Eugenio Gaiotti (June 2008).
N. 677 – Forecasting inflation and tracking monetary policy in the euro area: Does national information help? by Riccardo Cristadoro, Fabrizio Venditti and Giuseppe Saporito (June 2008).
N. 678 – Monetary policy effects: New evidence from the Italian flow of funds, by Riccardo Bonci and Francesco Columba (June 2008).
N. 679 – Does the expansion of higher education increase the equality of educational opportunities? Evidence from Italy, by Massimiliano Bratti, Daniele Checchi and Guido de Blasio (June 2008).
N. 680 – Family succession and firm performance: Evidence from Italian family firms, by Marco Cucculelli and Giacinto Micucci (June 2008).
N. 681 – Short-term interest rate futures as monetary policy forecasts, by Giuseppe Ferrero and Andrea Nobili (June 2008).
N. 682 – Vertical specialisation in Europe: Evidence from the import content of exports, by Emanuele Breda, Rita Cappariello and Roberta Zizza (August 2008).
N. 683 – A likelihood-based analysis for relaxing the exclusion restriction in randomized experiments with imperfect compliance, by Andrea Mercatanti (August 2008). N. 684 – Balancing work and family in Italy: New mothers' employment decisions after
childbirth, by Piero Casadio, Martina Lo Conte and Andrea Neri (August 2008). N. 685 – Temporal aggregation of univariate and multivariate time series models: A survey,
by Andrea Silvestrini and David Veredas (August 2008).
N. 686 – Exploring agent-based methods for the analysis of payment systems: A crisis model for StarLogo TNG, by Luca Arciero, Claudia Biancotti, Leandro D'Aurizio and Claudio Impenna (August 2008).
N. 687 – The labor market impact of immigration in Western Germany in the 1990's, by Francesco D'Amuri, Gianmarco I. P. Ottaviano and Giovanni Peri (August 2008). N. 688 – Agglomeration and growth: the effects of commuting costs, by Antonio Accetturo
(September 2008).
N. 689 – A beta based framework for (lower) bond risk premia, by Stefano Nobili and Gerardo Palazzo (September 2008).
N. 690 – Nonlinearities in the dynamics of the euro area demand for M1, by Alessandro Calza and Andrea Zaghini (September 2008).
N. 691 – Educational choices and the selection process before and after compulsory schooling, by Sauro Mocetti (September 2008).
N. 692 – Investors’ risk attitude and risky behavior: a Bayesian approach with imperfect information, by Stefano Iezzi (September 2008).
"TEMI" LATER PUBLISHED ELSEWHERE
2006
F. BUSETTI, Tests of seasonal integration and cointegration in multivariate unobserved component models, Journal of Applied Econometrics, Vol. 21, 4, pp. 419-438, TD No. 476 (June 2003).
C. BIANCOTTI, A polarization of inequality? The distribution of national Gini coefficients 1970-1996, Journal of Economic Inequality, Vol. 4, 1, pp. 1-32, TD No. 487 (March 2004).
L. CANNARI and S. CHIRI, La bilancia dei pagamenti di parte corrente Nord-Sud (1998-2000), in L. Cannari, F. Panetta (a cura di), Il sistema finanziario e il Mezzogiorno: squilibri strutturali e divari finanziari, Bari, Cacucci, TD No. 490 (March 2004).
M.BOFONDI andG.GOBBI,
Information barriers to entry into credit markets,
Review of Finance, Vol. 10, 1, pp. 39-67, TD No.
509 (July 2004).W.FUCHS andLIPPI F., Monetary union with voluntary participation, Review of Economic Studies, Vol. 73, pp. 437-457 TD No. 512 (July 2004).
E.GAIOTTI and A.SECCHI, Is there a cost channel of monetary transmission? An investigation into the pricing behaviour of 2000 firms, Journal of Money, Credit and Banking, Vol. 38, 8, pp. 2013-2038
TD No. 525 (December 2004).
A. BRANDOLINI,P.CIPOLLONE andE.VIVIANO, Does the ILO definition capture all unemployment?, Journal of the European Economic Association, Vol. 4, 1, pp. 153-179, TD No. 529 (December 2004). A. BRANDOLINI,L.CANNARI,G.D’ALESSIO andI.FAIELLA, Household wealth distribution in Italy in the
1990s, in E. N. Wolff (ed.) International Perspectives on Household Wealth, Cheltenham, Edward Elgar, TD No. 530 (December 2004).
P. DEL GIOVANE and R. SABBATINI, Perceived and measured inflation after the launch of the Euro: Explaining the gap in Italy, Giornale degli economisti e annali di economia, Vol. 65, 2 , pp. 155-192, TD No. 532 (December 2004).
M. CARUSO, Monetary policy impulses, local output and the transmission mechanism, Giornale degli economisti e annali di economia, Vol. 65, 1, pp. 1-30, TD No. 537 (December 2004).
L.GUISO andM.PAIELLA,The role of risk aversion in predicting individual behavior,In P. A. Chiappori e C. Gollier (eds.) Competitive Failures in Insurance Markets: Theory and Policy Implications, Monaco, CESifo, TDNo.546(February 2005).
G. M.TOMAT, Prices product differentiation and quality measurement: A comparison between hedonic and matched model methods, Research in Economics, Vol. 60, 1, pp. 54-68, TD No. 547 (February 2005).
L. GUISO, M. PAIELLA and I. VISCO, Do capital gains affect consumption? Estimates of wealth effects from Italian household's behavior, in L. Klein (ed), Long Run Growth and Short Run Stabilization: Essays in Memory of Albert Ando (1929-2002), Cheltenham, Elgar, TD No. 555 (June 2005).
F. BUSETTI, S. FABIANI and A. HARVEY, Convergence of prices and rates of inflation, Oxford Bulletin of Economics and Statistics, Vol. 68, 1, pp. 863-878, TD No. 575 (February 2006).
M.CARUSO, Stock market fluctuations and money demand in Italy, 1913 - 2003, Economic Notes, Vol. 35, 1, pp. 1-47, TD No. 576 (February 2006).
S. IRANZO, F. SCHIVARDI and E. TOSETTI, Skill dispersion and productivity: An analysis with matched data, CEPR Discussion Paper, 5539, TD No. 577 (February 2006).
R.BRONZINI andG. DE BLASIO,Evaluating the impact of investment incentives: The case of Italy’s Law 488/92. Journal of Urban Economics, Vol. 60, 2, pp. 327-349, TDNo.582(March2006).
R.BRONZINI andG. DE BLASIO,Una valutazione degli incentivi pubblici agli investimenti, Rivista Italiana degli Economisti , Vol. 11, 3, pp. 331-362, TDNo.582(March2006).
A.DI CESARE,Do market-based indicators anticipate rating agencies? Evidence for international banks, Economic Notes, Vol. 35, pp. 121-150, TD No. 593 (May 2006).
R. GOLINELLI and S. MOMIGLIANO, Real-time determinants of fiscal policies in the euro area, Journal of Policy Modeling, Vol. 28, 9, pp. 943-964, TD No. 609 (December2006).
2007
S.SIVIERO and D.TERLIZZESE, Macroeconomic forecasting: Debunking a few old wives’ tales, Journal of Business Cycle Measurement and Analysis , v. 3, 3, pp. 287-316, TD No. 395 (February 2001). S. MAGRI, Italian households' debt: The participation to the debt market and the size of the loan,
Empirical Economics, v. 33, 3, pp. 401-426, TD No. 454 (October 2002).
L.CASOLARO.andG.GOBBI, Information technology and productivity changes in the banking industry, Economic Notes, Vol. 36, 1, pp. 43-76, TD No. 489 (March 2004).
G. FERRERO, Monetary policy, learning and the speed of convergence, Journal of Economic Dynamics and Control, v. 31, 9, pp. 3006-3041, TD No. 499 (June 2004).
M. PAIELLA, Does wealth affect consumption? Evidence for Italy, Journal of Macroeconomics, Vol. 29, 1, pp. 189-205, TD No. 510 (July 2004).
F.LIPPI. and S.NERI, Information variables for monetary policy in a small structural model of the euro area, Journal of Monetary Economics, Vol. 54, 4, pp. 1256-1270, TD No. 511 (July 2004). A.ANZUINI and A.LEVY, Monetary policy shocks in the new EU members: A VAR approach, Applied
Economics, Vol. 39, 9, pp. 1147-1161, TD No. 514 (July 2004).
D. JR. MARCHETTI and F. Nucci, Pricing behavior and the response of hours to productivity shocks, Journal of Money Credit and Banking, v. 39, 7, pp. 1587-1611, TD No. 524 (December2004).
R. BRONZINI, FDI Inflows, agglomeration and host country firms' size: Evidence from Italy, Regional Studies, Vol. 41, 7, pp. 963-978, TD No. 526 (December2004).
L. MONTEFORTE, Aggregation bias in macro models: Does it matter for the euro area?, Economic Modelling, 24, pp. 236-261, TD No. 534 (December2004).
A. NOBILI, Assessing the predictive power of financial spreads in the euro area: does parameters instability matter?, Empirical Econom