Exact and Portable Profiling for the JVM
Using Bytecode Instruction Counting
Walter Binder and Jarle Hulaas
Ecole Polytechnique F´ed´erale de Lausanne (EPFL) School of Computer and Communication SciencesCH-1015 Lausanne, Switzerland firstname.lastname@epfl.ch
Abstract
This paper presents a novel profiling approach, which is entirely based on program transformation tech-niques in order to enable exact profiling, preserving complete call stacks, method invocation counters, and bytecode instruction counters. We exploit the number of executed bytecode instructions as profiling metric, which has several advantages, such as making the instrumentation entirely portable and generating repro-ducible profiles. These ideas have been implemented as the JP tool. It provides a small and flexible API to write portable profiling agents in pure Java, which are periodically activated to process the collected profiling information. Performance measurements point out that JP causes significantly less overhead than a prevailing tool for the exact profiling of Java code.
Keywords: Java, JVM, Profiling, Program Transformations, Bytecode Instrumentation
1
Introduction
Profiling allows a detailed analysis of the resource consumption of programs. It helps to detect hot spots and performance bottlenecks, guiding the developer in which parts of a program optimizations may pay off. Profiling provides detailed execution statistics on the basis of individual methods (e.g., call stack, invocation counter, CPU time, etc.).
As Java [16] and the Java Virtual Machine (JVM) [21] are a preferred
pro-gramming language and deployment platform for many application and middleware developers, there is a need for efficient Java profiling tools. The Java Virtual
Ma-chine Profiling Interface (JVMPI) [23] is a set of hooks to the JVM which signals
interesting events, such as thread start and object allocations. Its successor, the
JVM Tool Interface (JVMTI) [24], provides additional facilities for bytecode
in-strumentation. Many profilers based on the JVMPI or JVMTI can operate in two
modes: In the exact profiling mode, they track each method invocation, whereas in
the sampling mode, the profiler spends most of the time sleeping and periodically
1571-0661/$ – see front matter © 2006 Elsevier B.V. All rights reserved.
www.elsevier.com/locate/entcs
(every few milliseconds) wakes up to register the current stack trace. In this paper we focus on exact profiling.
Profilers based on the JVMPI or JVMTI interfaces implement profiling agents to intercept various events, such as method invocations. Unfortunately, these profiling agents have to be written in platform-dependent native code, contradicting the Java motto ‘write once and run anywhere’. More problematic, profiling based on such APIs may result in enormous overhead. With exact profiling, programs usually run more than factor 10 slower, in extreme cases we even experienced a slowdown of factor 4000 and more. As a result, exact profiling based on the JVMPI is not suited for complex software systems, such as application servers, and impossible to perform on production systems. Developers spend considerable efforts to extract parts of their applications to profile them separately, because profiling the whole system would not be feasible due to the extreme overhead. Furthermore, often the measurements affect the runtime characteristics of the profiled application so that the obtained execution statistics are of limited value (measurement perturbation).
For these reasons, we developed JP, a novel Java profiler that relies on neither of these APIs, but directly instruments the bytecode of Java programs in order to obtain detailed execution statistics. JP inserts bytecode instructions to compute
an execution profile. Moreover, JP uses the number of executed bytecodes1 as
profiling metric instead of the amount of elapsed CPU time. Our approach offers the following advantages:
(i) Profiling agents can be written in pure Java and are better integrated with the environment. Hence, profiling agents are portable and can be used in all kinds of JVMs.
(ii) Profiling agents can be programmed to preserve a trace of the full call stack, or to compact it at certain intervals, whereas existing profiling agents frequently only support a fixed maximal stack depth.
(iii) The number of executed bytecodes is a platform-independent metric [14]. Thus,
for deterministic programs, profiles are reproducible as well as comparable across different machines (assuming the same Java class library is used). Pro-grams instrumented by JP produce profiling statistics that reflect the number
of bytecodes that the program would executewithoutprofiling, i.e., the profiling
itself does not affect the generated profiles (no measurement perturbation).2
(iv) Our approach is also applicable to JVMs that support neither the JVMPI nor the JVMTI, or that provide limited support for profiling in general.
(v) The overhead is rather low compared to classical approaches, since it does not prevent the underlying JVM from putting all its optimization facilities to work during the profiling.
The main contributions of this paper are the detailed presentation of program transformations and necessary runtime classes for the exact profiling of Java pro-1 In this paper the term ‘bytecode’ is used as a synonym for ’JVM bytecode instruction’.
grams, the introduction of portable profiling agents written in pure Java, a thor-ough analysis of the overhead due to exact profiling using the SPEC JVM98 and SPEC JBB2000 benchmarks, as well as a comparison with the overhead caused by the standard ‘hprof’ profiler in its exact mode.
This paper is structured as follows: Section 2 introduces the design principles
behind our profiling technology. Section 3presents how call stacks are managed by
the profiler and how applications are rewritten at the bytecode level to generate
the needed profiling information. Section 4 explains how we compute the number
of executed bytecodes, which serves as profiling metric. The information generated at runtime is periodically collected by a user-defined profiling agent, as detailed in
Section5. Section6presents our performance measurements, Section7discusses the
benefits and limitations of our approach, whereas Section8compares our research
with related work. Finally, Section9concludes this paper.
2
The Java Profiler JP
In order to overcome the aforementioned shortcomings of JVMPI- or JVMTI-based profilers, we developed JP, a Java profiler that relies on neither of these APIs, but directly instruments the bytecode of Java programs in order to obtain detailed ex-ecution statistics. JP inserts bytecodes to compute an exex-ecution profile. Currently, JP provides the following profiling information:
(i) Method invocation context. For each method invocation, the full call stack is
preserved.3 This allows to differentiate invocations of the same method by
distinct callers.
(ii) Method invocation counters. For each method invocation context, the number of calls to that method is stored.
(iii) Bytecode counters. For each method invocation context, the number of
byte-codes executed by that method is computed.
In contrast to most other profilers, which preserve the method invocation context only up to a limited depth, we preserve the complete call stack, enabling a more detailed analysis of the program behaviour. According to the terminology of Ball
and Larus [4], we follow a path profiling approach since we maintain the complete
execution history (however only at the method call level), as opposed to the more economic and approximate edge profiling strategy.
During program execution each thread creates a method call tree (MCT), where
each node N corresponds to the invocation of a certain method. The parent node
of N is the caller of N, and the children of N are its callees. The root of the
MCT represents the caller of the main method. In each node we store the number of invocations of the corresponding method and the number of bytecodes executed by these method invocations, excluding the number of bytecodes executed by callee
methods. The MCT corresponds to the Calling Context Tree (CCT) [2], but in
con-3 Currently, there are some limitations concerning the preservation of the full call stack, if the frames of
trast to the CCT, the depth of the MCT is unbounded. Details concerning method
invocation context and method invocation counting are explained in Section3.
Most existing profilers measure the CPU consumption of programs in seconds. Although the CPU second is the most common profiling metric, it has several draw-backs: It is platform-dependent (for the same program and input, the CPU time differs depending on hardware, operating system, and JVM), measuring it accu-rately may require platform-dependent features (such as special operating system functions), and results may not be easily reproducible (the CPU time may depend on factors such as system load). Furthermore, measurement perturbation may be a severe problem: The measured CPU consumption of the profiled program may sig-nificantly differ from the effective CPU consumption when the program is executed without profiling. The last point is particularly true on JVMs where the use of the JVMPI disables just-in-time compilation.
We follow a different approach, using bytecode counting as dynamic metric [6].
That is, for each method invocation context, we compute the number of byte-codes which the unmodified program would execute. These values are platform-independent, they can be computed directly from the program bytecode without resorting to platform-specific functions, they are reproducible (for deterministic pro-grams), and they represent the execution of the original program (no measurement perturbation). In previous work we have established bytecode counting as platform-independent metric for resource accounting (e.g., production-time monitoring of server environments) and control (e.g., pevention of denial-of-service attacks in
mo-bile code systems) [10,19,9]. Here, this metric is key for efficient profiling. Details
on bytecode counting are covered in Section4.
JP is a flexible, extensible framework for Java profiling. It offers an API allowing the user to define a custom profiling agent, which is activated periodically. The profiling agent may aggregate the profiling information computed by several threads. It may display up-to-date profiling information while the program is being profiled
(continuous metrics [14]), it may send the obtained information over a network,
or simply write it to a file before the program terminates. Details on the periodic
activation of profiling agents and the corresponding APIs are discussed in Section5.
3
Method Invocation Context and Invocation Counting
3.1 Runtime Classes
While executing the transformed bytecode, each thread creates a MCT. The tree
nodes are of the type IC (invocation context) shown in Fig. 1. Each invocation
context stores the profiling information (method invocation counter invoc and
bytecode counter instr) for all invocations of a certain method with the same
call stack.4 Each invocation context has a map of its callee methods. Identifiers
of the callee methods (type MID, see below) serve as keys in the map. The values
are the invocation contexts of the callees. In Fig.1 the standardHashMapclass is
4 For performance reasons, theinvocandinstrcounters are 32 bit values, which are treated as unsigned
public class IC {
int invoc = 0; // nr. of method invocations public int instr = 0; // nr. of executed bytecodes public final Map callees = new HashMap();
public final long getInvoc() { return invoc & 0xffffffffL; } public final long getInstr() { return instr & 0xffffffffL; } public final void reset() { instr = invoc = 0; }
public final IC profileCall(MID mid) { IC ic = (IC)callees.get(mid);
if (ic == null) { ic = new IC(); callees.put(mid, ic); } ++ic.invoc;
return ic; }
}
Fig. 1. Simplified IC implementation.
public final class RC extends IC {
static final ThreadLocal rootContext = new ThreadLocal(); public static RC getRC() {
RC rc = (RC)rootContext.get();
if (rc == null) { rc = new RC(); rootContext.set(rc); rc.initialize(); } return rc;
} ... }
Fig. 2. Part of the RC implementation.
used in order to simplify presentation, whereas the actual implementation uses an optimized map, because access to the map is very frequent.
In order to prevent race conditions, either access to the MCT has to be synchro-nized, or each thread has to maintain its own copy of the tree. To avoid expensive synchronization and to allow profiling agents to keep the profiling statistics of dif-ferent threads separately, we chose to create a separate MCT for each thread in the
system. For each thread, the root of its MCT is stored in a thread-local variable5
of the typeRC(root context). Part of theRCimplementation is illustrated in Fig.2.
Further parts, such as the method initialize(), will be presented later in
Sec-tion 5. The static method getRC() returns the root context (an instance of IC)
for the current thread. If it does not already exist, it is created.
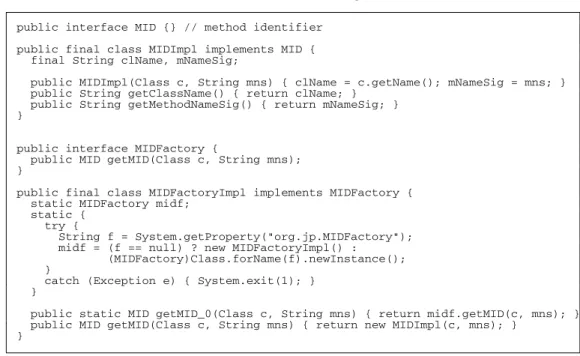
Method identifiers are instances ofMID, which is a marker interface (see Fig.3).
For performance reasons, instances of MIDare identified and distinguished directly
by their reference. The default implementation, MIDImpl, preserves class name,
method name, and method signature. It does not keep a reference to the class in order not to prevent it from being reclaimed by the garbage collector. However, the
user may specify a custom MIDFactoryimplementation (see Fig.3) with the
sys-tem propertyorg.jp.MIDFactoryin order to use a differentMIDimplementation
(e.g., to preserve information concerning the class loader, etc.).
5 Thread-local variables are instances ofjava.lang.ThreadLocal. Each thread has its own instance of
a thread-local variable. Internally, thread-local variables are implemented by a map associated with each Threadobject.
public interface MID {} // method identifier public final class MIDImpl implements MID {
final String clName, mNameSig;
public MIDImpl(Class c, String mns) { clName = c.getName(); mNameSig = mns; } public String getClassName() { return clName; }
public String getMethodNameSig() { return mNameSig; } }
public interface MIDFactory {
public MID getMID(Class c, String mns); }
public final class MIDFactoryImpl implements MIDFactory { static MIDFactory midf;
static { try {
String f = System.getProperty("org.jp.MIDFactory"); midf = (f == null) ? new MIDFactoryImpl() :
(MIDFactory)Class.forName(f).newInstance(); }
catch (Exception e) { System.exit(1); } }
public static MID getMID_0(Class c, String mns) { return midf.getMID(c, mns); } public MID getMID(Class c, String mns) { return new MIDImpl(c, mns); }
}
Fig. 3. MID, MIDImpl, MIDFactory, and MIDFactoryImpl. 3.2 Rewriting Scheme
We rewrite JVM bytecode in order to pass the ICobject of the caller as an extra
argument to the callee method (i.e., we extend the signatures of all non-native
methods with an argument of typeIC). In the beginning of each method, the callee
invokesprofileCall(MID)on the receivedIC object in order to obtain its own
(i.e., the callee’s)ICobject (see Fig.1). profileCall(MID)looks up the callee’s
IC object based on the callee’s MID. If it exists (i.e., the same callee has already
been invoked before), the invocation counter is incremented and the IC object is
returned. Otherwise, a new IC instance is allocated, inserted into the map (using
the method identifier as key), and returned.
Because native code is not changed by the rewriting, we add simple wrapper methods with the unmodified signatures which obtain the current thread’s root
context by calling the static method RC.getRC(). Therefore, native code is able
to invoke Java methods with the unmodified signatures.6
For each method, we add a static field to hold the
correspond-ing MID instance. In the static initializer we call the static method
MIDFactoryImpl.getMID 0(Class, String) (see Fig. 3) in order to
allo-cate a MIDinstance for each method. If no custom MIDFactory implementation
is specified, instances of MIDImplare returned.
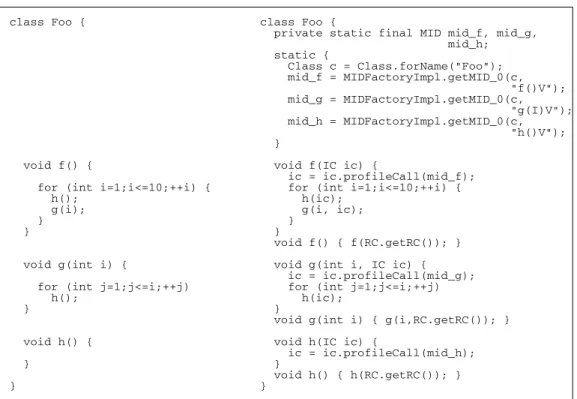
The example in Fig.4 illustrates this transformation scheme. To the left is the
classFoowith methodsf(),g(int), andh()before rewriting, to the right is the
rewritten version.7 If the rewritten version of method f()is invoked once, it will
6 For native methods, which we cannot rewrite, we add so-called ‘reverse’ wrappers which discard the extra
ICargument before invoking the native method. The ‘reverse’ wrappers allow rewritten code to invoke all methods with the additional argument, no matter whether the callee is native or not.
class Foo { class Foo {
private static final MID mid_f, mid_g, mid_h; static { Class c = Class.forName("Foo"); mid_f = MIDFactoryImpl.getMID_0(c, "f()V"); mid_g = MIDFactoryImpl.getMID_0(c, "g(I)V"); mid_h = MIDFactoryImpl.getMID_0(c, "h()V"); }
void f() { void f(IC ic) {
ic = ic.profileCall(mid_f); for (int i=1;i<=10;++i) { for (int i=1;i<=10;++i) {
h(); h(ic);
g(i); g(i, ic);
} }
} }
void f() { f(RC.getRC()); }
void g(int i) { void g(int i, IC ic) {
ic = ic.profileCall(mid_g); for (int j=1;j<=i;++j) for (int j=1;j<=i;++j)
h(); h(ic);
} }
void g(int i) { g(i,RC.getRC()); }
void h() { void h(IC ic) {
ic = ic.profileCall(mid_h);
} }
void h() { h(RC.getRC()); }
} }
Fig. 4. Rewriting example: MCT creation.
compute the following profiling information: f = 1, f.h= 10, f.g= 10, f.g.h= 55.
That is, f() was invoked once, h()and g(int) were invoked 10 times by f(),
andh()was called 55 times by g(int)10
i=1 i j=11 = 10 i=1i= 11∗210 = 55 .
3.3 Native Code Issues and Rewriting of JDK Classes
Whenever native code calls a rewritten Java method, it will invoke the wrapper method with the unmodified signature. That is, the caller’s invocation context is not passed and consequently the information concerning the call stack is lost. The wrapper method will obtain the root context and use it as the caller’s invocation context. Thus, all methods invoked by native code will appear as children nodes of the root context in the MCT, i.e., as siblings of the main method.
There are ways to (partly) recover the call stack in a wrapper method: For
instance, the ThrowableAPI can be exploited to obtain a stack trace. However,
this approach is not fully portable, since the ThrowableAPI allows a lot of
flexi-bility to the JVM implementor (e.g., the stack trace may be incomplete on certain JVMs). Moreover, the stack trace elements do not provide the signatures of the invoked methods. In order to avoid ambiguities, the rewriting tool would have to rename overloaded methods (methods of the same class with the same name but different signatures), e.g., by encoding the signature within the method name. Still, such an approach would not work with overloaded constructors (their names cannot be altered).
Because of these difficulties, JP currently only supports the scheme presented before, where all invocations of rewritten methods by native code appear as children of the root context. Because these callbacks from native code to rewritten Java code are not frequent, this inexactness does not cause much problems in practice.
Another issue is that currently JP does not create any invocation context for native methods. In principle, the ‘reverse’ wrapper of a native method could register the callee’s invocation context. However, even with that scheme we would not be able to track invocations of native methods that are called by other native methods. In order to profile the execution of Java methods provided by the Java Devel-opment Kit (JDK), the JDK classes have to be rewritten, too. In previous work
we have explained the difficulties of modifying classes of standard JDKs [8]. For
instance, if the JDK is rewritten, the classRCcannot rely on thread-local variables
but the Thread class has to be extended with a field holding a reference to the
thread’s root context. As we solved the difficulties of JDK rewriting in a similar
way as in previous work [8], we do not replicate these details here.
4
Bytecode Counting
JP provides precise execution statistics: For each method invocation context, it com-putes the number of executed bytecodes, which serves us as platform-independent
profiling metric. The number of executed bytecodes is stored in the instrfield of
theIC instances (see Fig.1).
JP instruments the bytecode of methods in order to increment the instr
counter according to the number of executed bytecodes.8 For each Java method,
JP performs a basic block analysis (BBA) to compute a control flow graph. In the
beginning of each basic block it inserts a code sequence that increments theinstr
counter by the number of bytecodes within the basic block.
The BBA algorithm is not hard-coded in JP, via a system property the user can specify a custom analysis algorithm. JP itself offers two built-in BBA algorithms, which we call ‘Default BBA’ resp. ‘Precise BBA’. In the ‘Default BBA’, only byte-codes that may change the control flow non-sequentially (i.e., jumps, branches, re-turn of method or JVM subroutine, exception throwing) end a basic block. Method, constructor, or JVM subroutine invocations do not end basic blocks of code, be-cause we assume that the execution will return after the call. This definition of
basic block corresponds to the one used in [10].
The advantage of the ‘Default BBA’ is that it creates rather large basic blocks.
Therefore, the number of locations is reduced where updates to theinstrcounter
have to be inserted, resulting in a lower profiling overhead. As long as no exceptions are thrown, the resulting profiling information is precise. However, exceptions (e.g., an invoked method may terminate abnormally throwing an exception) may cause some (minor) imprecision in the accounting, as we always count all bytecodes in a basic block, even though some of them may not be executed in case of an exception. 8 As theinstrfield is directly incremented for performance reasons, it has been declared publicin
void f() { void f(IC ic) {
ic = ic.profileCall(mid_f); ic.instr += 2;
int i = 1; int i = 1;
while (true) { while (true) {
ic.instr += 3;
if (i <= 10) { if (i <= 10) {
ic.instr += 7;
h(); h(ic);
g(i); g(i, ic);
++i; ++i; } } else { else { ic.instr += 1; return; return; } } } } } } void f() { f(RC.getRC()); } Fig. 5. Rewriting example: Bytecode counting.
I.e., using the ‘Default BBA’, we may count more bytecodes than are executed. If the user wants to avoid this potential imprecision, he may select the ‘Pre-cise BBA’, which ends a basic block after each bytecode that either may change the control flow non-sequentially (as before), or may throw an exception. As there
are many bytecodes that may throw an exception (e.g.,NullPointerException
may be raised by most bytecodes that require an object reference), the resulting average basic block size is very small (in the code samples we examined most blocks had a size between 1 and 4). This inevitably results in a higher overhead for
byte-code counting, because each basic block is instrumened by JP. In Section 6we will
compare the performance of the ‘Default BBA’ and the ‘Precise BBA’.
The rewriting example in Fig.5illustrates the insertion of code in the beginning
of each basic block in order to compute the number of executed bytecodes.9 In
this example we applied the ‘Default BBA’, i.e., the one where only bytecodes that may change the control flow non-sequentially end basic blocks. For instance, the
basic block inside of theif()statement consists of 7 bytecodes: Loading thethis
reference onto the stack, invocation of h(), loading the this reference onto the
stack, loading the value ofionto the stack, invocation of g(int), incrementation
of i, jump to the begin of the loop. If the ‘Precise BBA’ was used, there would be
3 blocks (and hence 3 updates to the instrcounter) within the if()statement,
since the invocations of h()andg(int)would both end a basic block.
5
Periodic Activation of Custom Profiling Agents
5.1 Profiling Agents
JP supports user-defined profiling agents which are periodically invoked by each thread in order to aggregate and process the profiling information collected by the
thread. The custom profiling agent has to implement theProfilerinterface shown
9 Methodf() to the left in Fig.5 corresponds to method f()to the left in Fig. 4. We replaced the
for()loop with an equivalentwhile()construct in order to better show the basic block structure of the compiled bytecode. A standard Java compiler translates both versions of methodf()to exactly the same JVM bytecode sequence.
public interface Profiler {
public int register(Thread t, RC rc); public int report(RC rc, IC currentIC); }
Fig. 6. Profiler interface.
public final class RC extends IC { ...
static Profiler profiler; public int activationCounter;
public void triggerReport(IC currentIC) {
activationCounter = profiler.report(this, currentIC); }
void initialize() {
activationCounter = profiler.register(Thread.currentThread(), this); }
... }
Fig. 7. Part of the RC implementation.
in Fig.6. When a new thread starts executing, it first creates its root context and
then calls theregister(Thread, RC)method of the profiling agent. The static
method RC.getRC() (see Fig. 2) stores the new root context in a thread-local
variable before invoking theinitialize() method given in Fig.7, which in turn
registers the new thread and its root context with the profiling agent.
During execution, each thread periodically invokes the report(RC, IC)
method of the profiling agent. This method receives the calling thread’s root context and current execution context. Starting with the root context, the profiling agent can traverse the calling thread’s MCT, integrating it into its state. The current ex-ecution context tells the profiling agent which method the calling thread currently
executes. The value returned by the profiling agent’s register(Thread, RC)
andreport(RC, IC)methods is the currentprofiling granularity, i.e., the approx-imate number of bytecodes to be executed by the calling thread until it will invoke
report(RC, IC) again. The profiling agent may change the profiling
granular-ity upon each invocation ofreport(RC, IC) and may apply a different profiling
granularity to each thread.
The periodic activation allows the profiling agent to process the collected pro-filing information throughout program execution, which is particularly useful to display up-to-date profiling information of long running programs, such as appli-cation servers. Moreover, the periodic scheduling of the profiling agent
guaran-tees that the full range of the invocand instrcounters (see Fig. 1), which are
32 bit values, is not exceeded. As the profiling granularity is limited to 231 −1
(Integer.MAX VALUE), the invoc and instr counters may overflow at most
once. The eventual overflow is handled by the getInvoc() and getInstr()
methods ofIC, which treat these variables as unsigned values (see Fig. 1). Having
integrated the calling thread’s MCT into its state, the profiling agent has to reset theinvoc andinstrcounters to zero. Access to the MCT need not be
synchro-nized, since thereport(RC, IC) method is called synchronously by the thread
5.2 Rewriting Scheme
In order to schedule the regular activation of the custom profiling agent, each thread maintains an upper bound of the number of executed bytecodes since
the last invocation of the report(RC, IC) method. This value is kept in the
activationCounter field of each thread’s root context. In order to make this counter accessible within each method (without resorting to thread-local variables, which would cause high overhead), we pass the root context as an
additional argument to all invocations of non-native methods/constructors. If
activationCounter reaches or exceeds the current profiling granularity, the
thread calls triggerReport(IC), which in turn invokes the profiling agent (see
Fig. 7). Note that the value of activationCounter is not part of the profiling
statistics, it is only used at runtime to ensure the periodic activation of the profiling agent.
As an optimization, the value of activationCounter runs from the current
profiling granularity down to zero, because there are dedicated bytecodes for the comparison with zero. The following conditional is used to schedule the periodic activation of the profiling agent:
if (rc.activationCounter <= 0) rc.triggerReport(ic);
activationCounteris decremented in a similar way as theinstrcounter is
incremented (see Section 4). However, in order to reduce the overhead, we do not
decrement it in the beginning of every basic block of code: activationCounteris
updated in the beginning of each method, exception handler, and JVM subroutine, as well as in the beginning of each loop. Each time it is decremented by the number of bytecodes on the longest execution path until the next update or until the method
terminates. This ensures that the value of activationCounter represents an
upper bound of the number of executed bytecodes.
The conditional that checks whethertriggerReport(IC)has to be called is
inserted in the beginning of each method and in each loop, in order to ensure that it is present in recursions and iteration. As an optimization, we omit the conditional in the beginning of a method, if before invoking any method/constructor, each execution path either terminates or passes by an otherwise inserted conditional. For instance, this optimization allows to remove the check in the beginning of leaf methods.
The example in Fig. 8 illustrates the complete rewriting done by JP: Each
method receives two extra arguments, the root context and the caller’s invocation
context. activationCounter is updated in the beginning of the method and in
the loop. It is decremented by the number of bytecodes on the longest execution path until the next update or method termination. For instance, in the loop it is decremented by 10 (3 + 7), as this is the length of the execution path if the loop is repeated. The other path, which returns, executes only 4 bytecodes (3 + 1). The conditional is present in the loop, but not in the beginning of the method, since the
void f() { void f(RC rc, IC ic) { ic = ic.profileCall(mid_f); rc.activationCounter -= 2; ic.instr += 2;
int i = 1; int i = 1;
while (true) { while (true) {
rc.activationCounter -= 10; if (rc.activationCounter <= 0) rc.triggerReport(ic); ic.instr += 3; if (i <= 10) { if (i <= 10) { ic.instr += 7; h(); h(rc, ic);
g(i); g(i, rc, ic);
++i; ++i; } } else { else { ic.instr += 1; return; return; } } } } } } void f() { RC rc = RC.getRC(); f(rc, rc); }
Fig. 8. Rewriting example: Periodic activation of profiling agent.
only possible execution path passes by the conditional in the loop before invoking any method.
5.3 Loading of Custom Profiling Agents
If the JDK classes are rewritten for profiling, it is important not to disturb the sequence in which the JVM loads its core classes. As the custom profiling agent may exploit arbitrary JDK classes, it is crucial to defer its loading and instantiation until the bootstrapping of the JVM is completed. Since we have described a solution
to a similar problem with bootstrapping of a modified JDK in previous work [19],
we do not replicate the details in this paper. We assume that the static variable
RC.profiler(see Fig.7) is set after the bootstrapping to hold a reference to the custom profiling agent.
In contrast to the user-defined profiling agent, which is loaded after the JVM has
finished bootstrapping, the classesICandRC, as well as the implementations ofMID
andMIDFactory (see Fig. 3), which may be customized, are loaded already very early during the JVM bootstrapping. Consequently, they shall not depend on other
classes (apart from core classes, such as String, Class, etc.). For instance, they
cannot use classes from the Java utility package, such as collections. The provider
of a profiling agent may either rely onMIDImpl, the default implementation ofMID
(see Fig.3), or provide his own implementations of MIDandMIDFactory. In the
latter case, he has to be very careful not to use helper classes that may disrupt the bootstrapping of the JVM.
5.4 Example Profiling Agent
In the following we sketch the structure of a simple profiling agent (SPA) which
lim-itations, we do not show the program code but summarize only the interesting implementation aspects. SPA is used in a similar way as the standard profilers
included in many JDKs, such as those invoked by the ‘-prof’, ‘-Xrunhprof’, or
‘-agentlib:hprof’ (the latter since JDK 1.5.0) command line options: It col-lects execution statistics which are written to a file after completion of the profiled
program. Existing tools, such as prophIt10, may be used to visualize the output.
SPA implements the Profiler interface and relies on the default
implemen-tation of MID. It maintains a single, global MCT (GMCT) for all threads. In
the GMCT, the invocation and bytecode counters are 64 bit values (i.e.,
over-flows are not an issue). All SPA operations, such as register(Thread, RC)
andreport(RC, IC), are synchronized in order to ensure the consistency of the
GMCT. Whenever a thread invokes SPA’s report(RC, IC) method, the calling
thread’s MCT is recursively copied into the GMCT. For nodes that already exist in the GMCT, the invocation and bytecode counters are incremented accordingly, otherwise a new node is created. While transferring the calling thread’s profiling
information into the GMCT, the invocandinstr counters of the ICobjects in
the thread’s MCT are reset to zero.
In order to collect the profiling information of terminated threads, SPA keeps
a weak reference (i.e., an instance of java.lang.ref.WeakReference) to each
registered thread. The weak reference does not prevent the thread object from being reclaimed by the garbage collector. When the thread object referenced by the weak reference is garbage collected (which implies that the thread has terminated), the weak reference is enqueued in a reference queue. SPA keeps track of the weak
references to registered threads and maintains references to the corresponding RC
instances. SPA uses a dedicated, high-priority daemon thread that waits for weak references to be enqueued in the reference queue. If this happens, the deamon thread copies the terminated thread’s MCT into the GMCT (in a synchronized way) and ensures that the terminated thread’s root context is not kept alive in order to allow the garbage collector to reclaim the thread’s MCT.
SPA employs a shutdown hook, a dedicated thread that starts running when the JVM is about to terminate, i.e., when the program exits normally (the last
non-daemon thread has terminated orSystem.exit(int)is called), or when the
JVM is terminated in response to a user interrupt. The shutdown hook writes the collected profiling information (i.e., the GMCT) into a file.
6
Evaluation
To evaluate the overhead caused by our profiling scheme, we used the SPEC JVM98
benchmark suite11 (problem size 100), which consists of 7 benchmarks, as well as
the SPEC JBB2000 benchmark12 (warehouse sequence 1, 2, 3, 4, 5, 6, 7, 8) on a
Linux Fedora Core 2 computer (Intel Pentium 4, 2.66 GHz, 512 MB RAM). The met-10http://prophit.westslopesoftware.com/
11http://www.spec.org/osg/jvm98/ 12http://www.spec.org/osg/jbb2000/
hprof JP without bytecode counting JP with bytecode counting, 'Default BBA' JP with bytecode counting, 'Precise BBA' 621.72 924.76 97.54 455.69 440.85 318.83 530.02 268.55 2.45 2.56 1.00 2.18 1.97 9.29 1.17 2.25 2.78 2.91 1.01 2.37 2.17 10.00 1.26 2.45 2.10 3.22 3.23 1.04 2.48 3.05 11.36 1.31 2.76 3271.22 1.99 2.19 1 10 100 1000 10000 compress jess db javac mpegaudio mtrt jack Geo. mean JVM98 JBB2000 804.73 1015.25 104.92 448.03 946.92 313.29 661.71 325.78 2.14 2.31 1.00 2.11 2.63 9.61 1.21 2.28 1.92 2.68 2.57 1.02 2.45 3.24 10.58 1.30 2.59 2.07 2.89 2.85 1.03 2.65 3.82 11.02 1.30 2.76 2.14 4875.38 1 10 100 1000 10000 compress jess db javac mpegaudio mtrt jack Geo. mean JVM98 JBB2000 21.45 37.82 2.12 105.21 47.94 44.55 20.51 25.95 12.24 3.12 2.40 1.01 4.09 3.24 14.47 1.20 2.90 2.17 3.60 2.58 1.01 4.64 3.64 15.09 1.21 3.12 2.30 3.64 2.59 1.04 4.90 4.36 15.14 1.22 3.25 2.41 1 10 100 1000 10000 compress jess db javac mpegaudio mtrt jack Geo. mean JVM98 JBB2000
(a) Sun JDK 1.5.0 ‘client’ mode (b) Sun JDK 1.5.0 ‘server’ mode (c) IBM JDK 1.4.2 ‘default’ mode
Fig. 9. Profiling overhead (slowdown factor) for different profiler settings and JDKs.
ric used by SPEC JVM98 is the execution time in seconds, whereas SPEC JBB2000 measures the throughput in operations/second. All benchmarks were run in single-user mode (no networking) and we removed background processes as much as pos-sible in order to obtain reproducible results. For each setting and each benchmark, we took the median of 10 runs. For the SPEC JVM98 suite, we also computed the geometric mean of the 7 benchmarks. Here we present the measurements made with the Sun JDK 1.5.0 platform in its ‘client’ and ‘server’ modes, as well as with the IBM JDK 1.4.2 platform in its ‘default’ execution mode.
Fig. 9 shows the profiling overhead for different profiling settings. For
the SPEC JVM98 benchmarks (resp. the SPEC JBB2000 benchmark),
the overhead is computed as a factor of execution time with profiling
execution time without profiling
resp. operations/second without profiling
operations/second with profiling
. To compare our profiler with a stan-dard profiler based on the JVMPI/JVMTI, we also evaluated the overhead caused by the ‘hprof’ profiling agent shipped with the standard JDKs. On Sun’s JVMs
we started the profiling agent ‘hprof’ with the ‘-agentlib:hprof=cpu=times’
option, which activates JVMTI-based profiling (available since JDK 1.5.0), whereas
on IBM’s JVM we used the ‘-Xrunhprof:cpu=times’ option for JVMPI-based
profiling. The argument ‘cpu=times’ ensures that the profiling agent tracks every
method invocation, as our profiling scheme does.
Because the overhead caused by the ‘hprof’ profiling agent is 1–2 orders of
mag-nitude higher than the overhead caused by JP, Fig.9uses a logarithmic scale. For
‘mtrt’, which is the most object-oriented benchmark in the JVM98 suite according
to [15], the overhead due to ‘hprof’ exceeds factor 3000 on both Sun JVMs. For the
530–660 on Sun’s JVMs and of factor 26 on IBM’s JVM, while for SPEC JBB2000, the slowdown is of factor 270–330 on Sun’s JVMs and of factor 12 on IBM’s JVM.
In all tests with JP, we used the simple profiling agent described in Section 5.4
with the highest possible profiling granularity (231−1). On average, the slowdown
due to JP is of factor 2,3–3,3 for the SPEC JVM98 suite, and of factor 1,9–2,4 for SPEC JBB2000. On Sun JVMs, the relative overhead due to JP is lower than on IBM’s JVM. However, in absolute time, JP-based profiling on IBM’s JVM is faster than on Sun’s JVM in its ‘client’ mode, and about 10% slower than on Sun’s JVM in its ‘server’ mode.
We evaluated our JP profiler in 3 different settings: Without per-method byte-code counting (i.e., generating MCTs including only the method invocation coun-ters, but not the bytecode counters), with bytecode counting based on the ‘De-fault BBA’, and with bytecode counting using the ‘Precise BBA’. In all 3 settings the profiling agent was activated exactly in the same way. The overhead caused by bytecode counting is relatively small compared to the overhead due to the method invocation counting (preserving the complete call stack). In particular on IBM’s JVM, the difference is negligible for most benchmarks. Also the ‘Precise BBA’ does not cause much extra overhead on IBM’s JVM.
In order to measure the imprecision caused by the ‘Default BBA’, we compared profiles of the SPEC JVM98 benchmarks generated with the ‘Default BBA’ resp. with the ‘Precise BBA’ regarding the total number of bytecodes counted in
all method invocation contexts (bdef ault resp. bprecise). We measured the relative
errorδb as follows:
δb=
b
def ault−bprecise
bprecise = b def ault bprecise −1
For ‘javac’,δbis 6,66·10−5; for ‘jack’,δb is 6,45·10−3. For all other benchmarks
in the SPEC JVM98 suite, δbis zero. The bigger relative error δb for ‘jack’ (which
is still below 1%) is not surprising, because ‘jack’ is known to be a particularly
exception-intensive program [11,22]. We conclude that in practice, the imprecision
caused by the ‘Default BBA’ is minor.
7
Discussion
In this section we discuss the strengths and limitations of our profiling framework. First and most importantly, our profiling scheme is fully portable. JP and all its runtime classes are implemented in pure Java and all program transformations follow a strict adherence to the specification of the Java language and virtual machine. JP has been successfully tested with several standard JVMs.
In contrast to Java profiling agents based on the JVMPI [23] and the JVMTI [24],
which are implemented in native code, JP enables the implementation of portable profiling agents in pure Java, i.e., a single profiling agent may be deployed in all kinds of Java environments. Moreover, JP-based profiling is also applicable to JVMs that support neither the JVMPI nor the JVMTI. JP offers a simple but flexible API to implement a wide range of different profiling agents. The profiling agent can control
the frequency of its periodic activation by adjusting the profiling granularity. The activation does not rely on the scheduling of the JVM (which is not well specified
in the Java language and JVM specifications [16,21]), because each thread in the
system synchronously invokes the profiling agent after execution of a number of bytecodes that approximately corresponds to the current profiling granularity.
JP preserves the full method call stack, whereas most other Java profilers only preserve the call stack up to a limited depth. This allows a more detailed analysis of the program behaviour. Furthermore, JP performs exact profiling, i.e., each method invocation (with the exception of native methods) is registered. This is in contrast to frequently used sampling techniques, where the profiler is activated only periodically (e.g., every few milliseconds). While sampling causes less overhead, it
is not always accurate.13 Our profiling approach allows to significantly reduce the
overhead of exact profiling (see measurements above), so that it may be applicable also in settings where sampling techniques had to be used because of long program execution times. Consequently, JP may become a valuable tool for Java software developers.
Another interesting contribution of our approach is the use of a portable, platform-independent profiling metric. Instead of measuring CPU time, JP com-putes the number of bytecodes that a program would execute without profiling. Hence, measurement perturbation is not an issue (at least for programs with deter-ministic thread scheduling) because the presence of measurements does not influ-ence the measurement results, as it is the case with existing Java profilers that may prevent certain JVM optimizations.
It should be noted that bytecode counting and CPU time are distinct metrics for different purposes. While profiles based on bytecode counting are platform-independent, exactly reproducible (for deterministic programs), directly comparable across different environments (assuming the same Java class library), and valuable to gain insight into algorithm complexity, more research is needed in order to as-sess to which extend and under which conditions these profiles allow an accurate prediction of CPU time for a concrete system. For this purpose, individual (se-quences of) bytecodes may receive different weights according to their complexity. This weighting is specific to a particular execution environment and may be gener-ated by a calibration mechanism. Therefore, such an approach would sacrifice the platform-independence of collected profiles.
Concerning limitations, the major hurdle of our approach is that it cannot di-rectly account for the execution of native code. For programs that heavily depend on native code, the profiling information obtained by JP may be incomplete. This is an inherent problem of our approach, since it relies on the transformation of Java code and on the counting of the number of executed bytecodes. A related problem with native code is that currently JP does not provide the full call stack for Java
methods invoked by native code. In Section3.3 we have sketched some ideas how
13We evaluated the overlap percentage [3] of a sampling profile produced by the standard ‘hprof’ profiling
agent (setting ‘cpu=samples,interval=1’) with a profile generated by ‘hprof’ in its exact profiling mode (setting ‘cpu=times’). For the SPEC JVM98 benchmarks, the average overlap percentage was below 7%.
to mitigate these restrictions.
If classes are transformed only statically before program execution,
dynami-cally created or downloaded classes are not instrumented. To solve this
prob-lem, dedicated classloaders could be used that instrument such classes at load
time. JDK 1.5 also supports load-time instrumentation in pure Java with the
java.lang.instrumentpackage, which we could leverage to transform dynam-ically created classes.
As JP preserves the full call stack without any limitation of the depth, it may consume a significant amount of memory in the case of very deep recursions. Ac-cording to Ball and Larus, path profiling (i.e., preserving exact execution history)
is feasible for a large portion of programs [5]. This is confirmed by our benchmarks.
In order to reduce the memory consumption, we are considering to allow profiling agents to discard a subtree of the calling thread’s MCT, if the current execution
context is not part of that subtree and if the invoc andinstr counters in that
subtree indicate that the corresponding methods have not been executed recently. If the thread executed again these methods, the MCT would be recreated auto-matically. This technique would be particularly useful in systems that use thread pooling, i.e., where the same thread may be reused to execute different software components.
8
Related Work
Fine-grained instrumentation of binary code has been used for profiling in prior
work [20]. In contrast, all profilers based on a fixed set of events like the one provided
by JVMPI [23] are restricted to traces at the granularity of the method call. This
restriction also exists with the current version of JP and is justified by the fact that object-oriented Java programs tend to have shorter methods with simpler internal control flows than code implemented in traditional, imperative languages. Another specificity of object-oriented languages is that because of late binding, they give profilers less room for static analysis and optimization strategies at the method call level in order to reduce runtime overheads. Thus, the kind of techniques described
in [4], which apply to static structures such as intraprocedural control flows, cannot
be generalized to our case. One possible future adaption could be to try to take
advantage of all method calls which do not imply late binding (i.e., calls tostatic
or private Java methods). However, whole-program analysis and optimization is currently not an option, since it would impose limitations on the possibility of profiling only parts of the code, or of profiling applications with dynamic class loading.
Some Java profilers take advantage of bytecode instrumentation to be less ob-trusive and to enable the JVM to function at full speed. JVMPI, which was always stamped as an experimental technology by Sun, but on which many commercial
(e.g., JProbe14) and academic (e.g., JPMT [17]) profilers are based, is now being
phased out in favour of its successor JVMTI [24]. JVMTI has built-in bytecode
instrumentation facilities in order to let profiling agents go beyond the JVMTI API and implement customized, less disruptive profiler events. Profiling agents based on the JVMTI still have to be written in native, C compatible languages. As described earlier in this paper, initial tests with Sun JDK 1.5.0 show that the overhead caused by the standard ‘hprof’ agent using the new JVMTI interface remains very high.
The NetBeans Profiler15 integrates Sun’s JFluid profiling technology [13] into
the NetBeans IDE. JFluid exploits dynamic bytecode instrumentation and code hotswapping in order to turn profiling on and off dynamically, for the whole appli-cation or just a subset of it. However, this tool needs a customized JVM and is only available for a limited set of environments.
Whereas we perform exact profiling, other approaches use sampling in order to
minimize the overhead, but at the price of a possible loss of precision, as e.g. [26].
An interesting technique using counter-based code instrumentation like we do, but
in order to produce profiling samples, is described in [3]. We also implemented
a sampling profiler that approximates the number of executed bytecodes in each
calling context [7]. While such an approach reduces overhead, the profiles lack
method invocation counters and, depending on the profiled application, may suffer from limited accuracy.
Hardware performance counters that record events, such as instructions exe-cuted, cycles exeexe-cuted, pipeline stalls, cache misses, etc. are often exploited for
profiling. In [2] hardware performance metrics are associated with execution paths.
Recently, the Jikes RVM [1], an open source research virtual machine that offers
a flexible testbed for prototyping virtual machine technology, has been enhanced to generate traces of hardware performance monitor values for each thread in the
system [25]. In [18] the authors introduce ‘vertical profiling’, which combines
hard-ware and softhard-ware performance monitors in order to improve the understanding of system behaviour by correlating profile information from different levels. All these approaches aim at generating precise profiling information for a particular environment, with a focus on improving virtual machine implementations. In con-trast, JP is a developer tool that helps in program analysis. JP does not rely on any platform-specific features in order to offer a completely portable profiling sys-tem that allows developers to profile applications in their preferred environment, generating reproducible profiles.
In [12] the authors show that profiles based on bytecode counting are valuable
to detect algorithmic inefficiencies and help the developer to focus on those parts of
a program that suffer from high algorithmic complexity. However, in [12] a simple
profiler is used, which causes excessive overhead. Moreover, aspects concerning multi-threading and native code are not addressed.
Much of the know-how worked into JP comes from previous experience gained
with the Java Resource Accounting Framework, Second Edition (J-RAF2) [9,19],
which also uses bytecode instrumentation in order to gather dynamic information about a running application. JP is nevertheless a different project with distinct
objectives, which entails new and enhanced implementation techniques. J-RAF2 is targeting resource accounting and control. Hence, it manages only a single bytecode
counter per thread, a scalar, comparable with the activationCounter field in
the JP root context. From this point of view, J-RAF2 is much simpler than JP, a fact which is reflected by its lower runtime overheads, which may go below 20%. Another important difference lies in the fact that J-RAF2 has to give resource managers (the equivalent of profiling agents in JP) direct control on the execution rate of supervised threads, or to dynamically change resource management strategies. This means that J-RAF2 has to solve many concurrency issues that do not exist in the profiling setting.
9
Conclusion
In this paper we presented JP, an exact profiler for the JVM that makes extensive use of program transformations in order to overcome many limitations of existing Java profilers. Whereas prevailing exact profilers measure the CPU time spent in different calling contexts, JP exploits the number of executed bytecodes as platform-independent, dynamic metric. The design principles behind our proposal bring many benefits, such as compatibility with any kind of JVM, flexibility due to user-defined profiling agents, full portability of profiling agents that can be written in pure Java, reproducible results, minimized measurement perturbation, and reduced overhead.
References
[1] Alpern, B., C. R. Attanasio, J. J. Barton, B. Burke, P. Cheng, J.-D. Choi, A. Cocchi, S. J. Fink, D. Grove, M. Hind, S. F. Hummel, D. Lieber, V. Litvinov, M. F. Mergen, N. Ngo, J. R. Russell, V. Sarkar, M. J. Serrano, J. C. Shepherd, S. E. Smith, V. C. Sreedhar, H. Srinivasan and J. Whaley, The Jalape˜no virtual machine, IBM Systems Journal39(2000), pp. 211–238.
[2] Ammons, G., T. Ball and J. R. Larus,Exploiting hardware performance counters with flow and context sensitive profiling, in:PLDI ’97: Proceedings of the ACM SIGPLAN 1997 conference on Programming language design and implementation(1997), pp. 85–96.
[3] Arnold, M. and B. G. Ryder,A framework for reducing the cost of instrumented code, in:SIGPLAN Conference on Programming Language Design and Implementation, 2001, pp. 168–179.
[4] Ball, T. and J. R. Larus,Optimally profiling and tracing programs, ACM Transactions on Programming Languages and Systems16(1994), pp. 1319–1360.
[5] Ball, T. and J. R. Larus,Efficient path profiling, in:International Symposium on Microarchitecture, 1996, pp. 46–57.
[6] Binder, W.,A portable and customizable profiling framework for Java based on bytecode instruction counting, in:Third Asian Symposium on Programming Languages and Systems (APLAS 2005), Lecture Notes in Computer Science3780(2005), pp. 178–194.
[7] Binder, W.,Portable and accurate sampling profiling for Java, Software: Practice and Experience36 (2006), pp. 615–650.
[8] Binder, W. and J. Hulaas,Extending standard Java runtime systems for resource management, in: Software Engineering and Middleware (SEM 2004), LNCS (Lecture Notes in Computer Science)3437, Linz, Austria, 2004, pp. 154–169.
[9] Binder, W. and J. Hulaas,A portable CPU-management framework for Java, IEEE Internet Computing 8(2004), pp. 74–83.
[10] Binder, W., J. G. Hulaas and A. Villaz´on,Portable resource control in Java, ACM SIGPLAN Notices 36 (2001), pp. 139–155, proceedings of the 2001 ACM SIGPLAN Conference on Object Oriented Programming, Systems, Languages and Applications (OOPSLA’01).
[11] Cierniak, M., G.-Y. Lueh and J. M. Stichnoth,Practicing JUDO: Java under dynamic optimizations, ACM SIGPLAN Notices35(2000), pp. 13–26.
[12] Cooper, B. F., H. B. Lee and B. G. Zorn,ProfBuilder: A package for rapidly building Java execution profilers, Technical Report CU-CS-853-98, University of Colorado at Boulder, Department of Computer Science (1998).
[13] Dmitriev, M.,Profiling Java applications using code hotswapping and dynamic call graph revelation, in: WOSP ’04: Proceedings of the Fourth International Workshop on Software and Performance (2004), pp. 139–150.
[14] Dufour, B., K. Driesen, L. Hendren and C. Verbrugge,Dynamic metrics for Java, ACM SIGPLAN Notices38(2003), pp. 149–168.
[15] Dujmovic, J. and C. Herder, Visualization of Java workloads using ternary diagrams, Software Engineering Notes29(2004), pp. 261–265.
[16] Gosling, J., B. Joy, G. L. Steele and G. Bracha, “The Java language specification,” Java series, Addison-Wesley, Reading, MA, USA, 2000, second edition, xxv + 505 pp.
[17] Harkema, M., D. Quartel, B. M. M. Gijsen and R. van der Mei, Performance monitoring of Java applications, in:Proceedings of the 3rd International Workshop on Software and Performance (WOSP-02)(2002), pp. 114–127.
[18] Hauswirth, M., P. F. Sweeney, A. Diwan and M. Hind,Vertical profiling: Understanding the behavior of object-oriented applications, in: OOPSLA ’04: Proceedings of the 19th annual ACM SIGPLAN Conference on Object-oriented programming, systems, languages, and applications (2004), pp. 251– 269.
[19] Hulaas, J. and W. Binder,Program transformations for portable CPU accounting and control in Java, in: Proceedings of PEPM’04 (2004 ACM SIGPLAN Symposium on Partial Evaluation & Program Manipulation), Verona, Italy, 2004, pp. 169–177.
[20] Larus, J. R. and T. Ball,Rewriting executable files to measure program behavior, Software–Practice and Experience24(1994), pp. 197–218.
[21] Lindholm, T. and F. Yellin, “The Java Virtual Machine Specification,” Addison-Wesley, Reading, MA, USA, 1999, second edition.
[22] Ogasawara, T., H. Komatsu and T. Nakatani, A study of exception handling and its dynamic optimization in Java, ACM SIGPLAN Notices 36 (2001), pp. 83–95, proceedings of the 2001 ACM SIGPLAN Conference on Object Oriented Programming, Systems, Languages and Applications (OOPSLA’01).
[23] Sun Microsystems, Inc.,Java Virtual Machine Profiler Interface (JVMPI), Web pages athttp:// java.sun.com/j2se/1.4.2/docs/guide/jvmpi/.
[24] Sun Microsystems, Inc.,JVM Tool Interface (JVMTI), Version 1.0, Web pages athttp://java.sun. com/j2se/1.5.0/docs/guide/jvmti/.
[25] Sweeney, P. F., M. Hauswirth, B. Cahoon, P. Cheng, A. Diwan, D. Grove and M. Hind,Using hardware performance monitors to understand the behavior of Java applications., in:Virtual Machine Research and Technology Symposium, 2004, pp. 57–72.
[26] Whaley, J.,A portable sampling-based profiler for Java Virtual Machines, in:Proceedings of the ACM 2000 Conference on Java Grande(2000), pp. 78–87.