Supporting Information for
Optimization of Nazarov Cyclization of
2,4-Dimethyl-1,5-Diphenylpenta-1,4-Dien-3-One in
Deep Eutectic Solvents by a Design of
Experiments Approach
Stefano Nejrotti,a Alberto Mannu,a* Marco Blangetti,a* Salvatore Baldino,a Andrea Finb and Cristina Prandia
aDepartment of Chemistry, University of Turin, Via Pietro Giuria 7, I-10125 Turin, Italy.
bDepartment of Drug Science and Technology, University of Turin, Via Pietro Giuria 9, I-10125 Turin, Italy
Table of contents
Procedure for the determination of reaction conversion and yield S1
List of experiments and statistical analyses S2
NMR spectra of the experiments S6
Surface Responding Analysis S44
S1
Procedure for the determination of reaction conversion and yield
Conversion and yield were determined on the crude reaction mixture by 1H NMR on a Jeol ECZR600 using CH3NO2 as internal standard. The reaction crude was dissolved in CDCl3, 0.5 equivalents of CH3NO2 (0.1 mmol, 5.4 μL) were added and the 1H NMR of the mixture was recorded. The integral of the CH3NO2 peak was set to 1.5.
For the conversion, the integral of the peak corresponding to the two methyl groups in the starting material S1 (6H, δ = 2.21 ppm)1 was used and the following equation was applied:
𝑐𝑜𝑛𝑣𝑒𝑟𝑠𝑖𝑜𝑛 (%) = (1 −𝑥(𝐒𝟏)
6 ) ⋅ 100
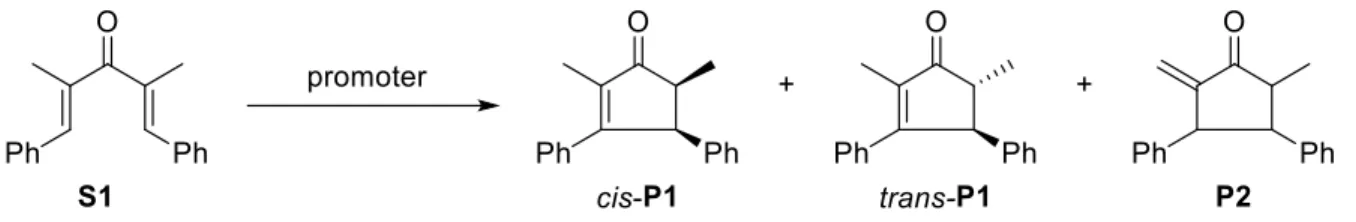
For the conversion to P1 and P2, the integral of the peak corresponding to CH group α to the carbonyl group in product P1 (1H, δ = 4.62 ppm for cis-P1, δ = 3.98 ppm for trans-P1)[1] or the integral of the peak corresponding to the terminal alkene protons in product P2 (1H, δ = 6.26 and 5.05 ppm)[2] were used and the following equations were applied:
𝑦𝑖𝑒𝑙𝑑 (%) = 𝑥(𝐏𝟏, 𝑐𝑖𝑠 + 𝑡𝑟𝑎𝑛𝑠) ⋅ 100 𝑦𝑖𝑒𝑙𝑑 (%) = 𝑥(𝐏𝟐) ⋅ 100
S2
Figure S1. Main products of the Nazarov cyclization.
Table S1. List of experiments for the full factorial screening design.
Experiment
Factors Responses
DES T (°C) Time (h) [S1][a] Total
Conversion (%)[b] Conversion in P1 (%)[b] 1 DES2 60 2 0.2 100 84 2 DES2 25 2 1.0 24 17 3 DES1 60 16 0.2 82 62 4 DES2 60 16 0.2 100 98 5 DES2 60 2 1.0 100 91 6 DES1 60 2 0.2 29 13 7 DES1 60 16 1.0 13 0 8 DES2 60 16 1.0 100 90 9 DES2 25 2 0.2 94 72 10 DES1 25 16 1.0 9 0 11 DES1 25 2 0.2 13 0 12 DES2 25 16 1.0 51 42 13 DES1 60 2 1.0 6 0 14 DES1 25 16 0.2 31 14 15 DES1 25 2 1.0 2 0 16 DES2 25 16 0.2 100 96
S3
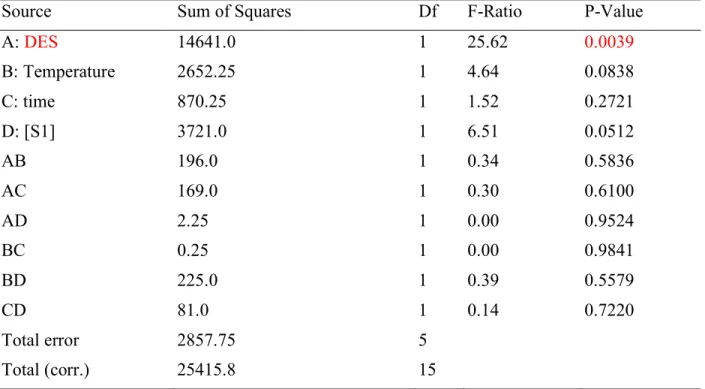
Table S2. Analysis of Variance for the response Total Conversion.
Source Sum of Squares Df F-Ratio P-Value
A: DES 14641.0 1 25.62 0.0039 B: Temperature 2652.25 1 4.64 0.0838 C: time 870.25 1 1.52 0.2721 D: [S1] 3721.0 1 6.51 0.0512 AB 196.0 1 0.34 0.5836 AC 169.0 1 0.30 0.6100 AD 2.25 1 0.00 0.9524 BC 0.25 1 0.00 0.9841 BD 225.0 1 0.39 0.5579 CD 81.0 1 0.14 0.7220 Total error 2857.75 5 Total (corr.) 25415.8 15
Table S3. Analysis of Variance for the response Conversion in P1.
Source Sum of Squares Df F-Ratio P-Value
A: DES 15687.6 1 32.21 0.0024 B: Temperature 2425.56 1 4.98 0.0760 C: time 976.563 1 2.01 0.2159 D: [S1] 2475.06 1 5.08 0.0739 AB 351.563 1 0.72 0.4343 AC 0.0625 1 0.00 0.9914 AD 27.5625 1 0.06 0.8214 BC 0.0625 1 0.00 0.9914 BD 138.063 1 0.28 0.6172 CD 370.563 1 0.76 0.4230 Total error 2435.31 5 Total (corr.) 24887.9 15
S4
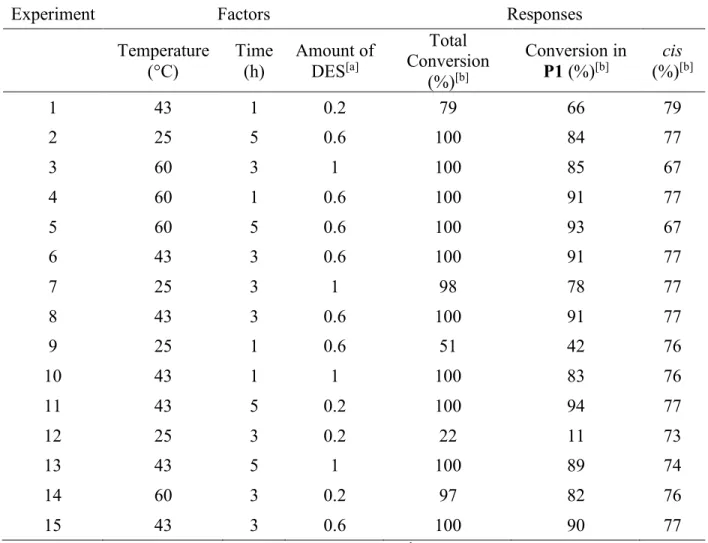
Table S4. List of the experiments.
Experiment Factors Responses
Temperature
(°C) Time (h) Amount of DES[a]
Total Conversion (%)[b] Conversion in P1 (%)[b] (%)cis [b] 1 43 1 0.2 79 66 79 2 25 5 0.6 100 84 77 3 60 3 1 100 85 67 4 60 1 0.6 100 91 77 5 60 5 0.6 100 93 67 6 43 3 0.6 100 91 77 7 25 3 1 98 78 77 8 43 3 0.6 100 91 77 9 25 1 0.6 51 42 76 10 43 1 1 100 83 76 11 43 5 0.2 100 94 77 12 25 3 0.2 22 11 73 13 43 5 1 100 89 74 14 60 3 0.2 97 82 76 15 43 3 0.6 100 90 77
[a] g of DES for 0.2 mmol of S1. [b]Determined by 1H NMR using nitromethane as internal standard.
Table S5. Analysis of variance for the group of experiments reported in Table S4.
Model yield cis selectivity conversion
Transformation none none none
Model d.f. 9 9 9 P-value 0.0177 0.0011 0.0304 Error d.f. 5 5 5 Stnd. error 9.83531 0.866025 11.1041 R-squared 93.38 97.91 91.64 Adj. R-squared 81.47 94.16 76.60
S5
Table S6. Statistical data for the implemented model.
Model yield cis selectivity conversion
Transformation none none none
Model d.f. 9 9 9 P-value 0.0177 0.0011 0.0304 Error d.f. 5 5 5 Stnd. error 9.83531 0.866025 11.1041 R-squared 93.38 97.91 91.64 Adj. R-squared 81.47 94.16 76.60
S6
NMR spectra of the experiments
S7
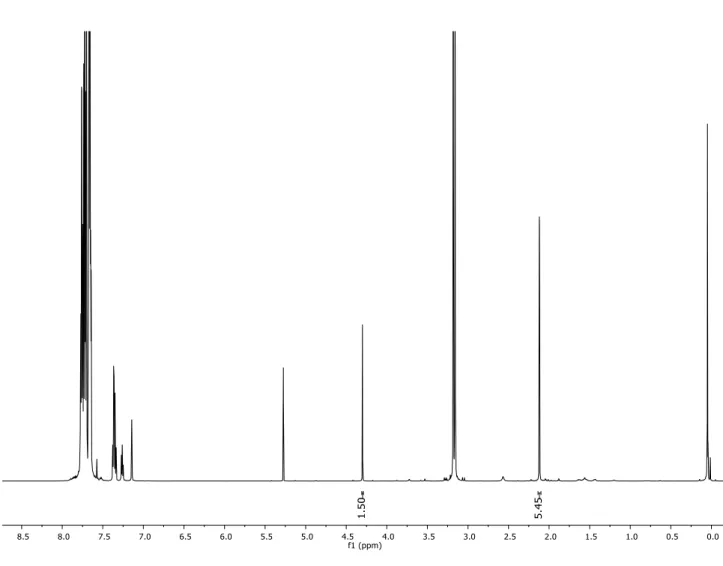
Figure S3. 1H NMR of the experiment 2, Table 1.
P2 P2
CH3NO2
S1
S8
S9
S10
S11
S12
S13
S14
S15
S16
S17
S18
S19
S20
S21
S22
S23
S24
S25
S26
S27
S28
S29
S30
S31
S32
S33
S34
S35
S36
S37
Figure S33. 1H NMR of the experiment 10, Table 7.
* peak used for cis-P1, since the peak at 4.60 is superimposed to another signal
S38
S39
S40
S41
S42
S43
S44
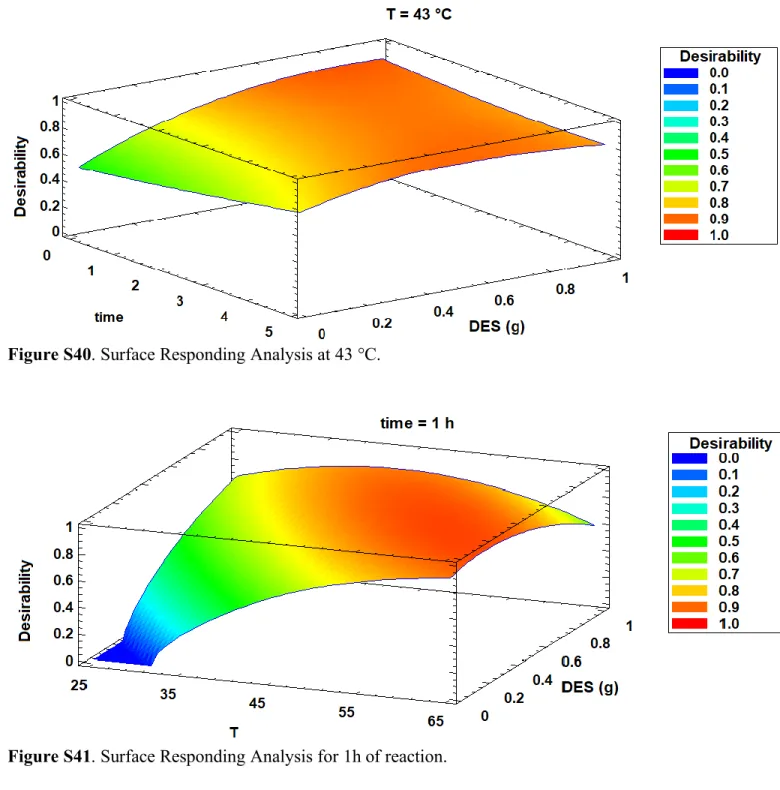
Surface Responding Analysis
Figure S40. Surface Responding Analysis at 43 °C.
S45
S46
References
[1] S. Nejrotti, M. Iannicelli, S. S. Jamil, D. Arnodo, M. Blangetti, C. Prandi, Green Chem. 2020, 22, 110-117.