Training on the Job: Behavioral Analysis of Job Interviews
in Hospitality
Skanda Muralidhar
Idiap Research InstituteEPFL, Switzerland
smuralidhar@idiap.ch
Laurent Son Nguyen
Idiap Research InstituteEPFL, Switzerland
lnguyen@idiap.ch
Denise Frauendorfer
University of Lausanne Switzerlanddenise.frauendorfer@unil.ch
Jean-Marc Odobez
Idiap Research Institute EPFL, Switzerland
odobez@idiap.ch
Marianne Schmid Mast
University of LausanneSwitzerland
Marianne.SchmidMast@unil.ch
Daniel Gatica-Perez
Idiap Research InstituteEPFL, Switzerland
gatica@idiap.ch
ABSTRACT
First impressions play a critical role in the hospitality industry and have been shown to be closely linked to the behavior of the person being judged. In this work, we implemented a behavioral training framework for hospitality students with the goal of improving the impressions that other people make about them. We outline the challenges associated with designing such a framework and em-bedding it in the everyday practice of a real hospitality school. We collected a dataset of 169 laboratory sessions where two role-plays were conducted, job interviews and reception desk scenarios, for a total of 338 interactions. For job interviews, we evaluated the re-lationship between automatically extracted nonverbal cues and var-ious perceived social variables in a correlation analysis. Further-more, our system automatically predicted first impressions from job interviews in a regression task, and was able to explain up to 32% of the variance, thus extending the results in existing litera-ture, and showing gender differences, corroborating previous find-ings in psychology. This work constitutes a step towards applying social sensing technologies to the real world by designing and im-plementing a living lab for students of an international hospitality management school.
CCS Concepts
•Applied computing→Psychology;Education;•Human-centered computing→Empirical studies in HCI;
Keywords
Social computing; job interview; nonverbal behavior; first impres-sions; multimodal interaction
Permission to make digital or hard copies of all or part of this work for personal or classroom use is granted without fee provided that copies are not made or distributed for profit or commercial advantage and that copies bear this notice and the full citation on the first page. Copyrights for components of this work owned by others than the author(s) must be honored. Abstracting with credit is permitted. To copy otherwise, or republish, to post on servers or to redistribute to lists, requires prior specific permission and/or a fee. Request permissions from permissions@acm.org.
ICMI ’16, November 12 - 16, 2016, Tokyo, Japan
c
2016 Copyright held by the owner/author(s). Publication rights licensed to ACM. ISBN 978-1-4503-4556-9/16/11. . . $15.00
DOI:http://dx.doi.org/10.1145/2993148.2993191
1.
INTRODUCTION
First impressions are key in the context of organizations, such as during employment interviews, but also while working on jobs requiring strong communication skills such as sales, marketing, or hospitality. First impressions can be defined as the mental image one forms about something or someone after a first encounter. In professional spheres, these initial judgments can influence criti-cal outcomes, such as being hired or promoted. Psychology re-searchers have shown that people can make accurate inferences about others, even if the amount of information is very limited [3]. Nonverbal behavior has been established as a major channel through which information is communicated; it constitutes a strong basis on which first impressions are formed [20]. Organizational psychologists have studied job interviews for decades, aiming at understanding the relationships among personality, behavior (both verbal and nonverbal), interview ratings/outcomes, and job perfor-mance [11, 13, 30]. Until recently, these studies have been con-ducted based on manual annotations of behavior, which is labor-intensive and makes it difficult to scale.
In the last decade, the advent of inexpensive sensors combined with improved perceptual techniques have enabled the possibility to automatically analyze human face-to-face interactions [14, 28]. In the context of job interviews, recent studies have established the feasibility of automatically inferring interview ratings [24] and other related constructs (e.g. engagement, friendliness, or excite-ment) [23] up to a certain level. Other researchers [17] have ex-tended these works by developing a social coaching system to en-able potential job-seekers to train their behavior in order to convey a more positive first impression to recruiters. To this end, they provided feedback to college undergraduate students about their automatically sensed nonverbal behavior, including head gestures, smiles, and prosody. The subjects that obtained feedback via the coaching system showed improved performance during interviews. To our knowledge, little is known on how to implement a training procedure that can be used by individuals and organizations that can systematically benefit from it, such as schools and employment agencies.
The objective of this study is to design and implement a be-havioral training procedure for hospitality students in order to im-prove the first impressions they make on others, including potential clients and recruiters. To this end, we collaborated with an interna-tional hospitality management school, and designed a framework to offer their students the possibility to train their social skills in two
scenarios that are relevant for their future careers, namely job inter-views and reception desk situations. Experiments were conducted by embedding them in the hospitality school’s regular practice.
The contributions of this work are the following. First, we de-scribe the challenges associated with designing a training frame-work for students in an international hospitality school. Second, we collected a dataset of 169 simulated job interviews and reception desk interactions (338 interactions in total), which to our knowl-edge constitutes one of the largest academic datasets of work-related dyadic interactions. Third, we analyzed the relationship between automatically extracted nonverbal cues and various perceived so-cial variables in a correlation analysis and a prediction task, and ex-tended the results found in [24]. We found gender differences that confirmed previous findings in psychology [21]. Fourth, we ob-served that students overall improved their interview performance during the second laboratory session, suggesting that the feedback they obtained at least partly helped them improve the first impres-sions that raters formed about them. We see our work as a step towards the use of social sensing in a living lab for the benefit of students of an international hospitality management school.
2.
RELATED WORK
Researchers in organizational psychology have studied job in-terviews for decades, uncovering statistical relationships between nonverbal behavior, personality, hireability, and job performance. Regardless of the setting, the impact of nonverbal behavior on per-ceiver’s impressions and judgments has been established [31]. In the context of job interviews, the applicant’s nonverbal behavior was shown to influence the hiring decision of the recruiter. For example, Imada and Hankel showed that high amount of eye con-tact, smiling and other nonverbal behavior had a significant effect on the outcome of the interview [19]. Furthermore, successful ap-plicants were found to make more direct eye contact, produce more facial expressions, smile and nod more than applicants who were rejected [13]. McGovern and Tinsley reported that applicants with loud and modulating voice, extended eye contact, fluent speech, and expressive face were more likely to be hired than the applicants who did not show such behavior [22]. Along the same lines, pow-erless speech (i.e., speech punctuated with hesitation and lacking conviction) had a negative effect on the impression ratings com-pared to applicants with speech disorders like stuttering or lisping [12]. Until recently, research in social psychology relied on man-ual annotations of nonverbal behavior, which is labor-intensive and difficult to scale with respect to either large number of users or dif-ferent scenarios.
The advent of inexpensive and unobtrusive sensors combined with improved perceptual techniques have enabled the automatic analysis of human interactions. This domain is multidisciplinary and involves speech processing, computer vision, machine learn-ing, and ubiquitous computing. Early works investigated the use of automatically extracted nonverbal cues to predict social con-structs as diverse as dominance, leadership, or personality traits in small group interactions [15]. In a context similar to job inter-views, Curhan et al. [8] investigated the relationship between audio cues and social outcomes in dyadic job negotiations. Batrinca et al. [5] used a computational approach to predict Big-Five personal-ity traits in self-presentations where participants had to introduce themselves in front of a computer, in a manner similar to job in-terviews, but without the presence of an interviewer. Nguyen et al. [24] addressed the problem of automatically analyzing employ-ment interviews. This work used automatically extracted nonverbal cues (speaking turns, prosody, head nods, visual activity) to infer five types of hireability variables in a dataset of 62 real job
inter-views. Further research also examined the relationships between body activity, personality and hireability using a mixture of auto-matically and manually extracted features [26]. Naim et al. [23] ex-tended these works by analyzing a dataset of 138 simulated job in-terviews from 69 internship seeking students, where they extracted cues related to facial expressions, verbal content, and prosody to predict several social variables (e.g., hiring recommendation, en-gagement, friendliness) and perceived behaviors (e.g., smile, eye contact, speaking rate).
Existing literature in psychology indicates that people can im-prove their chances of getting hired in a job interview by practicing both their verbal and nonverbal communication [16]. The recent advances in wearable devices with smart interfaces have enabled a new range of possibilities for behavioral training [27]. In the context of public speaking, Google Glass has been used as a head-mounted display system to provide real-time feedback on a presen-ter’s posture, openness, body energy, and speech rate sensed using Kinect and external microphone data [9]. In addition to display-ing information, Google Glass was also used as an audio sensor to provide automatic real-time feedback on a speaker’s speaking rate and energy [33]; however, the data was processed on an external server. These systems have been evaluated on relatively small co-horts (N∈[15,30]) consisting of computer science students, and to this day several important questions remain unanswered, such as the implementation of such systems in realistic settings, or the social acceptability of Google Glass. In the context of job inter-views, MACH [17] was developed to train social skills and con-sists of a virtual agent able to read behavioral cues (facial expres-sions, speech, and prosody) produced by a participant. Addition-ally, the system provides summary feedback on various nonverbal cues (smiles, head nods, pauses, etc.), as well as what authors called focused feedback, which consists of visualization of certain behav-iors over time along the recorded video. The system was tested in a job interview scenario on a cohort of 60 students (plus 30 as control group). While results showed that the group who was given feed-back improved their overall interview performance, little is known on how to implement a training procedure that can be used by indi-viduals and organizations, such as schools or employment agencies to systematically benefit from it.
3.
DATA COLLECTION
3.1
Context and Challenges
One of the main objectives of this work was to design and im-plement a behavioral training framework for students in an interna-tional hospitality school offering bachelor and master degrees for English and French-speaking students. The envisioned framework involves students practicing some of their regular work tasks in re-alistic conditions. We faced many challenges associated with the real-world implementation of a behavioral training program. The hospitality management programs are immersive with students tak-ing classes and conducttak-ing practical work in a real hotel, where they rotate among the different services (kitchen, reception, bar, etc.). First, classes had weekly-rotating shifts of practical work and courses. For practical weeks, students did not know their sched-ules more than two days in advance. Classes did not start semesters at the same period of the year. These factors inherent to the school made the planning of the data collection complex, both at the semester and week levels, requiring a high level of flexibility from our side. Second, as in any bachelor or master level program, students were busy with their usual curricular activities (course assignments, projects, mid-terms, and finals) that took a significant amount of their time. Third, we also faced some challenges related to the relatively young
age of the students: some of them were not 100% reliable and did not show up at scheduled sessions, did not reply to emails/SMS, or dropped out during the course of the study. Additionally, although the benefits of participating in the training program was clear to the majority of students, some felt the investment in time was too high to participate.
To address these challenges, we built a living lab located in the same building as the hospitality management school. We had three evenings per week where the lab was open and students could reg-ister up to 24 hours in advance for a training session, with a max-imal capacity of 12 student-sessions per week. To avoid overload-ing the student’s schedule, we made efforts to make the trainoverload-ing program as time-efficient as possible; in total, the complete pro-cedure for each student took 4 hours distributed over 4 weeks on average. Additionally, we targeted students who were starting their semester, because it corresponded to the time where their school-related workload was the lowest.
Multiple modalities were used to advertise the program. Sub-scription sheets summarizing the study were placed at the student help-desk; 10-minute class presentations were given to each class within the first two weeks following the start of their semesters, where we listed the benefits for them to participate in the training program; e-mails by the academic directors of the school were sent to students; last, some professors advertised the study during their class. Furthermore, we incentivised the students to participate by offering the equivalent of USD 50 upon the completion of the pro-gram. Participation in the program was voluntary.
3.2
Overall Design
The behavioral training program was designed to be beneficial for the students. To this end, we identified two important situa-tions in the context of hospitality where behavior plays an impor-tant role: employment interviews and interactions with customers at a reception desk. The choice of job interview was motivated by its ubiquity in the process of selecting new personnel; further-more, we believed that a behavioral training on interviews could be beneficial for students in the relatively short-term to get hired for an internship (which students need to complete as part of their degree requirements) or to land their first job. The choice of the interaction with a client at a reception desk was motivated by the fact that it constitutes a standard type of interaction in hospitality; furthermore, beyond the reception desk, hospitality professionals have to be able to communicate with (possibly angry) customers, regardless of the setting. In addition to the two role-plays, an inter-active feedback session was included in the training process. This feedback session was held in groups of 3 to 8 students, in which they were given a presentation on first impressions and behavior, watched and discussed video snippets of their recorded interview and desk role-plays, and received written personalized feedback by professionals in human resources and hospitality. Specifically, the procedure included two laboratory sessions, with a feedback ses-sion held in-between. Each laboratory sesses-sion included two role-plays: one job interview and one front desk interaction. Figure 1 displays an overview of the behavioral training framework.
3.3
Lab Sessions
Each laboratory session consisted of a job interview and a re-ception desk role play. The scenarios of lab sessions 1 and 2 were identical to the exception of the reception desk scenario which was slightly modified.
Both the scenarios were recorded using two Kinect v2 devices, one for each protagonist in the interaction. These sensors record standard RGB color and depth data at 30 frames per second, with a
Figure 1: Illustration of the behavioral training procedure. Job interview questions:
1. Short self-presentation.
2. Motivation for working in the service industry. 3. Past experience requiring attention to details. 4. Past experience where stress was correctly managed. 5. Past experience where adaptability was required. 6. Past experience of calm and tact under stress. 7. Strong/weak points about self.
Figure 2: Interview structure.
spatial resolution of 1920×1080 for RGB and 512×424 for depth. Additionally, a Kinect v1 device was placed on top of the reception desk to provide a bird’s view of the interaction. For audio, we used a Microcone [1] device which is an array of microphones that au-tomatically performs speaker segmentation based on sound source localization, in addition to recording audio at 48kHz.
Cross-sensor synchronization was obtained by manually adjust-ing the delay between video data with respect to audio data.
3.3.1
Job Interview
The first role-play consists of a job interview, where the student is applying for an internship in a high-end hotel. We used a struc-tured design, i.e., each interview followed the same sequence of questions so that comparisons across subjects could be made. Psy-chology literature suggests that structured interviews are amongst the most valid tools for selecting applicants [18]. Figure 2 displays the list of questions asked in our study. Students were given the interview questions and five minutes to prepare for the interview, but were not allowed to use notes during the interaction. The inter-views were conducted by our research assistants, a pool of seven master’s students in psychology and business school. Figure 3 dis-plays a snapshot of the sensor setting used for the job interviews.
3.3.2
Reception Desk
The second role-play consisted of an interaction between a re-ceptionist (played by the hospitality student) and a client (played by one of our research assistants) at the reception desk of a high-end hotel. Before starting, we instructed the participant about the situation of the role-play: she or he is an intern that started a month ago, it is late and the manager is unavailable, therefore the partici-pant is alone to handle the situation; at one point the bill is handed to the client, and the bill cannot be changed. The scenario was designed in such a way that it starts with a normal phase, where the interaction between the two protagonists is friendly. Once the client gets the bill, the client attitude changes and starts complain-ing about some issues (e.g. city tax, pay TV, non-free WIFI). Here
Figure 3: The sensor set-up for job interview setting including the interviewer (3), the participant (4), Microcone (2) and two Kinect devices (1).
the goal of the student is to handle this uneasy situation in the best possible way. The role of the client was played by the same pool of research assistants as the ones who conducted the interviews.
We believe that the reception desk scenario is an interesting ad-dition to the job interviews, as it constitutes a situation where the students perform in a work-like environment. In other words, this scenario could provide an assessment of how well the students per-form in a job situation, which could enable us to study the relation-ship between job interviews and the performance at work. In this study we focused our analysis on the job interviews. The analysis of the desk interactions will be conducted in a separate future study.
3.4
Feedback Session
After the first lab session, students participated in a feedback session in groups of three to eight people. First, participants were given a 20-minute presentation on nonverbal behavior and its effect on the first impressions made on others. The presentation was pre-pared by a researcher in organizational psychology and was given by one of our research assistants.
Then, video snippets of the interactions recorded during the first lab session were watched and discussed by the group of students. Participants were instructed to give constructive comments about several strong points and aspects that could be improved. At least one research assistant was present to moderate the discussion, which was never necessary in practice.
Last, we gave each participant personalized written feedback, which was provided by professionals in human resources (for the job interviews) and hospitality (for the reception desk). The experts were instructed to give constructive feedback on how the students could improve their performance either at the desk or during the in-terview, based on the full audio-video recording of the interactions during the first lab session.
3.5
Participants
In total, we collected 169 job interviews and reception desk in-teractions, for a total of 338 interactions. In aggregate, the corpus comprises 3040 minutes of recordings, with 1690 minutes of inter-views (average interview duration≈10 minutes) and 1350 minutes for desk (average desk duration≈8 minutes). To our knowledge, this constitutes one of the largest academic dataset of dyadic inter-actions collected in an organizational context. 100 students partic-ipated in the first lab session, 69 participants completed both lab sessions. The 31 students who did not complete the full training
Table 1: Intra class correlation and descriptive statistics for perceived social variables in job interviews.
Social Variable ICC(2,k) mean std skew
Professional Skills Motivated (motiv) 0.52 5.89 0.60 -1.03 Competent (compe) 0.56 6.01 0.54 -1.00 Hardworking (hardw) 0.54 6.06 0.55 -1.07 Social Skills Sociable (socia) 0.57 5.67 0.65 -0.39 Enthusiastic (enthu) 0.68 5.52 0.87 -0.64 Positive (posit) 0.60 5.70 0.72 -0.46 Communication Skills Communicative (commu) 0.60 5.82 0.71 -0.79 Concise (consi) 0.55 5.84 0.65 -0.72 Persuasive (persu) 0.69 5.57 0.87 -0.76 Overall Impression OvImpress 0.73 5.58 0.94 -0.76
procedure either decided to leave the study before or after the feed-back session, or did not reply to emails or SMS. Out of the 100 students who participated in at least one lab session, there were 57 females, and the mean age was 20.6 years (SD=2.47). Addi-tionally, because the hospitality management school has programs in both French and English, the two languages are present in the corpus. Out of the 169 sessions, 130 were conducted in French.
3.6
Annotations
As the objective of this study was to implement a behavioral training procedure for hospitality student, we were interested in the effects of nonverbal behavior in the perception of various social variables such as first impressions, professional, communication, and social skills.
To observe the initial effect, we showed the first two minutes of the interview video to five raters, who were master’s student in psychology. The raters watched the first two minutes of the videos and rated a number of social variables on Likert scale from 1 to 7. The use of thin slices in a common practice in psychology [4] and social computing [29]. The comparison with predictive validity across slices is a research issue for future work.
The agreement between the raters was assessed using Intraclass Correlation Coefficient (ICC), a standard measure of inter-rater re-liability widely used in psychology and social computing [32]. As all the raters annotated each video and because we used a sam-ple rather than a population of raters, we used a two-way mixed, consistency, average-measuresICC(2,k). The agreement between raters for all the social variables was greater than 0.5 indicating moderate reliability. Table 1 summarizes the annotated social vari-ables and presents their respective descriptive statistics.
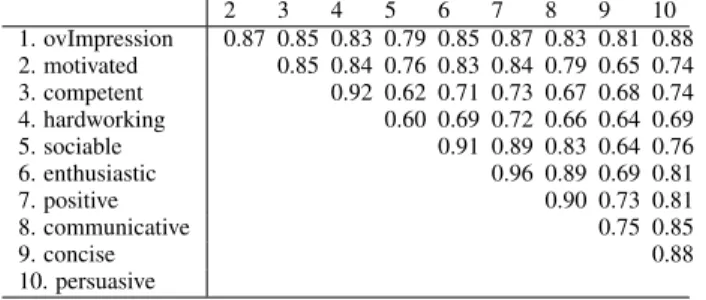
As a first step, we analyzed the pairwise correlations (using Pear-son’s correlation) between the social variables. These are presented in Table 2. All variables annotated were observed to be signifi-cantly correlated with each other with correlation coefficients above 0.6 for all cases. Correlations between some variables like com-petent and hardworking (r=0.91), sociable and enthusiastic (r=
0.91), enthusiastic and positive (r=0.96) were very high, indicat-ing that they are essentially the same.
4.
NONVERBAL FEATURES
Nonverbal cues were automatically extracted from the audio and visual modalities for both the applicant and interviewer towards the aim of obtaining behavioral representation of their interaction dur-ing job interviews. The choice of nonverbal cues extracted was based on their relevance in existing literature in the field of social
Table 2: Correlation matrix for perceived social variables in job interviews (N=169) . In all cases, correlation is significant (p<0.01). 2 3 4 5 6 7 8 9 10 1. ovImpression 0.87 0.85 0.83 0.79 0.85 0.87 0.83 0.81 0.88 2. motivated 0.85 0.84 0.76 0.83 0.84 0.79 0.65 0.74 3. competent 0.92 0.62 0.71 0.73 0.67 0.68 0.74 4. hardworking 0.60 0.69 0.72 0.66 0.64 0.69 5. sociable 0.91 0.89 0.83 0.64 0.76 6. enthusiastic 0.96 0.89 0.69 0.81 7. positive 0.90 0.73 0.81 8. communicative 0.75 0.85 9. concise 0.88 10. persuasive
psychology [10, 19] and social computing [24, 25] and were ex-tracted for the full interview. Analysis of other behavioral cues (e.g. gaze, facial expressions, verbal content) could also be extracted to get a comprehensive representation of the interaction and will be undertaken in future work.
4.1
Audio Features
Speaking Activity: cues such as pauses and speaking time are known to impact hireability impression ratings [23]. We extracted the following activity cues based on the speaker segmentation pro-vided by the Microcone and utilized various statistics like count, mean, standard deviation, and maximum as features.
• Speaking timewas obtained by summing all the individual speaking segments and normalized by interview duration.
• Speaking turn was defined as number of speech segments greater than two seconds.
• Pauseswere defines as gaps in speech of less than two sec-onds in duration.
• Short utterancesare speaking segments of duration less than two seconds.
Prosody Features: relate to the tonal variations of speech. This includes pitch (voice fundamental frequency), speaking rate (speed at which words are spoken), spectral entropy (measure of irregular-ity or complexirregular-ity), energy (voice loudness), and time derivative of energy (voice loudness modulation). Speech feature were extracted using the code made available by MIT Media Lab [2]. We extracted the following statistics: mean, standard deviation, minimum, max-imum, entropy, median, and quartiles.
4.2
Visual Features
Head Nodsare vertical up-and down movements of the head, rhythmically raised and lowered. We used a 3D face centered method [7] in which a 3D head tracker calculates angular velocities using relative rotation at each instant with respect to the head pose at some instance before. Number of nods, mean, median, standard deviation, minimum, and maximum of duration were computed. Overall Visual MotionWe utilize a modified version of motion energy images, called Weighted Motion Energy Images (WMEI) [6] to capture the total amount of visual movement displayed by the applicant and interviewer during the job interview. We then compute various statistics: mean, median, standard deviation, min-imum, maxmin-imum, entropy, quartiles, center of gravity, and utilize them as features.
4.3
Multimodal Features
Nodding while speakingwas defined as events when a protag-onist was nodding while he was speaking. Count of nodding while speaking, mean, median, standard deviation, minimum, and maxi-mum of duration were computed.
5.
EXPERIMENTS AND RESULTS
We divide our experiments into two sections, Section 5.1 de-scribes correlation analysis of nonverbal behavior and social vari-ables. In Section 5.2, we evaluate a computational framework for the automatic inference of first impressions from employment in-terviews. In Section 5.3, we present results comparing ratings and behavior between the first and second interviews.
5.1
Correlation Analysis
The results of correlation analysis for the social variables are pre-sented in Table 3. Due to space constraints, only a few nonverbal cues are presented here. The complete correlation matrix can be found in the supplementary material.
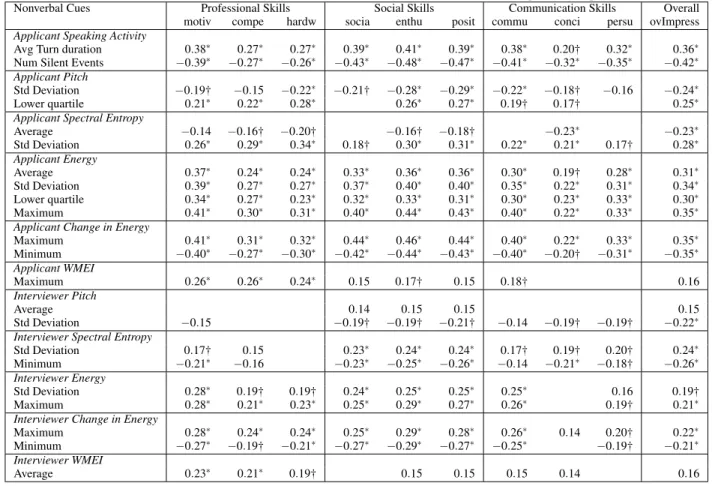
Applicant cues: A number of applicant features were found to be significantly correlated to impressions of all social variables of interest. Specifically, participants who spoke often, longer, louder, with greater modulation of loudness and pitch obtained higher score in overall impression, professional, social and communicative skills. This results are in accordance with existing literature [10, 12, 24].
Similarly, applicants who spoke animatedly with more gestures and motion were more favorably viewed than participants who spoke with less gestures. This corroborates the results in [24], which showed that applicants displaying more visual head motion (WMEI) received better hireability scores.
Interviewer cues:Interviewer’s pitch (std), spectral entropy (min, lower quartile) and time derivative of energy (minimum) were ob-served to be negatively associated with all social variables suggest-ing that the interviewer had a more monotonous tone of voice in presence of job applicants who were rated higher. These results is in line with those reported in [10, 24].
Interviewer’s overall visual motion (mean) was positively asso-ciated with overall impression and all social variables of interest. This suggests that interviewers gestured more in the presence of an applicant who scored higher than applicants with lower scores, thus again validating the findings in [24].
5.2
Inference of First Impressions
We formulate the prediction of social variables from extracted behavioral cues as a regression task. In the first step, we pre-processed the annotated data using log transformation due to skew-ness of data (skewskew-ness >1). Behavioral features too were nor-malized using the z-score, such that they had zero mean and unity variance.
Dimensionality reduction techniques like Principle Component Analysis (PCA) and lowpvalue (pVal) were then evaluated. The pVal method assumes that relevant information is contained in the features significantly correlated with the social variables. Thus, we selected features with p<0.05. As the performance of pVal techniques was better then PCA, we report only the results of pVal technique. To test the impact of the dimensionality reduction step, we also tested the case of taking all features as predictors for the regression step. Several regression techniques (Ridge, random for-est (RF), ordinary least squares (OLS)) were evaluated. For these tasks, we used leave-one-interview-out cross validation and 10-fold inner cross validation. As we used the leave-one-interview-out cross validation, it is possible that one participant can be in both the training and test sets although in different interviews.
For evaluation measure, we utilized the coefficient of determina-tionR2, which accounts for the amount of total variance explained by the model under analysis. This metric is often used in both psy-chology and social computing to evaluate regression tasks.
The results of the regression task are summarized in Table 4. Results from utilizing all the data indicate that all social variables
Table 3: Selected Pearson’s correlation coefficient for various social variables.∗p<0.01,†p<0.05
Nonverbal Cues Professional Skills Social Skills Communication Skills Overall motiv compe hardw socia enthu posit commu conci persu ovImpress
Applicant Speaking Activity
Avg Turn duration 0.38∗ 0.27∗ 0.27∗ 0.39∗ 0.41∗ 0.39∗ 0.38∗ 0.20† 0.32∗ 0.36∗ Num Silent Events −0.39∗ −0.27∗ −0.26∗ −0.43∗ −0.48∗ −0.47∗ −0.41∗ −0.32∗ −0.35∗ −0.42∗
Applicant Pitch
Std Deviation −0.19† −0.15 −0.22∗ −0.21† −0.28∗ −0.29∗ −0.22∗ −0.18† −0.16 −0.24∗ Lower quartile 0.21∗ 0.22∗ 0.28∗ 0.26∗ 0.27∗ 0.19† 0.17† 0.25∗
Applicant Spectral Entropy
Average −0.14 −0.16† −0.20† −0.16† −0.18† −0.23∗ −0.23∗ Std Deviation 0.26∗ 0.29∗ 0.34∗ 0.18† 0.30∗ 0.31∗ 0.22∗ 0.21∗ 0.17† 0.28∗ Applicant Energy Average 0.37∗ 0.24∗ 0.24∗ 0.33∗ 0.36∗ 0.36∗ 0.30∗ 0.19† 0.28∗ 0.31∗ Std Deviation 0.39∗ 0.27∗ 0.27∗ 0.37∗ 0.40∗ 0.40∗ 0.35∗ 0.22∗ 0.31∗ 0.34∗ Lower quartile 0.34∗ 0.27∗ 0.23∗ 0.32∗ 0.33∗ 0.31∗ 0.30∗ 0.23∗ 0.33∗ 0.30∗ Maximum 0.41∗ 0.30∗ 0.31∗ 0.40∗ 0.44∗ 0.43∗ 0.40∗ 0.22∗ 0.33∗ 0.35∗
Applicant Change in Energy
Maximum 0.41∗ 0.31∗ 0.32∗ 0.44∗ 0.46∗ 0.44∗ 0.40∗ 0.22∗ 0.33∗ 0.35∗ Minimum −0.40∗ −0.27∗ −0.30∗ −0.42∗ −0.44∗ −0.43∗ −0.40∗ −0.20† −0.31∗ −0.35∗ Applicant WMEI Maximum 0.26∗ 0.26∗ 0.24∗ 0.15 0.17† 0.15 0.18† 0.16 Interviewer Pitch Average 0.14 0.15 0.15 0.15 Std Deviation −0.15 −0.19† −0.19† −0.21† −0.14 −0.19† −0.19† −0.22∗
Interviewer Spectral Entropy
Std Deviation 0.17† 0.15 0.23∗ 0.24∗ 0.24∗ 0.17† 0.19† 0.20† 0.24∗ Minimum −0.21∗ −0.16 −0.23∗ −0.25∗ −0.26∗ −0.14 −0.21∗ −0.18† −0.26∗
Interviewer Energy
Std Deviation 0.28∗ 0.19† 0.19† 0.24∗ 0.25∗ 0.25∗ 0.25∗ 0.16 0.19† Maximum 0.28∗ 0.21∗ 0.23∗ 0.25∗ 0.29∗ 0.27∗ 0.26∗ 0.19† 0.21∗
Interviewer Change in Energy
Maximum 0.28∗ 0.24∗ 0.24∗ 0.25∗ 0.29∗ 0.28∗ 0.26∗ 0.14 0.20† 0.22∗ Minimum −0.27∗ −0.19† −0.21∗ −0.27∗ −0.29∗ −0.27∗ −0.25∗ −0.19† −0.21∗ Interviewer WMEI
Average 0.23∗ 0.21∗ 0.19† 0.15 0.15 0.15 0.14 0.16 annotated were predictable to some degree from nonverbal
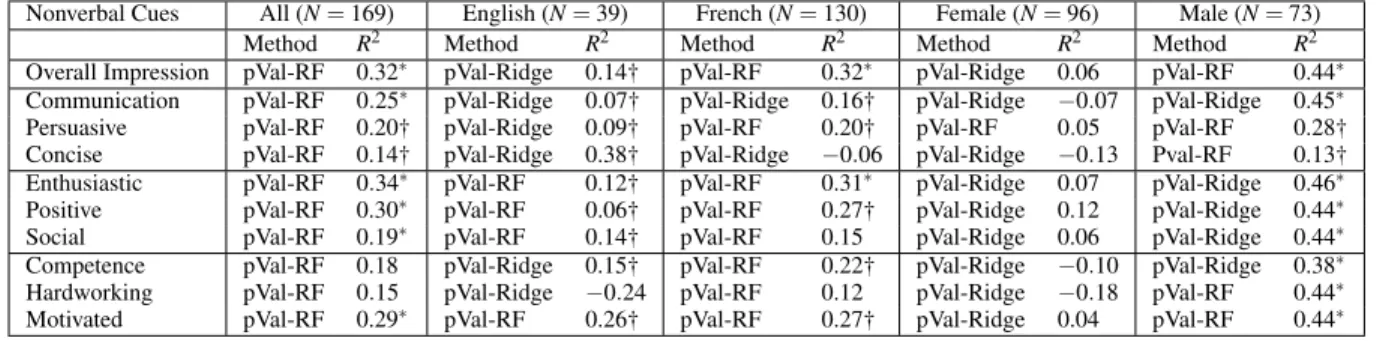
behav-ior. Random forest with pVal dimensionality reduction (pVal-RF) was found to perform best with this set of features. Overall im-pression and enthusiastic had the highestR2, 0.34 and 0.32 respec-tively. This implies nonverbal behavior is predictive of overall first impression as shown in existing literature [20] and corroborates the results found in [24]. We observe certain variables like hardwork-ing (R2=0.15) and competence (R2=0.18) to be harder to predict. Comparing to recent work, in [24], the authors reportedR2 of 0.36 for hireability, a measure we have not used. They also reported
R2of 0.10 for persuasive and no predictability for communicative. In another work, [23] reported results on a different set of social variables using correlation coefficientras their evaluation metric. We compare our results to this work by convertingr to R2 (our evaluation metric, coefficient of determinationR2 is obtained by computing the square of correlation coefficientr). They reported a prediction accuracy ofr=0.70 for overall performance, which indicates aR2 of 0.49. We compare results of socials constructs which are similar in meaning to the ones we have utilized: excited (R2=0.65) vs enthusiastic (R2=0.34), friendly (R2=0.63) vs social (R2=0.19), focused (R2=0.31) vs motivated (R2=0.29). There is no direct way of assessing where the performance differ-ence come from, as the data set used Naim et al. is not publicly available to our knowledge.
We observe that language has an effect on the predictive power of impressions scores. A larger variance for overall impression (R2=0.32) could be explained for participants using French as the language of interview, while for participants using English only 14% of variance could be explained. We hypothesize that this could
be due to the fact that raters were not native English speakers. The same hypothesis could explain why concise had higherR2for En-glish than French. However, the small size of the EnEn-glish dataset prevents drawing firm conclusions on the effect of language and will be investigated.
Although no significant difference could be observed between males and females in terms of the values of annotations, we observe that the interviews including a male participant were predicted with higher accuracy (R2∈[0.13,0.46]) than the ones featuring females (R2≤0.12). In order to understand these differences, we analyzed the correlations between nonverbal cues and the annotated variables for data subsets separated based on gender. Table 5 displays a sum-mary of the largest differences in correlation values for the variable of overall impression; due to space constraints, we did not include the correlations for other variables, but similar trends were found. We observe that the improvement in prediction accuracy can be explained by the overall higher correlations observed for male in-terviews. Furthermore, striking gender differences can be observed in terms of correlation values, such as speaking time, statistics of turn duration, speech energy, and silence; these behaviors are part of what psychologists refer to as powerful speech. On the one hand, if men use these cues they are perceived as powerful, which is in line with gender stereotypes for men, as well as with persuasiveness [21]. On the other hand, stereotpyically women are less expected to show powerful speech, which might explain the lower correlations found for women.
5.3
Changes Across Sessions
To determine if there was a difference in annotated ratings across sessions, we selected only those participants who had completed
Table 4: Regression results for each language and gender using regression methods; pVal with random forest (pVal-RF) and pVal with Ridge (pVal-Ridge)∗p<0.01,†p<0.05.
Nonverbal Cues All (N=169) English (N=39) French (N=130) Female (N=96) Male (N=73) Method R2 Method R2 Method R2 Method R2 Method R2 Overall Impression pVal-RF 0.32∗ pVal-Ridge 0.14† pVal-RF 0.32∗ pVal-Ridge 0.06 pVal-RF 0.44∗ Communication pVal-RF 0.25∗ pVal-Ridge 0.07† pVal-Ridge 0.16† pVal-Ridge −0.07 pVal-Ridge 0.45∗ Persuasive pVal-RF 0.20† pVal-Ridge 0.09† pVal-RF 0.20† pVal-RF 0.05 pVal-RF 0.28† Concise pVal-RF 0.14† pVal-Ridge 0.38† pVal-Ridge −0.06 pVal-Ridge −0.13 Pval-RF 0.13† Enthusiastic pVal-RF 0.34∗ pVal-RF 0.12† pVal-RF 0.31∗ pVal-Ridge 0.07 pVal-Ridge 0.46∗
Positive pVal-RF 0.30∗ pVal-RF 0.06† pVal-RF 0.27† pVal-Ridge 0.12 pVal-Ridge 0.44∗ Social pVal-RF 0.19∗ pVal-RF 0.14† pVal-RF 0.15 pVal-Ridge 0.06 pVal-Ridge 0.44∗ Competence pVal-RF 0.18 pVal-Ridge 0.15† pVal-RF 0.22† pVal-Ridge −0.10 pVal-Ridge 0.38∗ Hardworking pVal-RF 0.15 pVal-Ridge −0.24 pVal-RF 0.12 pVal-Ridge −0.18 pVal-RF 0.44∗ Motivated pVal-RF 0.29∗ pVal-RF 0.26† pVal-RF 0.27† pVal-Ridge 0.04 pVal-RF 0.44∗
Table 5: Correlation coefficients between selected nonverbal cues and overall impression for sub-sets separated based on gender.∗p<0.01;†p<0.05
Overall impression NVB cues Female (N=96) Male (N=73) App. # of turns −0.36∗ −0.42∗
App. speaking time - 0.23† App. speaking ratio - 0.35∗ App. turn duration stats 0.25† [0.37,0.48]∗ App. speech energy stats [0.17,0.26]† [0.42,0.50]∗ Silence stats −0.23∗ [−0.47,−0.67]∗
Figure 4: Difference in Overall Impression score between two lab sessions for all participants.
both lab session 1 and 2 (N=69) from the full dataset. We then conducted a paired t-test on this split dataset, which rejected the null hypothesis for overall impression (p < 0.05). Improvement of scores for other social variables were also significant (p < 0.05).
Similarly, we conducted a similar experiment to determine if there was a difference in nonverbal behavior across sessions. We observed that there was a significant (p<0.01) change in applicant maximum turn duration and speaking time. Correlation between the change in overall impression scores and change in speaking ac-tivity was statistically significant. Table 6 summarizes the descrip-tive statistics of social variables and nonverbal behaviors which changed significantly between lab session 1 and 2. The difference in overall impression between the two lab sessions for each partic-ipant can be visualized in Figure 4. We observe that while the ma-jority of the participants had an improvement in their ratings, 34% of participants had a decrease in scores between in the lab session 2 and lab session 1. There was no changes in scores for 4 partic-ipants. Although we observe that students overall improved their interview performance at the second laboratory session, no con-clusion can be drawn about the factors that were favorable to the student’s behavioral improvement. For instance, the source of the
Table 6: Descriptive stats of social variables and nonverbal cues. Mean values for speaking cues are after z-score normal-ization.
Mean Value
Nonverbal cues Session 1 Session 2 Delta pValue Overall Impression 5.2 5.5 0.3 0.03 Communicative 5.5 5.7 0.2 0.03 Sociable 5.2 5.4 0.2 0.02 Persuasive 5.2 5.5 0.3 0.01 Applicant Speaking Time 0.60 0.66 0.6 0.008 Applicant Turn duration 0.11 0.13 0.02 0.005
improvement in interview performance could be due to the feed-back they were given, but also to the fact that they participated to the role-play a second time, in which their level of confidence was higher. In future work, we plan to understand the factors that en-courage behavioral improvement: What is the best way to display feedback? What behaviors should feedback focus on? Who are the students that benefit from feedback, e.g. in terms of personal-ity, gender, age? We believe that this work constitutes a first step towards addressing these research questions.
6.
DISCUSSION AND CONCLUSION
In this work, we described a number of challenges associated with implementing a behavioral training procedure for hospitality students in order to improve the first impressions that others form about them. The framework consisted of two scenarios that were relevant for their future careers, namely job interviews and recep-tion desk situarecep-tions. We collected a new corpus of 169 simulated job interviews and reception desk interactions (338 interactions). This dataset was recorded with multiple modalities.
Nonverbal cues were automatically extracted and their relation-ship with various perceived social variables analyzed. Our results are comparable with those reported in [24] and [23].
One of the insights from our analysis is that language has an ef-fect on the predictive power of impressions scores. Using data from only French language interviews showed higher prediction accu-racy (R2=0.32) than interviews which were conducted in only En-glish (R2=0.14) for overall impression, while accuracy for other social variables (except “concise”) was comparable. Understand-ing these issues in more depth requires future work.
Another insight was the role of gender in prediction accuracy. In-terviews with male participant were predicted with higher accuracy (R2∈[0.13,0.46]) than the ones featuring females (R2≤0.12). As the difference inN is relatively small (57% female to 43% male) and both data subsets have comparable size (or larger) compared to other existing datasets, we believe this is an interesting result. This result is supported by findings in psychology [21] and is in line with gender stereotypes for men, and with persuasiveness.
The presented work is a first step towards the implementation of a living lab in a hospitality management school. The use of the part of the corpus not analyzed here will allow us to analyze a second common situation in hospitality and to provide improved feedback to the student population.
7.
ACKNOWLEDGMENTS
This work was funded by the UBIMPRESSED project of the Sinergia interdisciplinary program of the Swiss National Science Foundation (SNSF). We thank the students of Vatel Switzerland for their participation, and Vatel’s academic deans (Susanne Welle, Alexandra Broillet, Daniel Fuchs, and Marc Forestier) for their sup-port. We also thank Tanzeem Choudhury (Cornell University) for discussions, and Dayra Sanchez, Ailbhe Finnerty, and the research assistants for their help with data collection.
8.
REFERENCES
[1] http://www.dev-audio.com/products/microcone/. [2] http://groupmedia.media.mit.edu/data.php.
[3] N. Ambady, M. Hallahan, and R. Rosenthal. On judging and being judged accurately in zero-acquaintance situations.J. Personality and Social Psychology, 69(3), 1995.
[4] N. Ambady and R. Rosenthal. Thin slices of expressive behavior as predictors of interpersonal consequences: A meta-analysis.Psychological bulletin, 111(2), 1992. [5] L. M. Batrinca, N. Mana, B. Lepri, F. Pianesi, and N. Sebe.
Please, tell me about yourself: automatic personality assessment using short self-presentations. InProc. ACM ICMI, 2011.
[6] J.-I. Biel and D. Gatica-Perez. The youtube lens: Crowdsourced personality impressions and audiovisual analysis of vlogs.IEEE Trans. on Multimedia, 15(1), 2013. [7] Y. Chen, Y. Yu, and J.-M. Odobez. Head nod detection from
a full 3d model. InProc. IEEE ICCV Workshops, 2015. [8] J. R. Curhan and A. Pentland. Thin slices of negotiation:
predicting outcomes from conversational dynamics within the first 5 minutes.J. Applied Psychology, 92(3), 2007. [9] I. Damian, C. S. S. Tan, T. Baur, J. Schöning, K. Luyten, and
E. André. Augmenting social interactions: Realtime behavioural feedback using social signal processing techniques. InProc. ACM CHI, 2015.
[10] T. DeGroot and J. Gooty. Can nonverbal cues be used to make meaningful personality attributions in employment interviews?J. Business and Psychology, 24(2), 2009. [11] T. DeGroot and S. J. Motowildo. Why visual and vocal
interview cues can affect interviewers’ judgments and predict job performance.J. Applied Psychology, 84(6), 1999. [12] C. M. End and K. Saunders. Short communication:
Powerless and jobless? comparing the effects of powerless speech and speech disorders on an applicant’s employability.
Frontiers, 2(1), 2013.
[13] R. J. Forbes and P. R. Jackson. Non-verbal behaviour and the outcome of selection interviews.J. Occupational
Psychology, 53(1), 1980.
[14] D. Gatica-Perez. Automatic nonverbal analysis of social interaction in small groups: A review.Image and Vision Computing, 27(12), 2009.
[15] D. Gatica-Perez. Signal processing in the workplace.IEEE Signal Process. Mag., 32(1), 2015.
[16] J. G. Hollandsworth, R. Kazelskis, J. Stevens, and M. E. Dressel. Relative contributions of verbal, articulative, and nonverbal communication to employment decisions in the job interview setting.J. Personnel Psychology, 32(2), 1979. [17] M. E. Hoque, M. Courgeon, J.-C. Martin, B. Mutlu, and
R. W. Picard. Mach: My automated conversation coach. In
Proc. ACM UBICOMP, 2013.
[18] A. I. Huffcutt, J. M. Conway, P. L. Roth, and N. J. Stone. Identification and meta-analytic assessment of psychological constructs measured in employment interviews.J. Applied Psychology, 86(5), 2001.
[19] A. S. Imada and M. D. Hakel. Influence of nonverbal communication and rater proximity on impressions and decisions in simulated employment interviews.J. Applied Psychology, 62(3), 1977.
[20] M. Knapp, J. Hall, and T. Horgan.Nonverbal communication in human interaction. Cengage Learning, 2013.
[21] C. Leaper and R. D. Robnett. Women Are More Likely Than Men to Use Tentative Language, Aren’t They? A
Meta-Analysis Testing for Gender Differences and Moderators.Psychology of Women Quarterly, 35(1), 2011. [22] T. V. McGovern and H. E. Tinsley. Interviewer evaluations of
interviewee nonverbal behavior.J. Vocational Behavior, 13(2), 1978.
[23] I. Naim, M. I. Tanveer, D. Gildea, and M. E. Hoque. Automated prediction and analysis of job interview performance: The role of what you say and how you say it.
Proc. IEEE FG, 2015.
[24] L. S. Nguyen, D. Frauendorfer, M. S. Mast, and D. Gatica-Perez. Hire me: Computational inference of hirability in employment interviews based on nonverbal behavior.IEEE Trans. on Multimedia, 16(4), 2014. [25] L. S. Nguyen and D. Gatica-Perez. I would hire you in a
minute: Thin slices of nonverbal behavior in job interviews. InProc. ACM ICMI, 2015.
[26] L. S. Nguyen, A. Marcos-Ramiro, M. Marrón Romera, and D. Gatica-Perez. Multimodal analysis of body
communication cues in employment interviews. InProc. ACM ICMI, 2013.
[27] E. Ofek, S. T. Iqbal, and K. Strauss. Reducing disruption from subtle information delivery during a conversation: mode and bandwidth investigation. InProc. ACM CHI, 2013. [28] A. Pentland and T. Heibeck.Honest signals: how they shape
our world. MIT press, 2010.
[29] F. Pianesi, N. Mana, A. Cappelletti, B. Lepri, and
M. Zancanaro. Multimodal recognition of personality traits in social interactions. InProc. ACM ICMI, 2008.
[30] S. Rothmann and E. P. Coetzer. The big five personality dimensions and job performance.J. Industrial Psychology, 29(1), 2003.
[31] B. R. Schlenker.Impression management: The self-concept, social identity, and interpersonal relations. Brooks/Cole Publishing Company Monterey, CA, 1980.
[32] P. E. Shrout and J. L. Fleiss. Intraclass correlations: uses in assessing rater reliability.Psychological bulletin, 86(2), 1979.
[33] M. I. Tanveer, E. Lin, and M. E. Hoque. Rhema: A real-time in-situ intelligent interface to help people with public speaking. InProc. of Int Conf. on Intelligent User Interfaces. ACM, 2015.