Automatic Bug Triaging Techniques Using
Machine Learning and Stack Traces
Korosh Koochekian Sabor
A Thesis
In The Department
of
Electrical and Computer Engineering
Presented in Partial Fulfillment of the Requirements
For the Degree of
Doctor of Philosophy (Electrical and Computer Engineering) at
Concordia university
Montreal, Quebec, Canada
July 2019
CONCORDIA UNIVERSITY SCHOOL OF GRADUATE STUDIES
This is to certify that the thesis prepared
By: Korosh Koochekian Sabor
Entitled: Automatic bug triaging techniques using machine learning and stack traces
and submitted in partial fulfillment of the requirements for the degree of
Doctor of Philosophy (Electrical and Computer Engineering)
complies with the regulations of the University and meets the accepted standards with respect to originality and quality.
Signed by the final examining committee:
Chair Dr. Luis Amador External Examiner Dr. Ali Ouni External to Program Dr. Nikos Tsantalis Examiner Dr. Anjali Agarwal Examiner Dr. Nawwaf Kharma Thesis Supervisor Dr. Abdelwahab Hamou-Lhadj Approved by
Dr. Rastko R. Selmic, Graduate Program Director September 27, 2019
Dr. Amir Asif, Dean
iii
AbstractAutomatic Bug Triaging Techniques Using Machine Learning and Stack Traces
Korosh Koochekian Sabor, Ph.D. Concordia University, 2019
When a software system crashes, users have the option to report the crash using automated bug tracking systems. These tools capture software crash and failure data (e.g., stack traces, memory dumps, etc.) from end-users. These data are sent in the form of bug (crash) reports to the software development teams to uncover the causes of the crash and provide adequate fixes. The reports are first assessed (usually in a semi-automatic way) by a group of software analysts, known as triagers. Triagers assign priority to the bugs and redirect them to the software development teams in order to provide fixes.
The triaging process, however, is usually very challenging. The problem is that many of these reports are caused by similar faults. Studies have shown that one way to improve the bug triaging process is to detect automatically duplicate (or similar) reports. This way, triagers would not need to spend time on reports caused by faults that have already been handled. Another issue is related to the prioritization of bug reports. Triagers often rely on the information provided by the customers (the report submitters) to prioritize bug reports. However, this task can be quite tedious and requires tool support. Next, triagers route the bug report to the responsible development team based on the subsystem, which caused the crash. Since having knowledge of all the subsystems of an ever-evolving industrial system is impractical, having a tool to automatically identify defective subsystems can significantly reduce the manual bug triaging effort.
iv
The main goal of this research is to investigate techniques and tools to help triagers process bug reports. We start by studying the effect of the presence of stack traces in analyzing bug reports. Next, we present a framework to help triagers in each step of the bug triaging process. We propose a new and scalable method to automatically detect duplicate bug reports using stack traces and bug report categorical features. We then propose a novel approach for predicting bug severity using stack traces and categorical features, and finally, we discuss a new method for predicting faulty product and component fields of bug reports.
We evaluate the effectiveness of our techniques using bug reports from two large open-source systems. Our results show that stack traces and machine learning methods can be used to automate the bug triaging process, and hence increase the productivity of bug triagers, while reducing costs and efforts associated with manual triaging of bug reports.
v
Acknowledgments
First and foremost, I want to express my profound and sincere gratitude to my respectful supervisor, Dr. Abdelwahab Hamou-Lhadj. Thanks for your trust in me, and thank you for proactively providing me all the academic, mental, and financial support I needed throughout the program. I would like to express my heartfelt gratitude for your mentorship, which helped me grow both professionally, personally and helped me to further develop my future career path.
My deep gratitude for all the support I received from my PhD committee, Dr. Nikolaos Tsantalis, Dr. Nawwaf Kharma, Dr. Ali Ouni and Dr. Anjali Agarwal. Their suggestions significantly helped me in further improving the direction of my research.
I would like to extend my thanks to Alf Larsson from Ericsson, Sweden, whose feedback and comments throughout this work have been very valuable. I would also like to thank Ericsson, MITACS, NSERC, and the Gina School of Engineering and Computer Science at Concordia University for their financial support.
Many thanks to all my friends at Concordia University. I was thrilled to have been surrounded by such wonderful people. Special thanks to Mohammad Reza Rejali and Amir Bahador Gahroosi for being such wonderful friends, I would be indebted for what you did for me during our collaboration and friendship in Concordia. Thanks to all my friends outside of Concordia, including Mojataba Khomami Abadi and Parham Darbandi, for all their friendship and support.
Words cannot express my gratitude and gratefulness enough to my beloved family members. My deepest appreciation for my Parents Anoushe and Saeedeh, for inspiring me to start the program and giving me heartwarming all the way through my program, my beloved sister, Camelia, who always supported my decisions from thousands miles away, and very special thanks to my wife, Camelia, I am very blessed to have you in my life, thanks for your extraordinary patience, care, kindness, love and all the sacrifices you made throughout the program. I could not have accomplished this work without your unconditional support.
vi
Table of Contents
List of Figures
... ix
List of Tables
... xi
1 Introduction ... 1
1.1.
Terminology
... 4
1.2.
Research Hypothesis
... 4
1.3.
Thesis Contributions
... 5
1.3.1.
Chapter 2: Background and Related Work
... 6
1.3.2.
Chapter 3: Data Preparation
... 6
1.3.3.
Chapter 4: An Empirical Study on the Effectiveness of Stack traces
... 7
1.3.4.
Chapter 5: Detecting Duplicate Bug Reports
... 7
1.3.5.
Chapter 6: Predicting Severity of Bugs
... 7
1.3.6.
Chapter 7: Predicting Faulty Product and Component Fields of Bug Reports
. 7
1.3.7.
Chapter 8: Conclusion and future work
... 7
2 Background and Related Work ... 8
2.1.
Background
... 8
2.1.1.
Bug Report Description
... 8
2.1.2.
Stack Trace
... 8
2.1.3.
Categorical Information
... 9
2.2.
Related Work
... 10
2.2.1.
Usefulness of Stack Traces
... 10
2.2.2.
Detection of Duplicate Bug Reports
... 11
2.2.3.
Predicting Bug Severity
... 18
2.2.4.
Bug Report Faulty Product and Component Field Prediction
... 24
3 Data Preparation ... 28
3.1.
Eclipse Dataset
... 28
3.2.
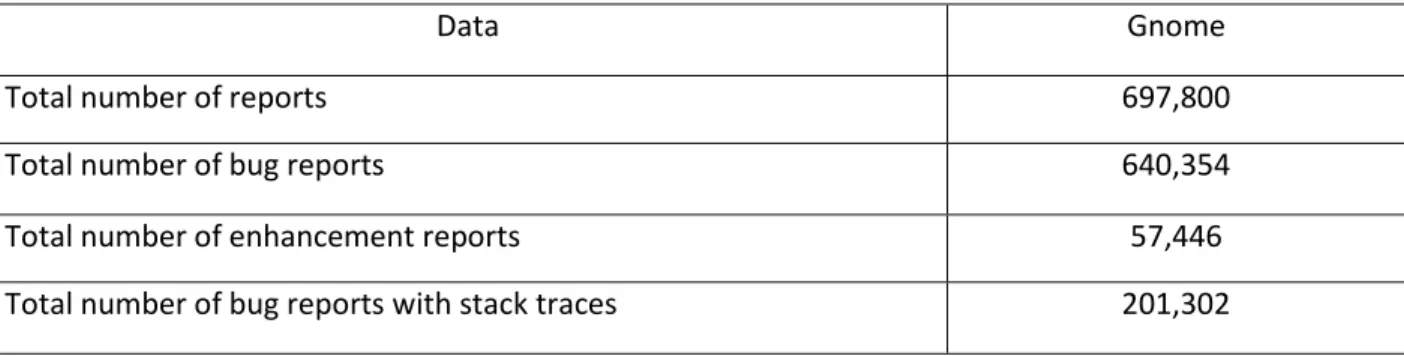
Gnome Dataset
... 29
4 Empirical Study on the Effectiveness of Presence of Stack Traces ... 31
4.1.
Dataset Setup
... 31
4.2.
Statistical Analysis
... 32
4.3.
Experiments
... 32
4.4.
Study Result
... 36
4.5.
Discussion
... 43
5 Detecting Duplicate Bug Reports ... 44
5.1.
Preliminaries
... 45
5.2.
Proposed Approach
... 48
5.3.
Evaluation
... 51
vii
5.3.2.
Dataset Analysis
... 53
5.3.3.
Evaluation Measure
... 55
5.4.
Results and Discussion
... 56
5.4.1.
Comparison of DURFEX to the of Function Calls
... 56
5.4.2.
Comparison of DURFEX to the of Function Calls with a Time Window
... 58
5.4.3.
Comparison of Processing Time Using Functions and Packages
... 60
5.5.
Threats to Validity
... 62
5.6.
Conclusion
... 62
6
Bug Severity Prediction ... 63
6.1.
Bug Report Features
... 64
6.2.
Levels of Bug Severity
... 65
6.3.
The Proposed Approach
... 67
6.3.1.
Predicting the Bug Severity Using Stack Traces and Categorical Features
.... 67
6.3.2.
Predicting Severity Using Stack Traces
... 69
6.3.3.
Bug Features Extraction (Stack Traces and Categorical Features)
... 69
6.3.4.
Stack Trace Similarity
... 70
6.3.5.
KNN Classifier for Severity Classification
... 70
6.3.6.
Overall Approach
... 72
6.4.
Evaluation
... 75
6.4.1.
Experimental Setup
... 76
6.4.2.
Cost-sensitive K Nearest Neighbour
... 79
6.4.3.
Predicting Severity of Bugs Using Description
... 83
6.4.4.
Predicting Severity of Bugs Using a Random Classifier
... 84
6.4.5.
Severity Prediction Approaches Setup
... 85
6.4.6.
Evaluation Metrics
... 85
6.4.7.
Evaluation Results
... 86
6.5.
Threats to Validity
... 104
6.5.1.
Threats to External Validity
... 104
6.5.2.
Threats to Internal Validity
... 107
6.6.
Conclusion
... 107
7
Automatic Prediction of Bug Report Faulty product and component fields ... 109
7.1.
Bug Report Features
... 111
7.2.
The Proposed Approach
... 111
7.2.1.
Predicting Bug Report Faulty Product and Component Fields
... 111
7.2.2.
Bug Features Extraction
... 113
7.2.3.
KNN Classifier for Faulty Component and Product Classification
... 114
7.2.4.
Overall Approach
... 116
7.3.
Evaluation
... 118
7.3.1.
Experimental Setup
... 118
7.3.2.
Predicting Faulty Product and Component Fields Using Description
... 121
7.3.3.
Predicting Faulty Product and Component Fields Random Approach
... 121
viii
7.3.5.
Evaluation Metrics
... 122
7.3.6.
Evaluation Results
... 123
7.3.7.
Implication and limitations
... 135
7.4.
Threats to Validity
... 136
7.4.1.
Threats to External Validity
... 136
7.4.2.
Threats to Internal Validity
... 136
7.4.3.
Threats to Construct Validity
... 137
7.5.
Conclusions and Future Work
... 137
8
Conclusion and future work ... 139
8.1.
Thesis Findings
... 140
8.2.
Future Work
... 142
8.2.1.
Limitations
... 142
8.2.2.
Future Research Opportunities
... 143
ix
List of Figures
Figure 1. Bug Handling Process
... 3
Figure 2. An overview of the automatic bug triaging using stack traces
... 5
Figure 3. The stack trace for bug report 38601 from Eclipse bug repository
... 9
Figure 4. creating a new bug report in Eclipse Bugzilla
... 9
Figure 5. Regular expression for extracting stack traces from bug reports Eclipse
... 28
Figure 6. Regular expression for extracting stack traces from bug report Gnome
... 30
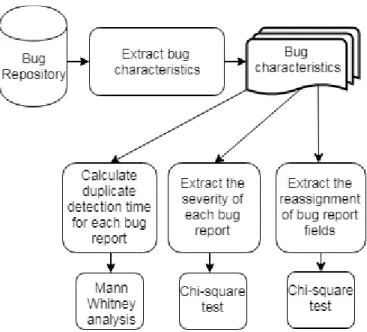
Figure 7. Data collection and analysis
... 33
Figure 8. Severe and non-severe bugs percentage based on stack trace existence Eclipse
. 38
Figure 9. Severe and non-severe bugs percentage based on stack trace existence Gnome
. 38
Figure 10. Percentage of bug reports based on existence of stack trace in Eclipse
... 40
Figure 11. Percentage of bug reports based on existence of stack trace in Gnome
... 40
Figure 12. Percentage of bug reports based on existence of stack trace in Eclipse.
... 41
Figure 13. Percentage of bug reports based on existence of stack trace in Gnome.
... 41
Figure 14. Variable length N-gram
... 46
Figure 15. Training Dataset
... 49
Figure 16. Optimization using gradient descent
... 50
Figure 17. Proposed approach (DURFEX)
... 51
Figure 18. The number of duplicate reports in all duplicate bugs groups in Eclipse
... 53
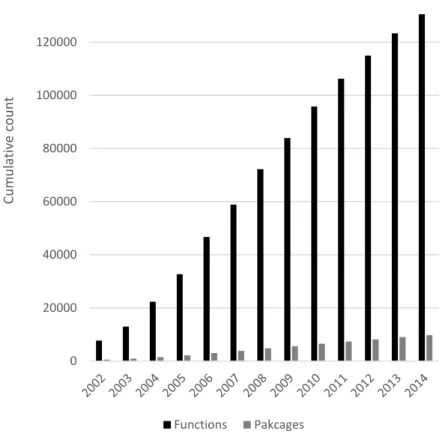
Figure 19. Cumulative number of distinct functions and packages in Eclipse
... 54
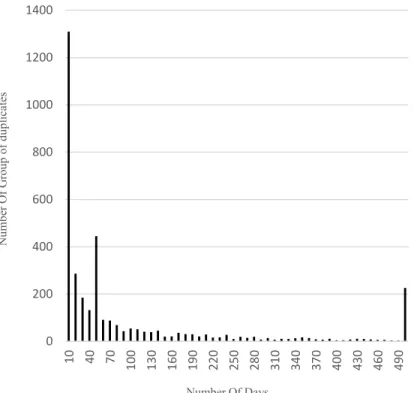
Figure 20. Days between the first and last bug report in the duplicate group in Eclipse
... 55
Figure 21. Recall rate of DURFEX, different N-grams unique functions in Eclipse
... 57
Figure 22. Recall rate of DURFEX, different N-grams distinct functions in 100 day Eclipse
.. 59
Figure 23. Comparison of processing time of in Eclipse dataset
... 61
Figure 24. Training Dataset
... 68
Figure 25. Overall Approach
... 73
Figure 26. Example of online severity prediction approach
... 74
Figure 27. The bug handling process
... 77
Figure 28. Distribution of the severity labels in Eclipse and Gnome datasets
... 79
Figure 29. Confusion matrix
... 81
Figure 30. Cost of predicting each severity label
... 82
Figure 31.
Updated testing phase using cost sensitive k nearest neighbour
... 83
Figure 32. F-measure of predicting severity by varying list size in Eclipse Critical Severity
.. 87
Figure 33. F-measure of predicting severity by varying list size in Eclipse Blocker Severity
.. 88
Figure 34. F-measure of predicting severity by varying list size in Eclipse Major Severity
.... 89
Figure 35. F-measure of predicting severity by varying list size in Eclipse Minor Severity
.... 90
Figure 36. F-measure of predicting severity by varying list size in Eclipse Trivial Severity
.... 91
Figure 37. F-measure of predicting severity by varying list size in Gnome Critical Severity
.. 92
Figure 38. F-measure of predicting severity by varying list size in Gnome Blocker Severity
. 93
Figure 39. F-measure of predicting severity by varying list size in Gnome Major Severity
... 94
x
Figure 41. F-measure of predicting severity by varying list size in Gnome Trivial Severity
... 96
Figure 42. Eclipse bug report #215679 history information
... 110
Figure 43. Training dataset
... 113
Figure 44. Overall approach
... 117
xi
List of Tables
Table 1. Eclipse dataset charchteristics
... 29
Table 2. Gnome dataset charchteristics
... 30
Table 3. characteristics of the dataset
... 52
Table 4. DURFEX recall rate on the Eclipse dataset
... 57
Table 5. DURFEX Mean reciprocal rank on the Eclipse dataset
... 58
Table 6. DURFEX results on the bug reports of the 100-day period on Eclipse
... 59
Table 7. DURFEX Mean reciprocal rank of the 100-day period on Eclipse
... 60
Table 8. Comparing the average execution time of DURFEX
... 61
Table 9. Characteristics of the datasets
... 78
Table 10. Severity prediction accuracy (Eclipse Critical severity)
... 87
Table 11. Severity prediction accuracy (Eclipse Blocker severity)
... 88
Table 12. Severity prediction accuracy (Eclipse Major severity)
... 89
Table 13. Severity prediction accuracy (Eclipse Minor severity)
... 90
Table 14. Severity prediction accuracy (Eclipse Trivial severity)
... 91
Table 15. Severity prediction accuracy (Gnome Critical severity)
... 92
Table 16. Severity prediction accuracy (Gnome Blocker severity)
... 93
Table 17. Severity prediction accuracy (Gnome Major severity)
... 94
Table 18. Severity prediction accuracy (Gnome Minor severity)
... 95
Table 19. Severity prediction accuracy (Gnome Trivial severity)
... 96
Table 20. Statistical tests of stack traces and categorical features approach for Eclipse
.... 100
Table 21. Statistical tests of stack traces and categorical features approach for Gnome
... 100
Table 22. Statistical tests of stack traces approach for Eclipse
... 100
Table 23.
Statistical tests of stack traces approach for Gnome
... 101
Table 24. Eclipse Bug Report #296383
... 103
Table 25. Eclipse Bug Report #313534
... 103
Table 26. Gnome Bug Report#273727
... 105
Table 27. Gnome Bug Report #532680
... 106
Table 28. Products and components in Eclipse dataset
... 119
Table 29. Products and components in Gnome dataset
... 120
Table 30. Characteristics of the datasets
... 121
Table 31. Product prediction accuracy for Eclipse.
... 126
Table 32. Product prediction accuracy for Gnome
... 126
Table 33. Component prediction accuracy for Eclipse
... 126
Table 34. Components prediction accuracy for Gnome
... 126
Table 35. Component prediction accuracy (Eclipse Equinox Product)
... 127
Table 36. Component prediction accuracy (Eclipse PDE Product)
... 127
Table 37. Component prediction accuracy (Eclipse E4 Product)
... 127
Table 38. Component prediction accuracy (Eclipse JDT Product)
... 127
Table 39. Component prediction accuracy (Eclipse Platform Product)
... 128
xii
Table 41. Component prediction accuracy (Gnome Other Product)
... 129
Table 42. Component prediction accuracy (Gnome infrastructure Product)
... 129
Table 43. Component prediction accuracy (Gnome Binding Product)
... 129
Table 44. Component prediction accuracy (Gnome Platform Product)
... 129
Table 45. Component prediction accuracy (Gnome Core Product)
... 130
Table 46. Component prediction accuracy (Gnome Applications Product)
... 130
Table 47. Eclipse Bug Report #213234
... 131
Table 48. Eclipse Bug Report#213234
... 132
Table 49. Eclipse Bug Report#192746
... 133
Table 50. bug report#
408425 ... 134
xiii
List of publications resulting from this thesis is as follows: Korosh Koochekian Sabor, Abdelwahab Hamou-Lhadj and Alf Larsson, “DURFEX: A Feature
Extraction Technique for Efficient Detection of Duplicate Bug Reports,” In Proceedings of the IEEE International Conference on Software Quality, Reliability and Security (QRS), 2017, pp 240-250.
Korosh Koochekian Sabor, Mohammad Hamdaqa, and Abdelwahab Hamou-Lhadj,
“Automatic prediction of the severity of bugs using stack traces,” In Proceedings of the 26th IBM Annual International Conference on Computer Science and Software Engineering (CASCON '16), 2016, pp 96-105.
Korosh Koochekian Sabor, Mohammad Hamdaqa, and Abdelwahab Hamou-Lhadj,
“Automatic prediction of the severity of bugs using stack traces and categorical features,” Elsevier Journal of Information and Software Technology (IST), 2019.
Korosh Koochekian Sabor, Abdelwahab Hamou-Lhadj, Jameleddine Hassine, Abdelaziz
Trabelsi, “Predicting bug report fields using stack traces and categorical attributes,” In Proceedings of the 28th IBM Annual International Conference on Computer Science and Software Engineering (CASCON '19), 2019, pp 224-233.
Korosh Koochekian Sabor, Mathieu Nayrolles, Abdelaziz Trabelsi, Abdelwahab
Hamou-Lhadj, “An Approach for Predicting Bug Report Fields Using a Neural Network Learning Model,” In Proceedings of the IEEE International Symposium on Software Reliability Engineering Workshops (ISSREW), 2018.
Abdo Maiga, Abdelwahab Hamou-Lhadj, Mathieu Nayrolles, Korosh Koochekian Sabor and
xiv
company: An experience report," In Proceedings of the IEEE International Conference on Software Maintenance and Evolution (ICSME), 2015, pp 342-351.
1
Chapter 1
Introduction
Software systems play a critical role in almost every industry sector, including Telecom, finance, public safety, education, etc. Failure of these systems may have important economic impacts. For example, a study showed that software failures cost the U.S. economy $59 billion every year [N2], which amounts to 0.6% of the gross domestic product of the United States [N2].
The problem is that it is almost impossible to guarantee the absence of bugs in released systems. This is due to many factors. First, exhaustive testing is known to be impossible. Second, the pressure to release new products on the market as quickly as possible often comes at the price of quality. In addition, continuous maintenance activities are prone to the introduction of new bugs in the system. As a result, many software systems continue to crash during operation.
When a system crashes, users have the option to report the crash using automated bug tracking systems such as the Windows Error Reporting tool1
, the Mozilla crash reporting system
2, and Ubuntu’s Apport
crash reporting tool3
.
These tools capture software crash and failure data (e.g., stack traces, memory dumps, etc.) from end-users.This data is sent in the form of bug (crash) reports to the software development teams to uncover the causes of the crash and provide adequate fixes. The reports are first assessed (usually in a semi-automatic way) by triagers. Triagers route bug reports to the software development teams in order to provide fixes. The manual triaging process, however, is usually very challenging since there are just many bug reports that are submitted every day. For example, on April 24, 2002, Eclipse users have submitted over 107 bug
1http://msdn.microsoft.com/en-us/library/windows/hardware/gg487440.aspx 2http://crash-stats.mozilla.com
2
reports. In the Gnome bug tracking system, over 108 bug reports were submitted by users on June 22, 2000.
When a bug is reported to the bug tracking system, it goes through a triaging process. First, triagers needs to examine if the incoming bug report is duplicate of previous bug reports, i.e., caused by a similar fault. Studies have shown that one way to improve the bug triaging process is to automatically detect duplicate bug reports [LM13, BPZK08a]. If a bug report is deemed to be a duplicate of an existing one, then triagers can mark it as duplicate and stop the process, saving time and effort.
Next, since the available resources for the development and maintenance of software systems are limited, prioritizing bug reports helps triagers identify the bugs that need to be fixed first based on the availability of resources. Triagers often rely on the information provided by the users (the report submitters) to prioritize the bug reports. However, since users are usually not familiar with the software system, the information provided by them could be inaccurate. Studies have shown that the severity of the bugs can be predicted automatically [LDGG10, LDSV11], which helps triagers to prioritize the bugs and hence speed up the bug handling process.
Triagers route bug reports that require fixes to the development team. Since each development team is usually focused on the development of a specific product and component of the software system, triagers use the faulty product and component fields of a bug report to identify the development team that can provide the fix. Because users (bug report submitters) are usually not familiar with the architecture of the software system, they may choose incorrect faulty products and components when reporting bugs, causing bug reports to be routed to the incorrect development team, which often delays the fixing time of the bugs. Triagers need to adjust the faulty product and component fields of bug reports based on other information provided by the user to avoid assignment of bug reports to incorrect teams. Based on the adjusted faulty product and component fields, they can then decide which development team has the expertise to deal with the bug report. Studies (e.g., [S12]) have shown that automatic prediction of
3
the correct component and product fields of bug reports can improve the bug handling process significantly by routing the bug report to the correct development team.
Figure 1 shows an overview of the bug triaging framework that illustrates the three main activities of the triaging teams, namely, detection of duplicate bug reports, determination of bug report severity, and routing of bug reports to developers.
Figure 1 Bug Handling Process Duplicate Bug
Report Detection Bug Severity prediction
Bug report Routing based on the team, owner of the faulty product and components Crash Report
Bug report is duplicate
Is Resolved Before
Mark the bug report as duplicate and add it to bug tracking system
Mark the bug report as duplicate and send it to developer who solved the duplicate bug No Yes
Bug report is not duplicate
Bug is critical enough to be routed Bug is not critical enough to be routed Put Bug report in queue to be routed when resources are available Bug Tracking System
4
1.1.
Terminology
In this Section, we review the terminologies used to characterize bugs, faults, errors, and crashes. Software Fault (Bug, Defect): A software fault is a static defect caused by a human error. A fault can be considered as a design or a programming mistake [AO08].
Software Error: A software error is an incorrect internal state of software caused by one or more software faults [AO08]. This incorrect internal state might or might not manifest itself as an external behaviour.
Software Failure: Many faults may stay dormant and never manifest themselves. Software failure is defined as any incorrect external behaviour of the software system, which is in contrast to the functional or non-functional requirements of the software. Failure is an external manifestation of an error caused by some faults [AO08].
Software Crash: Failure is defined as an unexpected output according to the software requirement. One of the unexpected outputs can be that the software stops working because of some faults, which is defined as a software crash.
Bug report: A bug report is a report created by a user when facing a crash in the software system. A bug report can also be submitted automatically by a crash reporting tool. We use bug report and crash report terms interchangeably in this thesis.
Duplicate Bug reports: Duplicate bug reports are bug reports that have the same underlying fault [RAN07].
1.2.
Research Hypothesis
This thesis aims to provide an efficient and accurate automatic bug triaging system, which can be implemented as part of a bug tracking framework, to reduce the overhead of manual bug triaging process significantly. Our system offers the following capabilities: duplicate bug reports detection, automatic prediction of severity of bugs, and automatic prediction of faulty product and component fields of bug
5
reports. To this end, we leverage stack traces and categorical features of bug reports, and machine learning algorithms.
The thesis statement is:
Stack traces and categorical features of bug reports contain valuable information that can be used to automatically detect duplicate bug reports, predict the severity of bugs, and predict faulty product and component fields of bug reports.
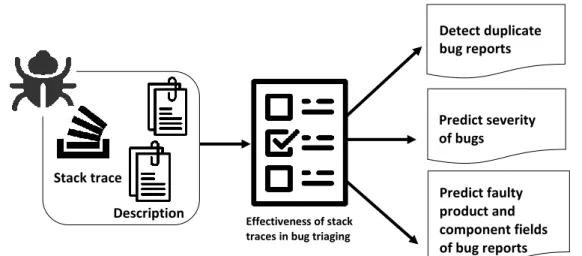
Figure 2 An overview of the automatic bug triaging using stack traces
1.3.
Thesis Contributions
An overview of the contributions of this thesis is shown in Figure 2.
We study the usefulness of stack traces in the bug triaging process. This study sheds light on how the presence of stack traces improves the bug triaging process.
We propose an approach for detecting duplicate bug reports. The approach leverages the concept of trace abstraction to facilitate the detection of duplicate bug reports.
We propose an approach for predicting the severity of bugs using stack traces and the combination of stack traces and categorical features.
We propose an approach for predicting product and component fields of bug reports using stack traces and categorical features.
Predict severity of bugs Predict faulty product and component fields of bug reports Effectiveness of stack
traces in bug triaging
Detect duplicate bug reports
Stack trace
6
1.3.1.
Chapter 2: Background and Related Work
In Chapter 2, we present background information on the content of bug reports. Next, we focus on related studies in the bug triaging. We group these studies into four pillars:
Empirical studies on bug report information. Prior studies in this aspect explore the factors that impact the quality of bug reports. These studies quantify the importance of each type of information provided in the bug reports by identifying the most important information and providing guidelines on how providing those sets of information could facilitate the bug triaging process.
Detecting duplicate bug reports. Duplicate bug report detection is a very important step in bug triaging. Duplicate bug reports, if go undetected, impose huge overhead on the bug triaging process. However, if detected properly, duplicate bug reports can provide additional information to developers to fix the bugs. Studies on duplicate bug report detection mainly focus on providing a set of potential duplicate bug reports for each incoming bug report [LM13].
Predicting the severity of bugs. Users chose a severity for each bug report submitted to the bug tracking system. Severity prediction studies aim to automatically predict the severity of bugs to minimize misinterpretation of bug report severity labels reported by users and help triagers to optimize the bug resolution process by accurate prioritization of bug reports.
Predicting faulty product and component fields of bug reports. Users chose the faulty product and component when reporting bug reports. Many studies focused on proposing techniques to automatically predict the faulty product and component fields of bug reports. These studies use the history of past bug reports to predict potential faulty product and component fields of the new bug reports.
1.3.2.
Chapter 3: Data Preparation
In Chapter 3, we present two publicly available datasets that are used to evaluate approaches proposed in this thesis. Both datasets were subject of mining challenges in Mining Software Repositories conference.
7
1.3.3.
Chapter 4: An Empirical Study on the Effectiveness of Stack traces
Stack traces are shown to be one of the most reliable sources of information used by developers to fix bugs [BJSWPZ08]. In chapter 4, we empirically study the effect of the presence of stack traces in the bug triaging process. The outcome of the study shows that stack traces improve the bug triaging process. The study shows that there is a strong potential to use the content of stack traces to automate the bug triaging process.
1.3.4.
Chapter 5: Detecting Duplicate Bug Reports
In this chapter, we propose a feature reduction technique based on the trace abstraction concept, which reduces the processing overhead of detecting duplicate bug reports, while providing good accuracy.
1.3.5.
Chapter 6: Predicting Severity of Bugs
Various techniques have been introduced to predict the severity of bugs using bug report descriptions. Following the promising result of stack traces in the improvement of the bug triaging process, we propose an approach, which predicts the severity of bugs using stack traces. We also show that using categorical features in addition to stack traces further improves the severity prediction accuracy.
1.3.6.
Chapter 7: Predicting Faulty Product and Component Fields of Bug Reports
Various methods in the literature have been proposed to predict faulty product and component fields of bug reports using bug report descriptions. In Chapter 7, we focus on using stack traces and categorical features in predicting faulty product and component fields of bug reports. We show that stack traces and categorical features can predict faulty product and component fields with higher accuracy than bug report descriptions.
1.3.7.
Chapter 8: Conclusion and future work
In chapter 8, in the first section, we focus on thesis findings. Next, we present the thesis limitations and provide a list of future research opportunities.
8
Chapter 2
Background and Related Work
In this chapter, we elaborate on the information which the bug report provides to the triagers. Next, we explain related work on the empirical study of the effectiveness of stack traces in bug triaging, duplicate bug report detection, bug severity prediction, and predicting faulty product and component fields of bug reports.
2.1.
Background
2.1.1.
Bug Report Description
Bug report description is mainly used to explain the defective behaviour of the software system. A good description should provide enough information to guide developers in understanding what the user or tester has observed during the crash. Bug report descriptions are usually verbose. An example of a well-written description is "Download fails on Customer Report page when a user clicks on the download button” meanwhile, an example of an inefficient description is "Download does not work", as it does not provide details about when or how this failure occurs. The quality of a bug report description depends on who is writing this description and hence it is subjective.
2.1.2.
Stack Trace
A stack trace is a sequence of function calls that ideally lists all function calls from the moment a software program starts execution to the crash point. In some cases, the stack trace is trimmed to contain a window of functions before the crash. An example of a stack trace is shown in Figure 3. The stack trace in Figure 3 is taken from the Eclipse bug repository. It represents the stack trace of Bug report 38601. The bug was caused by a failure of checking for a null pointer in the search for a method reference.
9
Figure 3 The stack trace for bug report 38601 from Eclipse bug repository
2.1.3.
Categorical Information
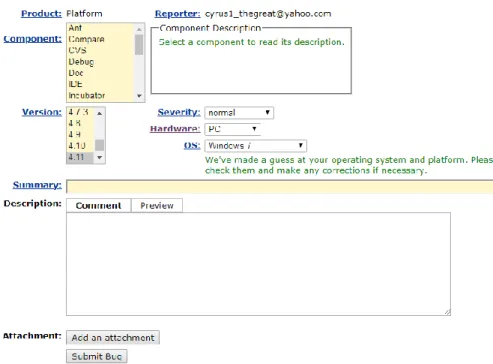
In addition to the description and stack trace, users must choose other categorical fields, which further help developers to fix the bug. This categorical information includes the product, component, version, operating system, and severity of the bug. Each software application is composed of several products, and each product is composed of several components. Users should choose the product and the component that they think the bug is related to, when reporting a bug. Version indicates the version of the software that the user was using when the crash happened. Operating system shows the name and release number of the operating system in which the software was running on when the crash happened. Also, severity shows how much a bug affects normal execution of program [LDGG10]. Figure 4 shows the information which user needs to provide when reporting a bug.
Figure 4 creating a new bug report in Eclipse Bugzilla
5- org.eclipse.jdt.internal.corext.util.Strings.convertIntoLines()
4- org.eclipse.jdt.internal.ui.text.java.hover.JavaSourceHover.getHoverInfo()
3- org.eclipse.jdt.internal.ui.text.java.hover.AbstractJavaEditorTextHover.getHoverInfo() 2- org.eclipse.jdt.internal.ui.text.java.hover.JavaEditorTextHoverProxy.getHoverInfo() 1- org.eclipse.jface.text.TextViewerHoverManager.run()
10
2.2.
Related Work
2.2.1.
Usefulness of Stack Traces
One of the earliest studies that showed the usefulness of stack traces is conducted by Battenberg et al. [BJSWPZ08]. They studied the quality of bug reports and showed that there is an
important gap between what users provide as input and what developers need to fix a bug. They argued that because users do not usually have technical knowledge about the system, it is very difficult for them to provide useful information to developers. The authors observed that developers consider stack traces to be one of the most useful information to fix a bug.
Schroter et al. [SBP10] studied the use of stack traces by developers in Eclipse projects. More precisely, they answered four research questions: 1. Are bugs fixed in the methods in stack traces? 2. How far down the stack traces are bugs fixed? 3. Are two stack traces better than one? 4. Do stack traces help speeding up debugging? They used InfoZilla [SBP10] to extract stack traces from Eclipse bug reports for the period of 2001 to 2006. They also mined the Eclipse version repository to extract the relation between bugs and the source code fixes. They showed that 60% of bug reports with stack trace were fixed in one of the stack trace methods. They concluded that developers favour stack traces since stack traces can help them find the fix location easier. They studied the number of methods in stack traces and observed that it ranges from 1 to 1024 methods with a median of 25 methods. They showed that 40% of the bugs are fixed by a patch in the first method of stack traces, 80% of the bugs are fixed by a patch in one of the first six methods of stack traces, and 90% of the bugs are fixed by a patch in one of the first ten methods of stack traces. They also showed that in the presence of multiple stack traces, 70% of the bugs are fixed in one of the methods in the first stack trace, and 90% of the bugs are fixed using one of the methods in the first three stack traces. They also showed that bug reports with stack traces are fixed sooner than bug reports without stack traces. They explained that they hope their study emphasizes the importance of stack traces and encourages users to provide stack traces in bug reports. They also suggested bug tracking tool developers provide more support for capturing stack traces in their tools.
11
Another study was conducted by Krikke [K12], where the author studied the association between the severity field of Eclipse bug reports and the presence of stack traces. He also studied the association between the time to fix a bug and the presence of stack traces in bug reports. He showed that there is a strong statistical association between severity and the presence of stack traces in the bug reports. He showed that Eclipse bug reports, which have stack traces, are fixed sooner [K12].
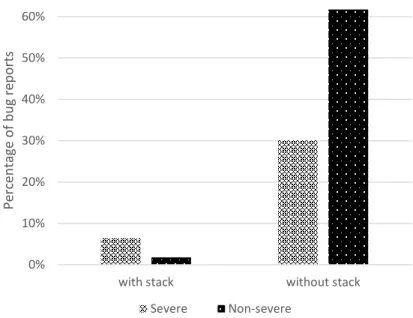
The effectiveness of four quality indicators for predicting the severity of bugs is studied by Yang et al. [YCKY14]. They categorized Blocker, Major and Critical bug severities as severe, and Minor and
Trivial bug severities as non-severe. They considered stack traces, bug report description length, attachment and step to reproduce as four quality indicators of bug reports in their study. They used the Eclipse dataset to apply their experiments. In the first round of experiments, they only used the presence of those quality indicators, whereas in the second round of experiments, they considered the quantitative value of those indicators too. The quantitate value of each quality indicator is calculated differently. For stack trace, they used the number of functions. For attachment, they considered the number of attachments. For report length, they used the quantitative value of report length, and for step to reproduce, they used the number of steps. They concluded that among those four quality indicators, the stack trace is the best indicator of bug severity.
Stack traces have also been shown to be useful in other bug processing activities. For example, Nayrolles et al. [NHTL15, NHTL16] showed that stack traces can be used to reproduce a bug in Java system, which in turn can speed up the bug fixing process.
2.2.2.
Detection of Duplicate Bug Reports
One of the key tasks of triagers is to determine whether the reported bug has been handled before or
not. If it is, then it should be marked as duplicate. While some studies such as the one by Jalbert et al. [JW08] have been conducted on the premise that duplicate bug reports should be ignored
12
reports provide additional information that can be used by developers to solve the problem faster. In both cases, the detection of duplicate bug reports is useful and needed.
Techniques for automatic detection of duplicate bug reports (e.g., [LM13, RAN07, JW08]) build a model from historical bug reports and detect duplicate bug reports using machine learning techniques. These techniques can be grouped into two main categories based on the features they use to characterize bug reports [BJSWPZ08]. The first category uses the bug report description provided by the submitter. While bug report descriptions can be useful, they remain informal and not quite reliable [RAN07]. The second category consists of the techniques that use stack traces (also called crash traces). Stack traces have
shown to be more reliable than bug report descriptions [LM13]. In addition, as noted by Adrian et al. [SBP10], bug reports that have stack traces tend to be fixed sooner.
2.2.2.1.
Detection of Duplicate Bug Reports Using Bug Report Description
Techniques that use descriptions to detect duplicate bug reports use words in the description (called
terms) as features. They often resort to the use of term frequency and inverse document frequency (TF-IDF) [LM13] to weigh the feature vector constructed by these terms. TF-IDF is a weighting scheme in
which, given all terms in a corpus of bug descriptions, it weighs each feature or term by its frequency of appearance in one bug description normalized by its frequency of appearance in the whole corpus [LM13].
Runeson et al. [RAN07] used term frequency applied to the description of bug reports in the bug repository of the Sony Ericsson Company. They used each word in the description as a feature and represented each bug report as a vector. Before calculating the similarity between bug report descriptions, they went through some preprocessing steps. These steps include tokenization, stemming, and stop-words removal. To weigh the features, they used the frequency of each word. They defined an accuracy metric for detecting duplicate bug reports called recall rate. Recall rate is defined as the percentage of duplicate bug reports from the whole duplicate bug reports set in the system for which
13
their duplicate bug reports were found in the suggested list, provided as the result of the approach. If we assume that the total number of bug reports is T and that the total number of duplicate bug reports for which the duplicates are in the suggested list provided by the approach as D, then the recall rate is calculated as:
Recall Rate =
𝐷𝑇
(1)
The authors used various similarity metrics and concluded that different similarity metrics do not change the recall rate significantly. Using the bug report descriptions, they reached a recall rate of up to 42% for detecting duplicate bug reports.
Jalbert et al. [JW08] proposed a linear model to eliminate duplicate bug reports that reach developers. The authors used textual description, categorical information, and clustering information of bug reports as features extracted from the Mozilla project bug repository. They used term frequency to weigh the feature vector. They trained the model to obtain a threshold based on triage and miss effort and used the threshold to eliminate duplicate bug reports. Using the trained model, 10% of duplicate bug reports were eliminated before reaching the developers. They used a leave-one-out approach to show the importance of each feature. They concluded that bug reports titles and descriptions are the most important features to measure the similarity of bug reports.
Duplicate bug reports are not always unwanted since they can provide additional insight into the underlying fault in the software system [BPZK08a]. Thus, detecting duplicate bug reports is not about eliminating them, but to provide additional information about the bugs. Bettenburg et al. [BPZK08a] showed that the developer's performance in fixing bugs could increase if duplicate bug reports are included.
In most bug tracking systems, when a bug is reported, in addition to the textual description of the bug report, the title or a summary of the bug is usually provided. Considering that the title of the bug report usually contains keywords that could have more discriminative power than terms in the description,
14
Sun et al. [SLWJK10] used a combination of features extracted from the title and the description to train an SVM model to detect duplicate bug reports. The features are 1-Gram and 2-Grams of terms extracted from the summary, the description or both. Then, the inverse document frequency (IDF) is used to weigh the features. The authors showed that the combination of features extracted from both the title and the description of bug reports improves the recall rate by 17%-31% for OpenOffice, 22%-26% for Firefox and 35-43% for Eclipse.
Sun et al. [SLKJ11] showed that having a linear combination of categorical features and textual description features can increase the duplicate bug report detection accuracy of the model compared to models that use only bug report descriptions. The authors also proposed to use BM25 as opposed to TF-IDF to improve the accuracy of the approach. BM25 is a parametrized version of TF-IDF. The parameters in BM25 can be optimized using optimization methods such as gradient descent. BM25 is designed for calculating the similarity of a query to a corpus of documents. Using the optimized duplicate detection method, the authors achieved a recall rate of 45% for OpenOffice, 46% for Mozilla and 53% for Eclipse.
Sureka et al. [SJ10] used a Character-Gram based model instead of a word-based model to detect duplicate bug reports using the description. The advantage of using a character-based N-gram is that it can be used as a free-form text duplicate report detector. This means that the proposed approach is language independent. In addition, character-based N-Gram uncovers key linguistic features of the bug report description. It can handle misspelled words, has the ability to match term variations to a common root and the ability to match hyphenated phrases.
Topic modelling techniques, when applied to a corpus of bug report descriptions, can extract existing topics. Each topic in the context of bug report descriptions can reflect a specific functionality of the system. Nguyen et al. [NNNLS12] proposed DBTM (Duplicate Bug Report Topic Model) that uses topic modelling combined with information retrieval techniques to detect duplicate reports. In DBTM, LDA (Latent Dirichlet Allocation) topic modelling technique and BM25 were parameterized and combined.
15
The authors optimized the parameter using linear regression. The result shows a 20% improvement over stand-alone informational retrieval techniques.
Alipour et al. [AHS13] used software architecture knowledge to improve duplicate bug reports detection accuracy. They used a word list that is extracted from the software architecture specification as a new feature. Using this contextual information, they improved the accuracy of detecting duplicate bug reports by 12.11%.
2.2.2.2.
Detection of Duplicate Bug Reports Using Stack Traces
In addition to bug reports descriptions, stack traces have been used to detect duplicate bug reports. A stack trace ideally consists of a history of function calls starting from the bottom of the stack trace having the first function executed to the top of the stack trace where the last function is executed when the crash happened. This history of function calls gives the triagers and developers clues on which execution path the program went through before it crashed.
Schoter et al. [SBP10] investigated the role of stack traces in helping developers to fix bugs. The authors showed that bugs that are reported with stack traces get fixed sooner. Brodie et al. [BMLSM+05] conducted studies on duplicate bug report detection using stack traces. The authors used stack trace matching algorithms to calculate similarity among stack traces of various bug reports. The authors pruned stack traces before applying stack trace matching algorithms. The same concept of stop-word removal that is implemented in duplicate bug report detection using bug report descriptions can be used to prune stack traces. In stack traces, stop-words are functions that are always called when the software starts (entry-level functions), functions that are called when an error happens (programming language error handling functions), and recursive functions.
When comparing two functions from different stack traces, it is important to consider their position in the stack trace. The functions that are near to the top of a stack trace are more likely to be the cause of failure. Brodie et al. [BMLSM+05] applied the Needleman–Wunsch algorithm (inspired from
16
bioinformatics) to compare the sequence of functions in stack traces. They showed that comparing each existing stack trace with all the other ones is not possible due to the high computational overhead. They used a B+ tree by hashing top J functions to overcome this problem. They explained that if the top four functions are not the same, the probability of two stack traces being related to the same underlying fault is small.
Modani et al. [MGLMM07] pruned functions from stack traces by removing recursive functions using a function frequency algorithm. The authors used inverted indexing to overcome the problem of high computational overhead when comparing stack traces. They compared three different approaches, including their own, which was similar in principle to the one proposed by Brodie et al. [BMLSM+05], and an approach based on a prefix matching algorithm. The authors showed that the prefix matching algorithm has the best accuracy. They also showed that eliminating uninformative functions increases the accuracy of detecting stack traces that are related to the same underlying fault.
Bugzilla bug tracking system does not have a separate field to store stack traces. Eclipse and Gnome use the Bugzilla bug tracking system. In such systems, users copy the content of stack traces into the bug report description field. Structural information stored in Eclipse Bugzilla is not limited to stack traces but could be patches, source codes or enumerations [BPZK08b]. Bettenburg et al. [BPZK08b] developed a tool called InfoZilla to extract structured information from the bug report descriptions of Eclipse. The authors showed that the accuracy of extracting structural information is 97% in Bugzilla.
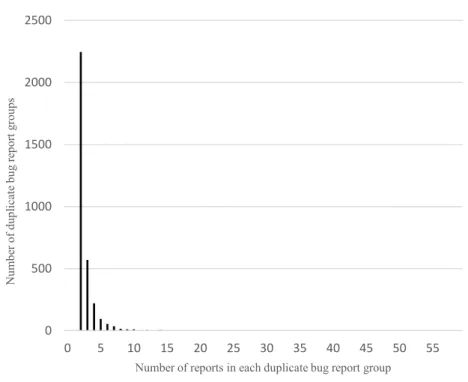
Kim et al. [KZN11] suggested creating buckets (clusters) of duplicate bug reports. Each bucket was generalized using a crash graph, which is based on the function calls of all stack traces in a bucket. Having a threshold of 97% similarity, the precision and recall of detecting duplicate bug reports are 68% and 64%, respectively. However, considering that Lerch et al. [LM13] showed that mostly duplicate bug report groups are buckets of size two, the applicability of the proposed approach is expected to be lower for Eclipse bug repository. In practice, when a new bug report is reported, it has only one duplicate bug
17
report in the dataset, and no generalization can be made on that bug report alone based on crash graph theory. On the other hand, this approach only works when a bucketing system exists in the bug tracking system, which is not the case in many bug tracking systems such as Bugzilla.
Dang et al. [DWZZN12] proposed a method for calculating call stack similarity called the position-dependent model (PDM). The position-dependent model considers two main metrics, namely
the distance to the top frame, and the alignment offset to calculate the similarity among stack traces. PDM separates all shared function sequences between two call stacks, and then for each, it calculates the distance to the top and the alignment offset. The evaluation that has been done on five Microsoft products showed that comparing diverse approaches including WER, ReBucketing, Prefix match and Crash Graphs while using buckets created by Microsoft developers as the ground truth, PDM has slightly worse purity than WER but better inverse purity and F-measure on all of the Microsoft products. When PDM was used for bucketing bug reports, the total number of buckets has been reduced by 25%. Le et al. [LK12], argued against placing only duplicate bug reports in a group. They conducted a study on five Mozilla applications and showed that a good grouping of bug reports should consider reports of bugs that are caused by the same root causes and those that are dependent on these causes. The rationale is that bugs that can be resolved by the same group of developers should be placed in the same group. Wang et al. [WKZ13] proposed to use crash correlation to group reports of bugs with the related causes in the same crash group. A crash correlation group is defined as a diverse group of crash types that are related to the same faults. Crash types are created by collecting crashes with similar stack traces. Studies on Firefox Bugzilla and Eclipse Bugzilla involving developers showed that using only crash type signatures (the common top frame functions among all the stack traces in a crash type), one can identify the crash correlation groups with an acceptable level of precision and recall. To push the idea to a next step, they showed that not only comparing crash types signatures but also comparing fully qualified file names in
18
the top frame of crash types or the presence of a frequent close ordered subset of frames between crash types can be used to create crash correlation groups.
Lerch et al. [LM13] applied TF-IDF to the corpus of stack traces considering each frame containing the function name as a feature. Each feature was weighed using its frequency in the current stack trace and normalized by its frequency in the whole corpus (containing all stack traces). The authors used Eclipse bug reports submitted between 2001 and 2008 for their experiments. Their study showed that the majority of duplicate bug reports sets contain only two bug reports. In fact, the number of groups of duplicate bug reports containing only two bug reports is ten times more than the total number of groups of bug reports having more than two bug reports.
Ebrahimi et al. [EH15, EIHH16, ETIHK19] proposed several approaches that leverage the use of generalizable automata and Hidden Markov Models (HMM) and stack traces for the detection of duplicate bug reports. They showed that stack traces can be modeled as stochastic processes, which are used as a prediction model. Their models reach an accuracy of up to 90% using a ranked list of suggested bug reports.
2.2.3.
Predicting Bug Severity
When reporting a bug, users usually assign a severity to it. The severity level of a bug should reflect the impact of the bug on the execution of the software system [LDSV11]. Triagers approve or modify the severity level assigned by users. Critical bugs should be dealt with sooner by the developers, whereas low priority bugs could be handled once resources become available. Severity is also used by developers to assign a priority to the bug report. In practice, it is difficult to assign a severity level to a bug without some tool support. There exist several approaches that aim to automatically predict the severity of incoming bug reports based on historical data [GS14, LDGG10, LDSV11].
19
2.2.3.1.
Predicting Severity Using Bug Report Description
Antoniol et al. [AADPKG08] built a dataset using 1800 issues reported to bug tracking systems of Mozilla, Eclipse and JBoss (600 reports from each bug tracking system). In these bug tracking systems, issues can be labeled as corrective maintenance or other kinds of activities such as perfective maintenance, preventive maintenance, restructuring or feature addition. In this study, issues that are related to corrective maintenance are categorized as Bug, while issues related to other activities are categorized as Non-bug. Each of the 1800 issues, extracted from bug tracking systems, is revised and labelled manually. In some cases, bugs were not related to Eclipse, so they are removed from the training and testing set. They considered bug reports descriptions as the best sources of information to train the machine learning techniques for predicting severity [BJSWPZ08]. The authors used words in the descriptions as features. They used the frequency of words for weighing the feature vector, which corresponds to each bug report. In addition to the words in the description, they added the value of the severity field as a feature. After extracting words, they are stemmed. However, no stop-word removal is performed. The rationale behind not removing stop-words is that they may be discriminative and may be used by the classifier to improve classification accuracy. They used various classification methods, such as decision trees, logistic regression, and naïve Bayes to classify issues. Each of the classifiers is trained using the top 20 or 50 features. The accuracy of the approach, when applied to Mozilla, is 67% and 77% with the top 20 and 50 features, respectively. The accuracy of the approach applied to Eclipse issues having 20 features is 81%, and having 50 features is 82%. The accuracy of the approach, when applied to JBoss issues having 20
features, is 80%, and having 50 features is 82%. They showed that for Eclipse, some words (e.g. “Enhancement”) are good indicators of Non-bug issues, while some words (e.g. “failure”) are good
indicators of Bug issues. They also showed that their approach outperforms the regular expression based approach, which uses the grep command [AADPKG08].
Menzies et al. [MM08] did a study on an industrial system in NASA. NASA uses a bug tracking system called Project and Issue tracking system (PITS). They examined bug reports raised by testers and sent to
20
PITS. In NASA severity of bugs are on a five-point scale. One corresponds to the worst, most critical bug and five is the dullest bug. They introduced a tool called SEVERIS, which, using the description of the bug reports and text mining techniques, predicts the severity of an issue. They tokenized terms, removed stop-words and finally stemmed the terms. They used the TF-IDF score of each term to rank them, and then they cut all but top K features. Furthermore, they did another round of feature reduction using information gain. They used rule learner to deduce rules from the weighed features. For the case study, five different systems and consequently, five different datasets are used. The main problem with the datasets was that they did not have any bug with severity one (Critical severity), and the total number of bug reports was 3877. The authors calculated precision, recall and F-measure for each of the severities. Using the top 100 words as features, F-measure was averagely 50% for predicting bugs severities. They showed that in their dataset, using the top 3 features or 100 features does not change the F-measure of the proposed approach significantly. This fact shows that predicting severities using a much smaller number of features that have more discriminative power reveals good results.
Lamkanfi et al. [LDGG10] did a study to show the discriminability power of the terms in bug report descriptions. They build a dataset of open-source software such as Mozilla, Eclipse and Gnome to evaluate the proposed approach. In Bugzilla, severity can be Critical, Major, Normal, Minor, Trivial or Enhancement. To have a coarse-grain categorization, the authors labelled all issues which were Critical or Major as Severe and issues that were Minor, Trivial or Enhancement as Non-Severe. They ignored using issues marked as Normal because it is the default choice that will be assigned to a bug in Bugzilla, and users may choose it arbitrarily. The bug severity prediction in this study is modelled as a document classification problem. They used the summary and description of bug reports for training and evaluation. The authors organized bug reports according to their faulty product and component fields. They used 70% of bug reports as the training set and 30% of bug reports as the testing set. They did a study on the most important features and concluded that words like “crash” or “memory” are good indicators of severe bugs. The authors did a second round of experiments using only descriptions and showed that
21
using only descriptions decreases the performance in many cases. They did experiment having training sets with different sizes and concluded that a training set having 500 bug reports is enough to have a generalizable result. They also showed that increasing the number of bug reports to more than 500 does not change the evaluation result. In the fourth round of experiments, they showed that when applying the severity prediction approach on the Eclipse bug tracking system, isolating bug reports according to the affected component and product fields leads to a better result.
Lamkan et al. [LDSV11] compared the effect of having diverse mining algorithms applied to bug repositories to predict the severity of the bugs. The authors used the same labeling principal as Lamkanfi et al. [LDGG10]. Eclipse and Gnome are the datasets that are used to evaluate the accuracy of predicted severities. Bug reports are extracted and categorized according to their faulty product and component fields. They compared Naive Bayes, Naive Bayes multinomial, 1-Nearest Neighbour and Support Vector Machine classifiers. Since different classification approaches need different ways to weigh feature vector, in this study when doing experiments using Naïve Bayes, only the presence or absence of each term is used for weighing features. When doing experiments using Naïve Bayes Multinomial, the frequency of each word is used for weighing each feature vector. Using 1-Nearest Neighbour or Support Vector Machine, term frequency and inverse document frequency is used for weighing feature vectors. They calculated precision and recall, the area under the curve (AUC) for each dataset to compare the classifiers. They showed that using Naïve Byes Multinomial, the area under the curve is averagely 80% which is higher than other approaches. Next, they showed that using the Naïve Bayes classifier, a stable accuracy value is achieved having 250 bug reports of each severity for training. The result shows that increasing the training set by adding more than 250 bug reports does not change the accuracy. Having a list of words that have good discriminative power, they concluded that each component has its list of words. Thus, terms that have good discriminative power are component-specific. This result encourages applying severity prediction approaches on each component independently since it reveals better results.
22
Yang et al. [YHKC12] compared the effectiveness of feature selection methods on a coarse grain severity prediction technique. They used the Naïve Bayes classifier to study the effectiveness of each feature selection method. They used information gain, Chi-square and correlation coefficient as feature selection techniques. They used Eclipse and Firefox datasets and true positive rate (TPR), false positive rate (FPR) and area under curve (AUC) metrics to evaluate their studies. They showed high information gain is a good indicator of severe bugs and low information gain is a good indicator of non-severe bugs. They concluded that the best feature selection technique for Eclipse and Mozilla is the correlation coefficient. While all of the studies presented so far focus on a coarse-grain severity prediction, Tian et al. [TLS12] proposed an approach for finer grain prediction of bug severities. A fine-grain approach targets each severity type (Critical, Major, Normal, Minor, Trivial, and Enhancement) to predict the severity of a bug by classifying it into one of these types. The authors used OpenOffice, Mozilla and Eclipse bug repositories to evaluate their approach. In the first place, they removed bug reports having Normal severities, because they are the default value when reporting a bug. They used the K-nearest neighbour algorithm to predict severity. They used 𝐵𝑀25𝑒𝑥𝑡 as the similarity metric. They used the similarity of bug reports descriptions using 1-gram words as the first feature, similarity of the descriptions of bug reports using 2-gram as the second feature, and faulty product and component fields of bug reports as the third and fourth features respectively. With the arrival of each new bug report, it is compared to all the existing bug reports and the severity of the bug that is the closest to the incoming bug is used as the predicted severity of the incoming bug.
Yang et al. [YZL14] studied the effectiveness of topic modeling on fine-grain severity prediction. Instead of using categorical features in similarity calculation, they only considered bug reports if they had the same product, component and priority. In the first step, they used latent Dirichlet allocation (LDA) to extract topics from the corpus of documents. They represented each topic as a bag of words. Instead of the vector space model, they used smoothed unigram vectors and they used KL divergence instead of cosine similarity to measure the similarity of smoothed vectors. They showed the effectiveness of their
23
approach by applying it on Mozilla, Eclipse and NetBeans bug repositories. They used an online approach in which with the incoming of each bug report its probability vector is extracted. K-nearest neighbour is then applied to the bug reports with the same topics and according to the returned list of similar bug reports, the label is chosen.
Bhattachrya et al. [BINF12] explored alternate avenues for bug severity prediction using a graph-based analysis of the software system. They built a graph based on different aspects of software systems including source code graphs based on function calls (e.g., a static call graph) or modules (module collaboration graph) and, at a more abstract level, they built a graph based on developer’s collaboration. They used Firefox, Eclipse and MySql to show the effectiveness of their approach. They used various graph-based metrics including average degree, clustering coefficient, node rank, graph diameter and assortativity to characterize software structure and evolution. They showed that the node rank metric in the function call graph is a good indicator of bug severity. They also showed that the Modularity Ratio is a good indicator for modules that need less maintenance effort.
Zhang et al. [ZYLC15] explored the effectiveness of concept profiles in predicting the severity of bugs. They extracted concept terms and calculated their threshold for each fine-grain severity label in the training set. A concept profile corresponding to each severity label using concept terms is built next. Instead of the vector space model, they used the probability vector to represent each bug report. Also, instead of cosine similarity, they used KL divergence for calculating the similarity between each bug report in the testing set and each concept profile which corresponds to each severity label in the training set. They showed the effectiveness of their approach by applying it on Eclipse and Mozilla bug repositories. They used an offline approach in which they used 90% of the data as the training set and 10% of the data as the testing set.
24
2.2.4.
Bug Report Faulty Product and Component Field Prediction
Faulty components or products are important fields of bug reports that are used by triagers and developers to localize the faults. When submitting a bug report, a user has the option to choose a product of the software system from a predefined set provided by the bug tracking system. Since each product, in the system, has its own set of components, after choosing the product, a set of predefined components according to the selected product will be made available to the user to choose from.
2.2.4.1.
Bug Report Faulty Product and Component Field Prediction Using Bug Description
An early work on bug categorization was conducted by Lucca et al. [LPG02]. The authors used five different text mining models to classify incoming bug reports (referred to as tickets in their paper). They manually labelled each ticket into eight predefined categories, each corresponding to a maintenance team. They used the description of tickets and applied a probabilistic model, a vector space model, support vector machine, regression tree, and K-nearest neighbour. They showed that probabilistic and the K-nearest neighbour models provide the best accuracy.
Betteneburg et al. [BJSWPZ08] explained that since users do not usually have technical knowledge about the system, it is very difficult for them to properly report the faulty product and component fields. They also showed that incomplete (or incorrect) information of a bug report is one of the major obstacles for developers for providing fixes.
Guo et al. [GZNM11] showed that there are five main reasons which cause bug report field reassignment: Finding the root cause, determining owner