Multiple Measures Placement
Using Data Analytics
An Implementation and
Early Impacts Report
Elisabeth A. Barnett, Peter Bergman, Elizabeth Kopko,
Vikash Reddy, Clive R. Belfield, and Susha Roy
Multiple Measures Placement
Using Data Analytics
An Implementation and Early Impacts Report
Elisabeth A. BarnettCommunity College Research Center Peter Bergman
Community College Research Center Elizabeth Kopko
Community College Research Center Vikash Reddy
California Policy Lab, University of California, Berkeley Clive R. Belfield
Queens College, City University of New York Susha Roy
Community College Research Center
with Dan Cullinan
MDRC
September 2018
The Center for the Analysis of Postsecondary Readiness (CAPR) is a partnership of research scholars led by the Community College Research Center, Teachers College, Columbia University, and MDRC. The research reported here was supported by the Institute of Education Sciences, U.S. Department of Education, through Grant R305C140007 to Teachers College, Columbia University. The opinions expressed are those of the authors and do not represent views of the Institute or the U.S. Department of Education. For more information about CAPR, visit postsecondaryreadiness.org.
Acknowledgments
The authors of this report are deeply grateful to the seven SUNY colleges that courageously joined this research project and have been excellent and committed partners: Cayuga Community College, Jefferson Community College, Niagara County Community College, Onondaga Community College, Rockland Community College, Schenectady County Community College, and Westchester Community College. We also greatly value our partnership with the State University of New York System Office and especially appreciate Deborah Moeckel’s support and encouragement.
Many other people have supported this work by providing feedback on drafts of this report. James Benson, our program officer at the Institute of Education Sciences, offered extensive input and useful suggestions. Other reviewers provided helpful insights, including Thomas Bailey (CCRC), Nikki Edgecombe (CCRC), Lisa Ganga (CCRC), Laura Gambino (CCRC and Guttman Community College), and Alex Mayer (MDRC). In addition, CCRC editors Kimberly Morse and Doug Slater improved the flow and clarity of the text.
iii
Overview
Many incoming college students are referred to remedial programs in math or English based on scores they earn on standardized placement tests. Yet research shows that some students assigned to remediation based on test scores would likely succeed in a college-level course in the same subject area without first taking a remedial course if given that opportunity. Research also suggests that other measures of student skills and performance, and in particular high school grade point average (GPA), may be useful in assessing college readiness.
CAPR is conducting a random assignment study of a multiple measures placement system based on data analytics to determine whether it yields placement determinations that lead to better student outcomes than a system based on test scores alone. Seven community colleges in the State University of New York (SUNY) system are participating in the study. The alternative placement system we evaluate uses data on prior students to weight multiple measures — including both placement test scores and high school GPAs — in predictive algorithms developed at each college that are then used to place incoming students into remedial or college-level courses. Over 13,000 incoming students who arrived at these colleges in the fall 2016, spring 2017, and fall 2017 terms were randomly assigned to be placed using either the status quo placement system (the control group) or the alternative placement system (the program group). The three cohorts of students will be tracked through the fall 2018 term, resulting in the collection of three to five semesters of outcomes data, depending on the cohort.
This interim report, the first of two, examines implementation of the alternative placement system at the colleges and presents results on first-term impacts for 4,729 students in the fall 2016 cohort. The initial results are promising. The early findings show that:
• While implementing the alternative system was more complex than expected, every college developed the procedures that were required to make it work as intended.
• Many program group students were placed differently than they would have been under the status quo placement system. In math, 14 percent of program group students placed higher than they would have under a test-only system (i.e., in college-level), while 7 percent placed lower (i.e., in remedial). In English, 41.5 percent placed higher, while 6.5 percent placed lower.
• Program group students were 3.1 and 12.5 percentage points more likely than control group students to both enroll in and complete (with a grade of C or higher) a college-level math or English course in the first term.
(Enrollment and completion rates among the control group were 14.1 percent in math and 27.2 percent in English.)
• Women appeared to benefit more than men from program group status in math on college-level math course placement, enrollment, and completion (with a grade of C or higher) outcomes; Black and Hispanic students appeared to benefit more than White students from program group status in English on college-level English course placement and enrollment outcomes, but not on completion (with a grade of C or higher).
• Implementation of the alternative system added roughly $110 per student to status quo fall-term costs for testing and placing students at the colleges; ongoing costs in the subsequent fall term were roughly $40 per student above status quo costs.
The final report, to be released in 2019, will examine a range of student outcomes for all three cohorts, including completion of introductory college-level courses, persistence, and the accumulation of college credits over the long term.
Contents
Acknowledgments ii
Overview iii
List of Exhibits vii
Executive Summary ES-1
Chapter
1 Introduction 1
Background and Context 3
About CAPR 7
2 Placement System and Study Design 9
Site Descriptions 10
Creating a Data Analytics Placement System 11
Implementing the Alternative Placement System 16
Randomized Controlled Trial Procedures 17
3 Implementation Findings 19
Status Quo Placement Procedures 19
Implementation of the Data Analytics Placement System 22
Impact of the Alternative System on Various College Groups 23
Challenges of Alternative Placement 26
Lessons for Others 28
4 Early Impacts Data, Analysis, and Results 31
Data and Sample 31
Analytic Method 32
Baseline Student Characteristics 33
Post-Randomization Student Characteristics 33
Program Placement: Descriptive Outcomes 34
Treatment Effects 35
Subgroup Analyses 40
5 Cost Analysis 47
First-Year Fall-Term Costs 47
Subsequent-Year Fall-Term Costs 49
Future Analysis on Cost-Effectiveness 49
6 Conclusion 53
Appendix A: Supplementary Tables and Figures 57
vii
List of Exhibits
Table2.1 Hypothetical Spreadsheet on Projected College-Level Placement and
Completion Rates (With Grade C or Higher) at Given Cut Points 15 5.1 First-Year Fall-Term Implementation Costs for the Data Analytics
Placement System 50
5.2 Subsequent-Year Fall-Term Operating Costs for the Data Analytics
Placement System 51
A.1 Student Academic Outcome and Process Measures Used in the Evaluation 59
A.2 College Characteristics 60
A.3 Math Algorithm Components by College 61
A.4 English Algorithm Components by College 61
A.5 Historical Underplacement, Overplacement, and Total Error Rates 62
A.6 Effect of Program Assignment on College Enrollment 62
A.7 Baseline Descriptive Student Characteristics by College (Among Enrolled
Students) 63
A.8 Post-Randomization Characteristics by Treatment Assignment 64 A.9 Differences in Placement Relative to Status Quo for Program Group
Students 65
A.10–18 [Multiple Tables on Main Results for Each Outcome of Interest] 66 A.19–36 [Multiple Tables on Subgroup Results for Each Outcome of Interest] 71
Figure
ES.1 Observed Difference in Placement Relative to Status Quo Among Program
Group Students Who Took a Placement Test in Each Subject Area ES-5
ES.2 College-Level Course Outcomes in Math and English ES-7
4.1 Observed Difference in Placement Relative to Status QuoAmong Program
Group Students Who Took a Placement Test in Each Subject Area 35 4.2 Math Outcomes (Among Students Who Took a Math Placement Test) 37 4.3 English Outcomes (Among Students Who Took an English Placement Test) 38
4.4 College-Level Course Outcomes (Among All Students) 39
4.5 College-Level Credit Accumulation (Among All Students) 40
4.6 Placement in College-Level Math (Among Enrolled Students) 42
4.7 Enrollment in College-Level Math (Among Enrolled Students) 42
4.8 Enrollment in and Completion of College-Level Math (Among Enrolled
Students) 43
4.9 Placement in College-Level English (Among Enrolled Students) 44 4.10 Enrollment in College-Level English (Among Enrolled Students) 45 4.11 Enrollment in and Completion of College-Level English (Among Enrolled
Students) 45
A.1 Relationship Between Minimum Detectable Effect (MDE) and Sample Size:
ES-1
Executive Summary
Two thirds of students who attend community colleges and two fifths of students who attend public four-year colleges enroll in one or more remedial courses (also known as developmental education courses) to strengthen their skills for college-level coursework (Chen, 2016). Remedial courses may be helpful to some students, but they also require students to make a substantial investment of limited time and money that could otherwise be applied to college-level coursework, and studies suggest that the effects of remedial courses on student outcomes are at best mixed for those who are thought to be on the cusp of needing additional academic support (Jaggars & Stacey, 2014). Further, students who start college in remedial coursework are less likely to graduate (Attewell, Lavin, Domina, & Levey, 2006). It is therefore important to decide which incoming students ought to enroll in remedial courses. Currently, most students who participate in remediation in math or English (or both) are referred to these programs based on the scores they earn on standardized placement tests, which they typically take when they arrive at college. Yet in recent years, questions have arisen about how useful these standardized tests are for placing incoming students into remedial and college-level coursework. Research shows that some students assigned to remediation based on test scores would likely pass a college-level course in the same subject area without first taking a remedial course if given that opportunity; it also suggests that using multiple measures of student skills and performance, and in particular high school grade point average (GPA), may be useful in assessing college readiness (Belfield & Crosta, 2012; Scott-Clayton, 2012).
Partly in response to these findings, an increasing number of colleges are now exploring or beginning to use multiple measures to place incoming students into remedial or college-level courses (Rutschow & Mayer, 2018). Multiple measures placement systems often make use of placement test results but also consider other relevant data on incoming students, such as high school GPA. While studies suggest that using multiple measures may result in the improved placement of students into remedial and college-level courses, little evidence to date has shown that using a multiple measures placement system influences other student outcomes.
To address this gap, CAPR is conducting a random assignment study of a multiple measures placement system to determine whether it yields placement determinations that lead to better student outcomes than a system based on test scores alone. Seven community colleges in the State University of New York (SUNY) system are participating in the study. The placement system CAPR researchers are evaluating uses data on prior students to develop predictive algorithms at each college to weight multiple measures — including placement
test scores, high school GPA, years since high school graduation, and in some cases other measures — that are then used to place incoming students into remedial or college-level courses. Over 13,000 incoming students who arrived at these colleges in the fall 2016, spring 2017, and fall 2017 terms were randomly assigned to be placed using either the status quo placement system (the control group) or the alternative placement system (the program group). The three cohorts of students will be tracked through the fall 2018 term, resulting in the collection of three to five semesters of outcomes data depending on the cohort.
CAPR researchers and personnel from the seven colleges worked together to develop the data analytics algorithms and the alternative system for placement. Given differences among the SUNY community colleges participating in the study, the data analytics algorithms employed to assess program group students were created for each college individually (one each for math and English), using historical data from 2011–14. Data on multiple measures — such as high school GPA, years since high school graduation, and placement test scores — as well as data on outcomes in college-level courses were used to create algorithms that weight each measure in the most appropriate way for predicting student performance in initial college-level math and English courses.
After the algorithms were developed, historical data were also used to predict placement and success rates in initial college-level courses in each subject area at a range of cut points. Faculty at each college then created placement rules by choosing the cut points that would be used to place program group students into remedial or college-level math and English courses.
Development of the algorithms using historical data showed that placement accuracy is a concern for all colleges in the study. Between one third and one half of prior students were estimated to have been “misplaced” in math and English at the colleges. Misplaced students include “underplaced” students, who were placed in a remedial course but would likely have been able to complete an initial college-level course with a grade of C or higher, as well as “overplaced” students, who were placed into and failed a college-level course. With one exception (math misplacement rates at one college), historical rates of underplacement were higher than historical rates of overplacement for both math and English at each of the colleges, and in most cases much higher.
ES-3
Implementation Findings
The seven colleges in this study all followed very similar status quo placement procedures before beginning their involvement with this project. Most of the colleges relied heavily on the results of ACCUPLACER or other single tests for placement. CAPR research teams visited each of the seven participating colleges on two separate occasions to learn what college personnel thought about both the status quo and alternative placement systems and to better understand the processes required to implement the alternative system.
While most interviewees at the colleges were quick to point out weaknesses in the status quo system, they also emphasized two strengths of that system: (1) the straightforward nature of comparing a student’s score on a test with an established cut score to place students (compared with the relative opacity of using the algorithm score produced under the alternative system, which combines weighted values from a number of different sources), and (2) the related efficiency of the status quo system, which allows students to be placed into coursework very quickly, and without need to obtain additional information.
In terms of weaknesses, interviewees frequently reported their belief that the placement tests used under the status quo system were not doing a good job of placing students into the appropriate level of coursework. They also expressed strong concerns that students do not recognize how important the tests are and that some students proceed through the tests too quickly.
Overall, implementation of the multiple measures, data analytics placement system created a significant amount of up-front work to develop new processes and procedures that, once in place, generally ran smoothly and with few problems. At the beginning of the project, colleges underwent a planning process of a year or more, in close collaboration with the research team, in order to make all of the changes required to implement the alternative placement system.
Among other activities, each college did the following: (1) organized a group of people to take responsibility for developing the new system, (2) compiled a historical dataset in order to create the college’s algorithms, (3) developed or improved processes for obtaining high school transcripts for incoming students and for entering transcript information into IT systems in a useful way (which in some cases was time-consuming and challenging), (4) created procedures for uploading high school data into a data system where it could be combined with test data at the appropriate time, (5) changed IT systems to capture the placement determinations derived from the use of multiple measures, (6) created new placement reports for use by students and advisors, (7) provided training to testing staff and advisors on how to interpret the new placement determinations and communicate with
students about them, and (8) conducted trial runs of the new processes to troubleshoot and avoid problems during actual implementation.
While these activities were demanding, every college was successful in overcoming barriers and developing the procedures needed to support the operation of the data analytics placement system for its students. Five colleges achieved this benchmark in time for placement of students entering in the fall of 2016, while the other two colleges did so in time for new student intake in the fall of 2017.
While many interviewees believed that the alternative system would place students more fairly and accurately, they also reported challenges and concerns. These issues largely involved: (1) undertaking such an extensive reform so quickly and establishing the buy-in to do so, (2) obtaining and entering large amounts of high school transcript data into the college’s computer system, (3) adjusting classroom and faculty assignments based on changed proportions of students in developmental and college-level courses, (4) not having placement information immediately available to students under the alternative system (in some cases, students had to wait a day or more to get their placement determinations), and (5) the potential limiting of access to support programs intended for underprepared (low-placing) students.
Cost Findings
We calculated costs for the five colleges participating in study intake for the fall 2016 cohort using the ingredients method (Levin, McEwan, Belfield, Bowden, & Shand, 2017). Costs are derived from the inputs used at each college, multiplied by standardized prices per input. Relative to the status quo system, new resources were required to create the algorithms, to set up and administer the collection of data used in the algorithms, and to run the alternative system at the time of placement testing. Across the five colleges, implementation of the alternative placement system added $603,550 — or $110 per student — to status quo fall-term costs for testing and placing students. The per-student net implementation costs ranged from $70 to $320 at the different colleges, with lower costs generally associated with higher numbers of students at each college. More enrollments lead to lower costs per student because the costs of creating the algorithms for the new system are mostly fixed; they do not vary with the number of students involved.
Ongoing costs in the subsequent fall term were much lower than the first-term implementation costs. Ongoing per-term costs were estimated at $215,300 — or $40 per student — above status quo costs. The per-student net ongoing costs ranged from $10 to $170 at the different colleges.
ES-5
When information on the outcomes of the alternative placement system is available, cost estimates can be used as part of a cost-effectiveness analysis. Findings from such an analysis will be included in the final report.
Placement Determinations of Program Group Students
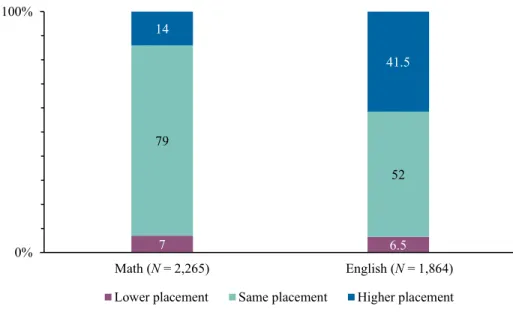
Because the multiple measures, data analytics placement system uses a different set of criteria than the status quo system, we might expect at least some changes in placement levels in math and English courses among program group students relative to what they would have been under the status quo. Importantly, however, any new placement procedure will not change the placement determinations of some students. Of the 2,455 students assigned to the program group, 92 percent took a placement test in math, and 76 percent took a placement test in English. Figure ES.1 shows how the placement determinations of such program students differed from what they would have been under the status quo. As expected, based on prior research, the proportion of higher placements outweighed the proportion of lower placements in both subject areas, particularly in English, where nearly half of program group students were placed differently than they would have been otherwise.
Figure ES.1
Observed Difference in Placement Relative to Status Quo Among Program Group Students Who Took a Placement Test in Each Subject Area
7 6.5 79 52 14 41.5 0% 100% Math (N = 2,265) English (N = 1,864) Lower placement Same placement Higher placement Math (N = 2,265) English (N = 1,864)
Early Impacts Findings
In this experimental study, incoming students who took a placement test were randomly assigned to be placed using either the multiple measures, data analytics system or the status quo system. This assignment method creates two groups of students — program group and control group students — who should, in expectation, be similar in all ways other than their form of placement. The overall sample for our analysis of first-term outcomes consists of 4,729 students who took a placement test at the five colleges at the time of fall 2016 entry, of whom 3,865, or about 82 percent, enrolled in at least one developmental or college-level course of any kind during the fall 2016 term. Because some students in the sample took either a math or an English placement test rather than both, the sample for our analysis of math outcomes is reduced to 4,371 students, and the sample for analysis of English outcomes is reduced to 3,533 students. We find that differences in student characteristics and in placement test scores between program and control group students are generally small and statistically insignificant, which provides reassurance that the randomized treatment procedures undertaken at the colleges were performed as intended.
Our analyses were conducted using ordinary least squares regression models in which we controlled for college fixed effects and student characteristics such as gender, race/ethnicity, age, and financial aid status as well as proxies for college preparedness.
For both math and English, we consider three outcomes as shown in Figure ES.2: the rate of college-level course placement (vs. remedial course placement) in the same subject area, the rate of college-level course enrollment in the same subject area, and the rate of college-level course completion with a grade of C or higher in the same subject area.
As is shown, assignment to the program group produced positive and statistically significant effects on all three outcomes in both math and English. The impacts in English were substantially larger than the impacts in math. In math, students in the program group were, on average, 3.1 percentage points more likely to enroll in and complete (with a grade of C or higher) a college-level math course during their first term, after controlling for the full set of covariates. In English, students in the program group were 12.5 percentage points more likely to enroll in and complete a college-level English course.
We also carried out analysis on the full sample to measure the effect that assignment to the program group had on earning college-level credits in any course or courses in the first term. Students in the program group earned, on average, 0.60 more college-level credits than students in the control group (p < .01; control group student students earned 5.17 credits, while program group students earned 5.77 credits).
ES-7 Figure ES.2
College-Level Course Outcomes in Math and English
*
***p < .01, **p < .05, *p < .10.
Finally, to examine whether program assignment led to differential first-term impacts by race/ethnicity (Black, Hispanic, White), Pell recipient status (yes, no), or gender (female, male), we conducted subgroup analyses and tested the significance of interaction effects for each subgroup. We limited these analyses to only those students who enrolled in any course at the college (because demographic information on students who did not enroll was unavailable), so the results of this analysis are not strictly causal. It is also worth noting that small sample sizes used in this first-term impacts analysis may limit the extent to which some subgroup effects are found to be statistically significant.
In math, we find that most subgroups benefitted from program group status in terms of college-level math placement, enrollment, and enrollment and completion (with a grade of C or higher) outcomes (p < .1); the exceptions are that we find no statistically significant treatment impacts for men across all math outcomes considered and also find no statistically significant impacts on math course completion for Black and White students.
Again in math, we find that interactions between the treatment status and each of the race/ethnicity and Pell recipient subgroups we considered are not statistically significant. This suggests that gaps in placement, enrollment, and completion rates in math between subgroups (other than the gender subgroups) may not have been affected by the treatment. We do find,
43.7 25.3 14.1 52.4 40.8 27.2 48.7 30.0 17.2 82.8 60.1 39.7 0% 100%
Placement Enrollment Enrollment and completion
Placement Enrollment Enrollment and completion Control group Program group
*** *** *** *** *** *** Math English
however, that while men had higher math outcomes than women in both the control and program groups, women benefitted more from program group status in math on all three outcomes considered. For example, the male–female gap in the rate of enrollment in and completion (with a grade of C or higher) of college-level math narrowed from 4.5 percentage points among control group students to 0.4 percentage points among program group students. (The male control group rate was 19.5 percent.)
In English, we find that all subgroups benefitted from program group status on all three outcomes considered (p < .01). Although significance testing on interaction effects in most cases failed to reveal differential impacts by subgroup, we do find evidence of differential treatment effects by racial/ethnic subgroup on two of the three considered outcomes. White students in the control group had higher English outcomes than Black and Hispanic students in the control group, but under program group status, the racial/ethnic gaps in both the rate of placement and the rate of enrollment in college-level English narrowed or even reversed. Yet we do not find evidence that program group status narrowed the gap in the rate of completion (with a grade of C or higher) of college-level English between White and Black or between White and Hispanic students.
Looking Ahead
These early results are broadly promising, but they are based on analyses of merely one semester of data. Additional impact analyses using data that are not yet available will be performed to further evaluate the effects of using a multiple measures, data analytics system to place incoming students. The final report from this study, to be released next year, will examine a range of student outcomes for all three cohorts for a period of three to five semesters after students’ initial entry into college at seven SUNY community colleges.
1 Chapter 1
Introduction
Placement testing has become a near-universal part of the enrollment experience for incoming community college students (Bailey, Jaggars, & Jenkins, 2015). For decades, higher education institutions of all kinds have assessed the college readiness of incoming students. Selective institutions use admissions requirements to screen students, accepting or rejecting them on the basis of test scores, high school transcripts, and other application information (Cohen, Brawer, & Kisker, 2014). Open-access institutions — which include community colleges and some four-year institutions — accept all or most students for admission but then make a determination about whether or not those students are immediately ready for college-level coursework. Students deemed not yet ready are encouraged or required to participate in remedial or developmental coursework before beginning college-level courses in those subject areas in which they are found to be academically underprepared.1
Colleges have traditionally used standardized placement tests to determine whether students should participate in remediation. Of community colleges surveyed by the National Assessment Governing Board in 2010, 100 percent reported using standardized tests for math placement purposes, and 94 percent reported using such tests for reading placement (Fields & Parsad, 2012). Among four-year institutions, 85 percent reported using standardized tests for math placement, and 51 percent reported using such tests for English placement (Fields & Parsad, 2012).
In recent years, however, questions have arisen about the efficacy of standardized placement tests as well as the utility of traditional developmental coursework. College practitioners and others are concerned about whether too many students are unnecessarily required to take developmental education courses before beginning college-level work. The courses require students to make a substantial investment of time and money, and many students who begin college by taking developmental coursework never complete a college credential. Indeed, research shows that the effects of traditional developmental courses are at best mixed (Bailey, 2009; Jaggars & Stacey, 2014).
Evidence also suggests that the use of placement tests alone is inadequate in determining which students need remediation (Belfield & Crosta, 2012; Scott-Clayton, 2012). Partly in response to these findings, colleges are increasingly turning to the use of
1Remedial courses are provided to students who are deemed not ready for college-level math or
English courses or for other courses that depend on college-level reading, writing, or numeracy skills. The terms developmental education and remedial education are used interchangeably in this report.
multiple measures for assessing and placing students (Rutschow & Mayer, 2018). Multiple measures placement systems often make use of placement test results but also consider other relevant data on incoming students, such as high school grade point average (GPA). While research indicates that using multiple measures, and in particular high school GPA, may result in the improved placement of students into developmental and college-level courses (Belfield & Crosta, 2012; Scott-Clayton, 2012), there is little evidence indicating that using a multiple measures placement system influences student outcomes.
To address this gap, the Center for the Analysis of Postsecondary Research (CAPR) initiated an experimental study of multiple measures placement in partnership with the State University of New York (SUNY) and seven of its 30 community colleges: Cayuga Community College, Jefferson Community College, Niagara Community College, Onondaga Community College, Rockland Community College, Schenectady Community College, and Westchester Community College. In each setting and for each subject area, math and English, a data analytics algorithm was developed — using the college’s own historical student data on a number of measures, such as placement test scores and high school GPA — to predict the likelihood of success in introductory college-level math and English courses. The alternative placement system, which incorporates the newly developed algorithm as well as cut points for placement chosen by the faculty, was then used to place incoming students into college-level or developmental courses in each subject area. Our study was designed to test whether students assessed using the alternative system (the program group) would be placed more accurately than students assessed using the status quo system (the control group) and, as a result, would be more likely to complete introductory college-level math and English courses, persist in college, and earn more college credits — key indicators of likely college credential completion.
The entire study involves three cohorts of students at the seven colleges, those who first entered the college intake process in the fall 2016, spring 2017, and fall 2017 terms.2
Outcomes for each of these cohorts — more than 13,000 students in the full sample — will be tracked through the fall 2018 term, resulting in the collection of three to five semesters of outcomes data depending on the cohort. The final report on this study will present findings on course placement, introductory college-level course completion, credits attempted and earned, and persistence. In this interim report, we describe our overall approach to the 2Assignment to program and control groups in the randomized controlled trial occurred just after
prospective students who began the college intake process were informed about the study, agreed to participate, and took a placement test. Some of these study participants (18 percent) did not enroll in any course at the college during the same term. For ease of exposition, we refer to all those who chose to participate in the study and took a placement test as “students.” We sometimes distinguish them from “enrolled students,” the somewhat smaller group of students who took a placement test and then enrolled in at least one course.
3
evaluation study and discuss how colleges implemented the new placement system, including how the data analytics algorithms for each college (one for math and one for English) were developed. In addition, we report on first-term impact findings for the first cohort of students (who entered the intake process at five of the seven colleges). Finally, we discuss the costs involved for these five colleges to set up and use a multiple measures placement system that employs a data analytics approach.
Our initial impact findings are promising. Among a sample of 4,729 students in the first cohort, a fifth of math program students and nearly half of English program students were placed differently than they would have been under the status quo placement system. Most of these students were placed higher than they would have been using placement tests alone. In their first semester of college, students in the math and English program groups were 3.1 and 12.5 percentage points more likely than control group students to enroll in and pass a college-level course in math or English, respectively.3 We emphasize that these initial
findings are based solely on first-term outcomes of the first cohort. The final report on this study, which will present longer term evidence on these and other outcomes for all three cohorts, will be released in 2019.
Background and Context
Developmental Education
Developmental education is a significant component of public higher education, both in terms of student enrollments and in terms of costs. Among 2003–04 beginning postsecondary students, 40 percent of those starting at public four-year institutions and 68 percent of those starting at public two-year institutions took at least one remedial course during their enrollment between 2003 and 2009 (Chen, 2016).
The primary purpose of developmental education is to equip academically underprepared students with the skills they need to succeed in college-level coursework. In addition, by restricting access to college-level courses to students who meet certain academic standards, developmental education requirements may serve the secondary purpose of protecting the academic rigor of college-level courses (Bettinger & Long, 2005).
Studies employing quasi-experimental methods have been used to isolate the causal effect of developmental education on student outcomes. The results of these studies vary. Bettinger and Long (2005), for example, used instrumental variables to study developmental
3The rates for control and program math group students were 14.1 percent and 17.2 percent. The
education in Ohio’s community colleges and found that remedial education had positive effects on college persistence and bachelor’s degree completion. Martorell and McFarlin (2011), on the other hand, used longitudinal data from Texas and a regression discontinuity design and found that remedial education had little to no effect on the likelihood of earning a college degree or on subsequent earnings.
Jaggars and Stacey (2014) reviewed findings from eight studies that evaluated the effectiveness of community college remedial courses across six large systems or states, all but one of which used a regression discontinuity approach. These combined studies showed that, with some exceptions, developmental education had mostly null and sometimes negative impacts on outcomes (such as persistence, passing associated college-level courses, grades in college-level courses, credits and credentials earned) for students near the placement score cutoffs. They also showed that students placed into lower levels of developmental education had a higher proportion of positive effects (five positive vs. six negative and 19 null) than students placed in developmental courses who were near the college-level cutoffs (two positive vs. 15 negative and 32 null), suggesting that developmental education may have differential effects on students depending on their level of academic preparation.
The overall body of research on the efficacy of developmental education suggests that, at best, it does not hurt students, but at worst, it may decrease the likelihood among at least some students of attaining their postsecondary education goals (Bailey et al., 2015; Bailey, Jeong, & Cho, 2010; Boatman & Long, 2010; Calcagno & Long, 2008; Crisp & Delgado, 2014; Melguizo, Bos, Ngo, Mills, & Prather, 2016; Scott-Clayton & Rodriguez, 2015). Developmental education serves to extend time in college, and long remedial sequences can consume students’ financial aid as well as their own resources. These consequences can demotivate students, making them less likely to complete their programs of study (Bailey, 2009; Crisp & Delgado, 2014; Scott-Clayton & Rodriguez, 2015). In fact, only 28 percent of community college students who take a remedial course go on to earn a degree within eight years, compared with 43 percent of nonremedial students (Attewell, Lavin, Domina, & Levey, 2006).
The cost of remedial education is high; estimates of the costs to deliver remedial courses range from $1.4 billion to nearly $7 billion annually (Long & Boatman, 2013; Scott-Clayton, Crosta, & Belfield, 2014). These costs fall directly on students placed into remedial courses and indirectly on taxpayers, whose money helps subsidize public postsecondary institutions that offer remedial education. As a result, there is both a private benefit and a social benefit to ensuring that developmental education is effective, expedient, and offered to those most likely to benefit from it.
5
Standardized Placement Test Accuracy
Placement into remedial or college-level courses at most colleges is based on scores on a single set of standardized placement tests — most often the ACCUPLACER — in math, reading, and writing. These tests do not always assess student skills accurately, and colleges that use them may place students into developmental education courses unnecessarily (Fulton, 2012). Placement test scores are not highly correlated with success in initial college-level courses: Doing poorly on a placement test does not reliably indicate that a student would be unsuccessful in a college-level course. As a result, using test scores for placement leads to placement errors for large numbers of incoming students (Bailey et al., 2015; Belfield & Crosta, 2012; Hodara & Cox, 2016; Scott-Clayton et al., 2014).
Scott-Clayton (2012) identified large predicted “severe error rates” associated with placing students using standardized placement tests alone. A severe error rate refers to placing students in remediation who would be expected to receive a grade of B or better in college-level courses (underplacement) or placing students in college-college-level courses who would be expected to fail (overplacement). While both types of errors should be mitigated, Scott-Clayton’s research suggests that the occurrence of underplacement far exceeds the occurrence of overplacement. Using student data from a large urban community system, she found predicted severe overplacement rates of about 6 and 5 percent in math and English but severe underplacement rates of about 18 and 29 percent in the respective subject areas. Scott-Clayton further established that these severe error rates could be reduced by employing multiple measures for placement. In particular, the high school GPA was found to be a strong predictor of success in college-level courses.
Approaches to Multiple Measures Placement
Varied measures, used alone or in combination, can be employed to place students into developmental and college-level courses. In addition to standardized placement test scores, some measures that are in current use are GPAs and other information from high school transcripts, scores on writing assessments, noncognitive tests measuring psychosocial characteristics, and student self-assessments. Varying levels of evidence support the use of each of these measures, with some more thoroughly studied than others (Barnett & Reddy, 2017).
An increasing number of colleges are exploring or beginning to use multiple measures in placement decisions. In a survey conducted in 2016, 57 and 51 percent of community colleges reported using multiple measures for placement in math and English, whereas only 27 and 19 percent reported having done so in 2011 (Rutschow & Mayer, 2018). Colleges using multiple measures have employed a variety of methods to combine particular measures in order to place students more accurately. The simplest of these is a waiver system, in which one or more criteria can be used to exempt students from developmental education
requirements. Another method involves the use of decision bands; students with placement test scores within a certain range are further evaluated using measures such as high school GPA or the score on a noncognitive test to further determine placement. Alternatively, historical student performance data from a college can be analyzed to weight various measures of student assessment and achievement in a way that best predicts future outcomes, the method used in the current research. Algorithms reflecting these weights, along with chosen cut points, can then be used to place students (Barnett & Reddy, 2017).
To be useful in real-world settings, placement instruments and methods must balance accuracy with cost-efficiency. For example, scored personal essays and in-person advising meetings that leverage faculty experience can improve the accuracy of placement and increase success rates for students (Duffy, Schott, Beaver, & Park, 2014). However, undertaking these activities is much more resource-intensive than using traditional placement tests, which are largely automated and more easily scaled (Hodara, Jaggars, & Karp, 2012).
Effectiveness of Multiple Measures Placement
Studies show that multiple measures placement methods that incorporate high school information, and in particular high school GPA, can significantly improve placement at a relatively low cost (Hodara et al., 2012; Belfield & Crosta, 2012).4 Studies by Scott-Clayton
(2012) and Belfield and Crosta (2012) found that high school GPA can help predict college performance and could be used to place students more accurately than scores on placement tests alone. Both studies suggest that an optimal placement strategy would take into account both high school transcript data and placement test scores.
Results from a small randomized experiment at a Midwestern community college (Marwick, 2004) showed that students placed using either one of two multiple measures approaches were more likely to take and succeed in higher level math courses than were students placed using standardized test scores alone. One method incorporated placement test scores and performance in high school math; the other method involved an advisor-mediated student choice scenario in which test scores, high school preparation, and other factors were discussed in an advising session. While this study was very small, the results suggested that further evaluation of multiple measures placement is warranted.
Statewide changes in placement policies are allowing for broader examinations of alternative placement methods. North Carolina instituted a statewide reform that began in 2013 and was required to be used by all colleges by fall 2016. The policy exempts students 4Belfield and Crosta (2012) found that including additional information from the high school
transcript (e.g., the number of courses taken in math or English, or the total number of high school credits) to predictive models that already included high school GPA contributed little to no additional value.
7
from remediation based on certain criteria. For example, students who graduated from high school within five years with a GPA of 2.6 or above are exempted from remediation. If the GPA threshold is not met, colleges also grant exemptions based on SAT or ACT scores. Only those students who do not meet the GPA or SAT/ACT requirement must take a placement test (Dadgar, Collins, & Schaefer, 2015).
In California, the 2017 passage of Assembly Bill 705 called for all community colleges in the state to modify their placement practices so that high school data is used as a primary measure of college readiness by spring 2019. While system-wide changes are underway, individual community colleges have already begun to implement multiple measures placement systems. Before passage of the bill, Long Beach City College developed an algorithm that uses student high school achievement in addition to standardized placement test scores to assess students. The algorithm weights each measure on the extent to which it predicts student performance in college courses (Long Beach City College, Office of Institutional Effectiveness, 2013). Using the multiple measures algorithm increased student placement into college-level courses from 15 to 60 percent in English and from 10 to 50 percent in math, with no significant change in student success rates (Dadgar, et al., 2015). Many other California colleges are now implementing versions of this approach, which is similar to the one undertaken in the current project.
About CAPR
Established in 2014, the Center for the Analysis of Postsecondary Readiness (CAPR) is a partnership of research scholars supported by the Institute of Education Sciences, U.S. Department of Education, and led by the Community College Research Center (CCRC) at Teachers College, Columbia University, and MDRC, a nonprofit research and development organization. In addition to the study described here, CAPR is conducting two additional major studies, one based largely on a nationally representative survey that aims to provide a comprehensive understanding of the landscape of developmental education and reform in two- and four-year colleges across the country, and one that evaluates an alternative model of developmental math programming that shortens students’ time in remediation, tailors content to students’ academic paths, and uses student-centered instruction. CAPR also carries out leadership and outreach activities aimed at improving college readiness.
9 Chapter 2
Placement System and Study Design
The current study uses a randomized controlled trial to compare the effects on student outcomes of placing students into developmental or college-level courses with either a multiple measures, data analytics placement system or a status quo system that uses just one measure, placement test scores. In order to carry out this evaluation, an alternative placement system had to be created and implemented, and random assignment procedures had to be established. Researchers and personnel at each college collaborated in these activities. We describe the approach used as well as the broader study design in this chapter.
There are five research questions guiding the study:
1. How is a multiple measures, data analytics placement system implemented, taking into account different college contexts? What conditions facilitate or hinder its implementation?
2. What effect does using this alternative placement system have on students’ placements?
3. With respect to academic outcomes, what are the effects of placing students into courses using the alternative system compared with traditional procedures?
4. Do these effects vary across different subpopulations of students or by college?
5. What are the costs associated with using the alternative placement system? Is it cost-effective?
To answer Question 1, we conducted two rounds of implementation site visits to each of the seven colleges; we spoke with key personnel, including administrators, staff, and faculty. To answer Questions 2 through 4, this study tracks eligible students who first began the intake process at a participating college in the fall 2016, spring 2017, or fall 2017 term through the fall 2018 term. These students were randomly assigned to either the program group or the control group. The study design calls for impact analyses to be performed twice — once early in the study, following the end of the first cohort’s first semester, and again for all three cohorts following the conclusion of the study’s tracking period.
For the first set of analyses, which are presented in this report, student data were collected in early 2017 from the five colleges that began participation in the study in fall 2016, as well as from the SUNY central institutional research unit. Student outcomes data for
all three cohorts will be collected from the colleges and SUNY during the spring of 2019 for the second and final set of analyses, which will allow researchers to observe students’ outcomes (see Appendix Table A.1) for three to five semesters following placement, depending on the cohort.
To answer Question 5, we are carrying out a cost-effectiveness analysis that will incorporate data collected at the end of the project in spring 2019. Chapter 5 of the current report presents a cost-only analysis on the five colleges that began enrolling participating students in fall 2016. The current report also presents implementation findings (Chapter 3) and early impacts findings on the first cohort of students (Chapter 4). The final report on the results of this study will be released in 2019.
Site Descriptions
Seven SUNY colleges are participating in this study. Many had a prior interest in assessing the effectiveness of their existing placement system before they got involved, while others saw participation as an opportunity to improve knowledge and practices in student placement. The colleges are diverse in terms of size and population served (see Appendix Table A.2). While the smallest of the colleges serves roughly 5,500 students, the largest serves over 22,000 students annually. As is common in community college settings, a large portion of students at the colleges attend part-time, and many are adult learners, with between 21 and 30 percent of students over the age of 25. Most of the colleges serve large numbers of students who receive financial aid — more than 90 percent of students receive financial aid at five of the seven colleges. The colleges have transfer-out rates of between 18 and 22 percent; their three-year graduation rates are between 15 and 29 percent.
All of the colleges have an open-door admissions policy, meaning that they do not have entry requirements for incoming students beyond having graduated from high school or earned a GED. The colleges tend to serve local student populations, and most have relationships with their region’s high schools both for offering dual enrollment programs and to facilitate the admissions process from high school to college. Each college has a small population of students who live on campus or who moved to attend the college.
The colleges offer a wide selection of programs of study, including a few that particular colleges have developed and gained a strong reputation for, such as nursing, electronic communications, culinary, and music programs. Further, each college has varying on-campus initiatives that reflect the goals and priorities of the college. For example, one college has made a big push to increase the diversity of its faculty to better match the student population it serves. Another college has established an academic success center and has taken part in the START-UP NY program to foster private/public partnerships. And
11
especially germane to this study, one college has designed programs called Prep for Success and Math Boosters to help students brush up on their skills and then retest if they are not initially placed in college-level courses.
Creating a Data Analytics Placement System
Given the differences among the colleges, such as the different student populations they draw from, the data analytics algorithms employed to assess program group students were created for each college individually, using historical data on previous students at each college. The resulting algorithms and historical data also allowed us to estimate historical misplacement rates at each college (see Box 2.1). After the math and English algorithms were developed, faculty at each college chose cut points on the range of scores for each algorithm that were then used to place program group students into developmental or college-level math and English.5
Using Historical Data to Develop Algorithms
Historical high school and placement test data were needed to create predictive algorithms at each college. Five colleges in the study had been using ACCUPLACER tests for several years. A sixth college had been using ACCUPLACER tests for English but had transitioned from a homegrown math assessment to the ACCUPLACER set of math tests more recently; this college is therefore testing the use of the alternative placement system for English placement only in this study. The seventh college in our sample had been using COMPASS tests, standardized placement tests which were discontinued by the provider (ACT) shortly after this study began. This college is also testing the use of the alternative system for English placement only. At this college, the predictive algorithm that is being tested in the alternative placement system does not make use of any placement test scores; rather, it is based only on high school GPA and other high school data. The status quo placement system in this case uses only scores from ACCUPLACER, the test that the college selected to replace the COMPASS.
CAPR researchers worked with the appropriate personnel at each college as well as SUNY’s central institutional research unit to obtain historical data on students who first enrolled during the 2011–12, 2012–13, and 2013–14 academic years. Data on multiple measures, such as high school performance and placement test scores, as well as data on outcomes in college-level courses were used to create algorithms for predicting student
5The colleges often used multiple cut points on the range of each algorithm’s student scores to
place students into different levels of developmental coursework and different levels of college-level coursework in math and English. For this study, however, we are considering only two placement alternatives: developmental versus college-level placement.
performance in college-level math and English among students in the study sample. In some instances, data on these measures were available in college systems, stored in digital format. Other colleges maintained records of high school transcripts as digital images; in these cases, the needed data had to be entered into computer systems by hand.
In order to estimate the relationships between the measures, or “predictors,” in the dataset and performance in an initial college-level course, the historical data used for analyses were restricted to students who took placement tests and enrolled in a college-level course without first having taken a developmental course. This set of students constituted our estimation sample. We then regressed success in a college-level course on various sets of predictors using a linear probability model.6 (Alternative models are described by Hastie,
Tibshirani, and Friedman [2009], but more intricate models we tested yielded similar results.) For each of the colleges, we began by creating a model for estimating the relationship between high school GPA and success (defined as earning a grade of C or higher) in an initial college-level course in a given subject, math or English (see Equation 1 below). We then estimated the relationship between placement test scores and success in these initial college-level courses (Equation 2). A third model included both high school GPA and placement test scores for the appropriate subject (Equation 3). A fourth model added additional information where such information was available (Equation 4). Added variables include the number of years that had passed since high school completion and whether the student’s diploma was a standard high school diploma or a GED, SAT scores, ACT scores, and scores on the New York State Regents Exams where they were available (see Appendix Tables A.3 and A.4), as well as interaction terms and nonlinear terms for certain variables. Identical procedures were followed for both math and English.
(1) Pr(𝐶𝐶𝑜𝑜𝑜𝑜𝐵𝐵𝐵𝐵𝐵𝐵𝐵𝐵𝐵𝐵𝑜𝑜) =α+ (𝐻𝐻𝐻𝐻𝐺𝐺𝐺𝐺𝐺𝐺)β1+ε
(2) Pr(𝐶𝐶𝑜𝑜𝑜𝑜𝐵𝐵𝐵𝐵𝐵𝐵𝐵𝐵𝐵𝐵𝑜𝑜) =α+ (𝐺𝐺𝐶𝐶𝐶𝐶𝐴𝐴𝐺𝐺𝐴𝐴𝐺𝐺𝐶𝐶𝐴𝐴𝐴𝐴)β1+ε
(3) Pr(𝐶𝐶𝑜𝑜𝑜𝑜𝐵𝐵𝐵𝐵𝐵𝐵𝐵𝐵𝐵𝐵𝑜𝑜) =α+ (𝐻𝐻𝐻𝐻𝐺𝐺𝐺𝐺𝐺𝐺)β1+ (𝐺𝐺𝐶𝐶𝐶𝐶𝐴𝐴𝐺𝐺𝐴𝐴𝐺𝐺𝐶𝐶𝐴𝐴𝐴𝐴)β2+ε
(4) Pr(𝐶𝐶𝑜𝑜𝑜𝑜𝐵𝐵𝐵𝐵𝐵𝐵𝐵𝐵𝐵𝐵𝑜𝑜) =α+ (𝐻𝐻𝐻𝐻𝐺𝐺𝐺𝐺𝐺𝐺)β1+ (𝐺𝐺𝐶𝐶𝐶𝐶𝐴𝐴𝐺𝐺𝐴𝐴𝐺𝐺𝐶𝐶𝐴𝐴𝐴𝐴)β2+ Xβ3+ε
6Each variable in the model was accompanied by a corresponding missing indicator. Missing
indicators were entered into the model equations as 1 if a student was missing that data point and zero if the student had a value for that data point.
13
While researchers may look at the individual covariates in a traditional study, the focus of this analysis is the overall predictive power of each model. We therefore used the Akaike Information Criterion (AIC) to compare the models. The AIC is a measure of model fit that combines a model’s log-likelihood with the number of parameters included in a model (Akaike, 1998; Burnham & Anderson, 2002; Mazerolle, 2004). When comparing models, a lower AIC statistic indicates a better fitting model (Mazerolle, 2004). The best fitting model was the one selected for use at each college in the study. Appendix Tables A.3 and A.4 list the full set of variables used in each college’s algorithm for math and English.
Estimation of Historical Misplacement Rates at Each College
The data analytics algorithm that was created for each college (in each subject area) also allowed us to compute historical underplacement and overplacement rates for math and English. We define an underplaced student as one placed into a developmental course who could have succeeded in an initial college-level course in the same subject area by earning a grade of C or higher.7 In conducting analysis on underplacement, a student’s probability of
succeeding in the college-level course is calculated using the parameters estimated by each college’s best fitting model. We define an overplaced student as one unable to pass a college-level course who was nonetheless placed into such a course. Importantly, this is not simply the inverse of passing with a C or higher, since a D is not considered a failing grade. Nonetheless, the model for overplacement uses the same set of predictors selected in modeling underplacement. For example, if Equation 4 from above is selected as a college’s best fitting model, then each student’s likelihood of failing the initial college-level course is calculated using the following equation:
(5) Pr(𝐹𝐹𝐹𝐹𝐹𝐹𝐹𝐹) =α+ (𝐻𝐻𝐻𝐻𝐺𝐺𝐺𝐺𝐺𝐺)β1+ (𝐺𝐺𝐶𝐶𝐶𝐶𝐴𝐴𝐺𝐺𝐴𝐴𝐺𝐺𝐶𝐶𝐴𝐴𝐴𝐴)β2+𝑋𝑋β3+ε
The overplacement and underplacement rates for each college are simply averages of these individual probabilities. In keeping with techniques introduced by Scott-Clayton (2012), we sum the overplacement rate and the underplacement rate to generate a total error rate.
Appendix Table A.5 shows the mean estimated underplacement, overplacement, and total error rates for each of the five colleges. The results indicate that placement accuracy is an issue in both math and English for the five colleges in this phase of the study. The
7Scott-Clayton (2012), Belfield and Crosta (2012), and Scott-Clayton et al. (2014) used a passing
grade of B or better as the outcome of interest, arguing that this higher threshold ensures that only those who are “severely” underplaced will be identified by the model. Given our threshold of a grade of C or better, we distinguish our error rates from the rates generated in those prior studies.
proportion of misplaced students ranged from 32 to 50 percent in math and from 43 to 52 percent in English. The error rates were higher in English than in math at three colleges, and very similar to one another at one college. A fifth college had higher error rates in math than in English.
Prior research on first-time entrants in a large urban community college system (Scott-Clayton, 2012) suggests that underplacement is typically a larger problem than overplacement. Our results on historical misplacement at these five colleges are consistent with these findings. With one exception (math misplacement rates at one college), rates of underplacement were higher than rates of overplacement for both math and English at each of the colleges, and in most cases much higher.
Choosing Cut Points for Projected Placement and Pass Rates
After data analytics algorithms were established at each college, we used the coefficients from the regressions to simulate placement and success rates as a basis for faculty decisions on where to establish cut points that distinguish students ready for college-level courses from those needing remediation. Consider the following simplified example using Equation 3 from above. Let Y represent the predicted probability of success in a college-level course. We can use regression coefficients and a student’s own placement test scores and high school GPA to predict the probability of earning a C or better in college-level math (𝑌𝑌�) for any new student i. A set of decision rules can then be determined based on these predicted probabilities. If the college has one level of developmental math placement and one college-level course placement, the decision rule may be:
𝐺𝐺𝐹𝐹𝐹𝐹𝑃𝑃𝐵𝐵𝑃𝑃𝐵𝐵𝑃𝑃𝐵𝐵i =�Developmental if College level if 𝑌𝑌�i𝑌𝑌�≥0.6 i < 0.6
For each college, we generated spreadsheets projecting the share of students that would place into a college-level course at any given cut point on Y, as well as the share of those students we would anticipate earning a C or better in that course. These spreadsheets were given to colleges so that faculty in the relevant departments could set cut points for students taking math or English courses.
Table 2.1 shows a hypothetical example of one such spreadsheet provided to colleges. The top panel shows projected math placement statistics, and the bottom panel shows projected placement statistics for English. The first column shows the cut point, or the minimum allowable probability of success for students, that produces the projected share of college-level placements (second column) and pass rates (conditional on college-level
15
placement; third column). The top, highlighted row in each panel shows the historical placement and pass rates at the college.
As an example, the historical placement rate for math in the table is 30 percent. The third column shows the pass rate, based on the receipt of a grade of C or higher, in the initial (gatekeeper) college-level course. The historical pass rate for math in this example is 50 percent, conditional on placement into the college-level math course.
Table 2.1
Hypothetical Spreadsheet on Projected College-Level Placement and Completion Rates (With Grade C or Higher) at Given Cut Points
Math Success Cut Point
(Minimum Probability
of Success) Into College-Level Course Percent Who Will Place
Percent Who Will Pass College-Level Course With Grade C or Higher
Historical 30% 50% 45% 40% 60% 55% 20% 70% 65% 10% 75% English Success Cut Point (Minimum Probability
of Success) Into College-Level Course Percent Who Will Place
Percent Who Will Pass College-Level Course With Grade C or Higher
Historical 40% 60%
45% 75% 60%
55% 60% 65%
65% 20% 70%
Below each highlighted row is shown what would happen to placement and pass rates at different cut points chosen for scores on the algorithm. For math, the first cut point shown is 45 percent, which means that to be placed into college-level math under the algorithm, a student must have a predicted probability of receiving a C or higher in the gatekeeper math course of at least 45 percent. If this 45 percent cut point were used, Columns 2 and 3 show what share of students would be placed into college-level math under the algorithm (Column 2) and what share are projected to pass this course conditional on placement (Column 3). In
this example, for math, if the 45 percent cut point were used, the algorithm would place 40 percent of students into college-level math, and 60 percent of those students would be projected to pass the course with a C or higher. The cut point differs from the projected pass rate. The cut point represents the lowest probability of passing for any given student; the cut point implies that every student must have that probability of passing or higher.8
Many faculty opted to create placement rules that either (1) kept pass rates in college-level courses similar to historical pass rates or (2) kept college-college-level placement rates similar to historical placement rates. Under the first approach, the algorithm tended to predict increases in the number of students placed into college-level coursework. For instance, in the example shown in Table 2.1, the historical pass rate for college-level English is 60 percent. A cut point of 45 percent would induce the same pass rate, 60 percent, but would place 75 percent of students into the college-level English course.
Implementing the Alternative Placement System
Colleges in the study had two options for implementing the data analytics placement system. At colleges running the system through ACCUPLACER, researchers programmed custom rules into the ACCUPLACER software for students selected to be part of the program group. The rules specified the ACCUPLACER placement determination for every combination of multiple measure values used in the algorithm, which were accessed from a pre-registration file created and uploaded with data for each incoming student.
Other colleges conducted their placement through MDRC’s custom-built server and therefore did not need to create a pre-registration file. Instead, student information was sent to MDRC servers in one of two ways. Either all information was uploaded together and a placement decision was returned for each student, or students’ supplemental information was uploaded in batches and test scores were uploaded individually by counselors after students completed their testing. The values of the uploaded multiple measures and test scores were then multiplied by their respective algorithm weights and summed to generate the predicted probability of success and the corresponding placement, which was returned to the college.
8For instance, if the cut point were 40 percent, then every student placed into the college-level
course would need to have a 40 percent chance or greater of passing the college-level course — most students would have above a 40 percent chance. This means we should expect the projected pass rate to be higher than the cut point. If higher cut points are used — meaning that students must have higher probabilities of passing in order to be placed into the college-level course — then the share placed into the college-level course declines but the anticipated pass rate increases because the standard for placement becomes more challenging.