Scholar Commons
Graduate Theses and Dissertations Graduate School
11-7-2005
Safety Effects of Left Turn Overflow at Signalized
Intersections
Isaac Kwamena Sankah University of South Florida
Follow this and additional works at:https://scholarcommons.usf.edu/etd
Part of theAmerican Studies Commons
This Thesis is brought to you for free and open access by the Graduate School at Scholar Commons. It has been accepted for inclusion in Graduate Theses and Dissertations by an authorized administrator of Scholar Commons. For more information, please contactscholarcommons@usf.edu. Scholar Commons Citation
Sankah, Isaac Kwamena, "Safety Effects of Left Turn Overflow at Signalized Intersections" (2005).Graduate Theses and Dissertations. https://scholarcommons.usf.edu/etd/845
Safety Effects of Left Turn Overflow at Signalized Intersections
by
Isaac Kwamena Sankah
A thesis submitted in partial fulfillment of the requirements for the degree of Master of Science in Civil Engineering Department of Civil and Environmental Enginerring
College of Engineering University of South Florida
Co-Major Professor: John Lu, Ph.D. Co-Major Professor: Larry Hagen, M.S.C.E.
Huaguo Zhou, Ph.D.
Date of Approval: November 7, 2005
Keywords: Crash Rate, Crash Data, Intersection Approach, Operations, Crossroad © Copyright 2005, Isaac Kwamena Sankah
Dedication
I dedicate this work to the entire Sankah family especially my father and mother, Mr. & Mrs. Sankah of Ghana, West Africa. This academic journey has been a rather long one but worth taking by their teachings in my upbringing.
Acknowledgements
My co-major professor, Mr. Larry Hagen has been my guardian and pillar for my
education at the University of South Florida and also the opportunity given to me to work at the Center for Urban Transportation Research.
I will like to express my sincere gratitude to Dr. Huaguo Zhou and my co-major professor, Dr. Lu have for the research idea and also further directions for this thesis.
Finally I will like to thank everybody in the Center for Urban Transportation Research for giving me an enabling atmosphere to develop as a professional.
Table of Contents
List of Tables ... iii
List of Figures ... iv
Abstract ... v
Chapter 1 Introduction ... 1
Intersection Safety Problem ... 1
Signalized Intersection Left Turn Overflow Scenario... 1
Research Statement ... 6
Research Objectives ... 6
Chapter 2 Literature Review... 8
Intersection Research ... 8
Chapter 3 Methodology ... 18
Selection of Intersections ... 18
Identification of Study Signalized Intersections ... 18
Rush Periods... 19
Crash Pattern Analysis ... 20
Crash Rate ... 21
Paired t-test... 22
Criteria for t-test ... 23
Assumptions ... 24
Chapter 4 Data Collection... 26
Geometric Data ... 26
Crash Data ... 27
Locating Mile Posts Along An Approach ... 29
Chapter 5 Data Analysis ... 31
Intersection Sections for Analysis... 31
Attributes of Crash Data... 32
Organization of Data Analysis ... 32
Chapter 6 Findings... 41
Chapter 7 Conclusions and Recommendations... 48
Conclusions ... 48
Recommendations ... 49
References... 51
Appendices... 53
Appendix A: Geometric Information ... 54
Appendix B: Injury Crash Rate ... 56
Appendix C: Crash Rates ... 58
Appendix D: Crash by Type and Day of Week... 61
Appendix E Annual Average Daily Traffic for Study Period ... 63
List of Tables
Table 1 Total Number of Crashes for Fault Vehicles ... 33
Table 2 First Harmful Event of Fault Driver ... 33
Table 3 Crashes by Day of Week ... 34
Table 4 Crashes by Rush Period ... 34
Table 5 Crash Rate Per Million Vehicles Per Mile for Study Intersections ... 40
Table 6 Statistical Results of Rush Period Crash Rate for All Signalized Intersections .. 41
Table 7 Rush Period Crash Rate ... 42
Table 8 Statistical Results for RushPeriod Crash Rates of Study Intersections ... 43
Table 9 Statistical Results for Crash Rates of Study Intersections (4-leg only)... 45
Table 10 Statistical Results for Crash Rates of Study Intersection ... 45
Table 11 Statistics for Crash Rate For 50’ Off Center Line of Cross Road ... 46
Table 12 Statistical Results for Crash Rate for 0’ Off Center Line of Cross Road ... 47
Table 13 Geometric Information………...54
Table 14 Injury Crash Rate………56
Table 15 Crash Rates ... 58
Table 16 Crash by Type and Day of Week... 61
List of Figures
Figure 1 Left Turn Lane Overflow ... 5
Figure 2 A Typical 4-Leg Signalized Intersection... 20
Figure 3 A Typical 4-Leg Signalized Intersection... 28
Figure 4 Crashes by Day of Week for All Signalized Intersections ... 36
Figure 5 Type of Crash for All Signalized Intersections ... 37
Safety Effects of Left Turn Lane Overflow at Signalized Intersections
Isaac Kwamena Sankah
ABSTRACT
Signalized Intersections on the State Roads in Hillsborough and Pinellas County, Florida with observed left turn lane overflow (spill) were selected for a safety and operational study. The study analyzed the crash data for safety hazards that the situation presents. Crashes within 100 feet from the center line of the crossroad of intersections under study to distances 200 feet beyond the end of the turn lane were chosen for the analysis. Left turn overflow is the situation at the approach of an intersection where left turning vehicles back up from the turn lane into the through traffic lane.
Crashes within the intersection legs with the left turn lane overflow problems resulted in more crashes than the intersection legs without the spill problem at 95 percent confidence level. However the result was not overwhelming when 3 leg intersections are combined with 4 leg intersections. The rush periods within the leg of the intersection where left turn overflow occurred did not seem to have any correlation at all using paired t test.
Chapter 1 Introduction
Intersection Safety Problem
The intersection is a critical area in a traffic stream. This is because of the many conflict points present. Vehicle speed differential for turning vehicles and through movement vehicles are high, while vehicles cross the path of other vehicles under signalized or unsignalized traffic control.
Each year more than 2.7 million intersection crashes occur representing over 45% of all reported crashes. In 2003, over 9,213 fatalities occurred as a result of intersection-related crashes.1 Intersections present great challenges to pedestrians and drivers.
The National Intersection Safety Workshop held in Milwaukee, WI; November 14-16, 2001 was a major step in identifying intersection safety problems and identifying strategies to address them by various stakeholders in transportation.
Signalized Intersection Left Turn Overflow Scenario
Intersections may be stop controlled, that is unsignalized, or signalized.
Unsignalized Intersections may become signalized as traffic volumes, pedestrian volumes and crash history permits by using the procedures established by the Manual for Uniform Traffic Control Devices (MUTCD). The MUTCD details eight warrants for traffic signal
installation. Among the warrants is the crash experience of the unsignalized intersection.2 The MUTCD warrants for signalizing an intersection are as follows:
a. Warrant 1 - Eight-Hour Vehicular Volume
This warrant is intended for application where a large volume of intersecting traffic is the principal reason for consideration of signal installation. This warrant applies to operating conditions where the traffic volume on a major street is so heavy that traffic on a minor intersecting street suffers excessive delay or hazard in entering a major street. Minimum volumes are given for each of any 8 hours of an average day.
b. Warrant 2 - Four-Hour Vehicular Volume
This warrant is satisfied when each of any 4 hours of an average day are above a certain volume combination for the major and minor streets.
c. Warrant 3 - Peak Hour Vehicular Volumes
This warrant is intended for application when traffic conditions are such that for a minimum of one hour of an average day, minor street traffic suffers undue traffic delay in entering or crossing the major street.
d. Warrant 4 - Pedestrian Volume
This warrant states that a traffic signal may be installed where the pedestrian volume crossing the major street at a location during an average day is:
100 or more per hour for each of any 4 hours or 190 or more during any one hour and there shall be less than 60 adequate gaps per hour in the traffic stream.
e. Warrant 5 - School Crossing
This warrant states a traffic signal may be installed at an established school crossing where the number of adequate gaps in the traffic stream is less than one per minute in the period when children are using the crossing and there are a minimum of 20 students crossing during the highest crossing hour.
f. Warrant 6 - Coordinated Signal System
This warrant specifies conditions where a traffic signal may be warranted in order to maintain proper platooning of vehicles.
g. Warrant 7 - Accident Experience
This warrant is satisfied when an adequate trial of less restrictive remedies has failed to reduce the crash frequency of five or more reported crashes of types susceptible to correction by traffic signal control and minimum vehicle and pedestrian volumes are present.
h. Warrant 8 - Roadway Network
This warrant specifies conditions where a traffic signal may be justified to encourage concentration and organization of traffic flow.
This study is concentrated on signalized intersections in Hillsborough and Pinellas Counties, Florida (an urban setting) along the state roads. The roads under consideration all fall under the control of Florida Department of Transportation District 7, head
quartered in Tampa.
Left turn lane length consists of three components; namely entering taper, deceleration length and storage length. When the turn lane is well designed and long
enough, the safety benefits are enormous. However, when the turn lane is of inadequate width to handle the left-turn demand, the left turn queue will spill out of the left turn bay. Through vehicles are thus forced to stop or change lanes when the left turn queue extends into the adjacent through lane.
Left turn lane overflow occurs when the left turning lane capacity of an intersection approach is full. Left turning vehicles begin to queue in the through lane approaching the left turn lane. Through vehicles at the signalized intersection are blocked in this lane by left turning vehicles waiting in the through lane. Figure 1 illustrates this situation for an approach of an intersection with one left turn lane and 2 through lanes. There are a number of different scenarios by way of number of left turn lanes and number of through lanes at the signalized intersections, however the problem is similar in all.
This situation as depicted in figure 1on the next page, brings about a number of safety and operational challenges to vehicles and drivers and the overall operation of the intersection. The timing of the left turn phase of the intersection may be insufficient. The left turn lane may also not be long enough to accommodate adequately the left turn volumes of the intersection during the rush periods.
Figure 1 Left Turn Lane Overflow
Some of the challenges that left turn overflow at signalized intersection presents are influenced by the duration of queue back up into through lanes, through traffic volume, number of through and turning lanes, signal timing and turn volumes .
Forty one signalized intersections, 24 from Hillsborough County and 17 from Pinellas County were considered. In Hillsborough County, only 12 of the signalized intersections were observed to have left turn overflow problems during the morning and afternoon rush periods with Pinellas County having 7 intersections.
Research Statement
This research seeks to know the nature of crashes at the approach of an intersection with the left turn lane overflow problems. The research wants to know whether the intersection with left turn overflow will have significantly more crashes when compared to the opposite approach. The effect of the rush periods within which the left turn overflow occurs is also analyzed thoroughly. The signalized intersections with left turn overflow are analyzed for total safety effects to the intersections. In this research the following factors in the Florida Department of Transportation District 7 Traffic Safety Data (2000-2004) are analyzed:
a. Time of crash
b. First harmful event of fault driver c. Direction of travel of fault driver d. Type of crash
e. Type of injury
Research Objectives
The primary objective of this research is to present the safety situation of intersections with left turn lane overflow using traffic crash history from the FDOT Traffic Safety database. This is to understand the general safety effects associated with left turn overflow on the intersection approach in between the rush periods and also compared to the opposing approach without the problem. The intersection crashes are analyzed for the extent of safety effects of left turn overflow.
The other objective is to lay the foundation for further research into the
operational challenges that the situation presents. The other phases of this study seeks to observe and analyze data taken with regards to duration of the overflow, number of lane changes, traffic conflicts within the morning and afternoon rush periods.
Chapter 2 Literature Review
Intersection Research
The literature available shows an overwhelming effort towards intersection safety. Intersection safety has been a great concern for transportation safety and operations professionals. The major problem areas at intersections are red light running and
pedestrian safety. There are a number of researches into red light running leading to the implementation of video cameras at intersections to monitor red light running. Pedestrian safety was found to be a grave concern in intersection safety research. Pedestrian crashes abound at intersections particularly in Hillsborough and Pinellas Counties.
Intersections are disproportionately responsible for pedestrian deaths and injuries. Almost 50 percent of combined fatal and non-fatal injuries to pedestrians occur at or near intersections. Pedestrian casualties from vehicle impacts are strongly concentrated in densely populated urban areas where more than two-thirds of pedestrian injuries occur.3 This issue of pedestrian safety at signalized intersection has led to implementation of an increase in the distance between the stop line and the pedestrian cross walk.
Intersection researches are centered on safety and operations. There are a number of researches on signalized intersection operations.
The operational research has focused on traffic signal timing and design orientation of the intersections. Increased use of left turn and right turn lanes have been some of the
benefits of the operations research.
The Federal Highway Administration funded a research into red-light-running crashes (RLR). The research developed a statistical model showing the relationship of geometric variables to RLR crashes. The research identified both the RLR crash and the specific vehicles that ran the red light. Two types of analyses were conducted. The first covered limited contingency tables to examine similarities and differences between RLR crashes and all crashes at urban signalized intersections. For the second analysis,
regression type models were developed to examine the effects of intersection
characteristics on RLR crash frequencies. The researchers found that ADT, width of the intersection, and traffic signal actuation are important non-driver factors for RLR crashes. The results were observed to differ slightly when the RLR vehicle is entering from the higher volume mainline vs. the lower volume cross-street. It was concluded that traffic volume on both the entering and crossing streets, the type of signal in operation at the intersection, and the width of the cross-street at the intersection are the major variables affecting RLR crashes. It was recommended that the results could be used for specific intersections for law enforcement measures, such as installing cameras that detect red-light running, or heightened spot enforcement coupled with publicity, or other
techniques.4
An advance stop line at intersections has been found to increase the safety of the intersection in total. This benefit is realized by pedestrians and drivers at an intersection.
A study was done to investigate driver compliance with advanced stop lines at signalized intersections and potential safety benefits resulting from their usage. The study employed a before-after design to four signalized crosswalks with motorists being the subjects. The baseline period was the standard stop line that is located 4 ft. back from the cross walks and was in good conditions. The stop lines were removed and in place, an experimental advance stop lines placed. The experimental advance stop lines were installed 20ft. from the crosswalks. The observers recorded the following data: driver compliance, with stop line locations, vehicle path and elapsed time for the front wheels of the lead vehicle to enter the intersection after onset of the green signal. The research found that the
percentage of drivers who stopped at least 4 ft. from the crosswalks increased from 74 to 92 percent. The changes for each site and for all four sites combined the changes after the intervention were found to be statistically significant. The study concluded that relocating painted stop lines at signalized intersections from the standard distance of 4 ft. from crosswalk to 20 ft. cab have a significant effect of driver stopping behavior. The study also found majority of drivers complying with the advance stop lines5. The cost of installing the experimental stop lines used in the study was approximately $250 per intersection, including the removal of standard stop lines. In his opinion, the author thinks the measure is a sensible and inexpensive safety enhancement for busy urban
intersections.
Joe G. Bared in an article “Improving Signalized Intersections” touched on a number of areas of concern with regards to in improving intersection safety. He explained the intersection basics as beginning with knowledge of the fundamentals of road user needs, geometric design, traffic design and illumination.
He mentioned the role motorists, bicyclists, and pedestrians as road users being the operative players in the road system and that their decisions affect their performance. On geometric design, he indicated that the primary goal of intersection design is to limit the severity of potential conflicts among road users. A number of innovative designs to minimize safety and operational deficiencies were mentioned under remedies for
intersection problem. The remedies included system-wide, intersection-wide, alternative approach, and individual movement treatment. 6
In the paper “A cognitive engineering approach to improving signalized left turn intersections”, Staplin L and Fisk AD evaluated the effect of providing advanced left turn information to individuals faced with deciding whether or not it is safe to turn at
signalized intersections. Younger drivers had a mean age of 37 years and older drivers had a mean age of 71 years. Using simulations of approaching an intersection with advanced cueing, testing was conducted on the participants. The simulations also had an approaching intersection with advanced cueing. Animated presentations of traffic control displays and featureless background were used. Subjects had to determine whether or not they had a right-of –way to make a left turn. Cueing drivers with advanced notice of the decision rule through a redundant upstream posting of sign elements improved both accuracy and latency of younger and older drivers' decisions.7
Safety effectiveness of intersection left-and right turn lanes were evaluated using statistical techniques on data obtained for the effects of providing left and right turn lanes for at-grade intersections. The sites considered were 280 improved intersections. Other intersections that were not improved, a total of 300, but were similar during the study period were considered for evaluation.
Traffic and accident data, geometric design, traffic control, traffic volumes were gathered for the improved intersections and the other intersection for the study that were not improved. The types of improvements projects ranges from installation of added left-turn lanes, extension of the length of existing left-or right-turn lanes, added right-turn lanes. Three approaches for before-after evaluation were used namely; the yoked comparison or matched-pair approach, the comparison group approach, and the Empirical Bayes
approach. Some of the findings of the research are as follows:
a. Added left-turn lanes are effective in improving safety at signalized and unsignalized intersections in both rural and urban areas. Installation of a single left-turn lane on a major-road approach would be expected to reduce total intersection accidents at rural unsignalized intersections by 28 percent for four-leg intersections and by 44 percent for three-leg
intersections. At urban unsignalized intersections, installation of a left-turn lane on one approach would be expected to reduce accidents by 27 percent for four-leg intersections and by 33 percent for three-leg intersections. At four-leg urban signalized intersections, installation of a left-turn lane on one approach would be expected to reduce accidents by 10 percent. b. Added right-turn lanes are effective in improving safety at signalized and
unsignalized intersections in both rural and urban areas. Installation of a single right-turn lane on a major-road approach would be expected to reduce total intersection accidents at rural unsignalized intersections by 14 percent and accidents at urban signalized intersections by 4 percent.
Right-turn lane installation reduced accidents on individual approaches to four-leg intersections by 27 percent at rural unsignalized intersections and by 18 percentat urban signalized intersections.
The research concluded that the Empirical Bayes method provided the most accurate and reliable results and the method was thus recommend for further use.8
Left turn overflow at signalized intersection has been addressed by increasing left turn lanes. This strategy helps by increasing the capacity of vehicles in the turn bay thereby decreasing or eliminating the tendency of having left turning vehicles backing into the through traffic lanes. In his paper “Effectiveness of Additional Lanes at Signalized Intersections” Kornell et al explored the extent at which one can make such additional lanes applications.9In the paper they showed that effectiveness of additional lanes decreases as the size of the intersection increases. Effectiveness was expressed in terms of marginal capacity increase of the additional lanes, vehicle delay and queue lengths. It was concluded that while roads are an essential part of every urban
transportation network, limits to their capacity expansion do exists. They explained that as intersection grow, they become less effective in providing additional capacity. The loss of effectiveness is reflected in the reduced uncongested lifetime of larger intersections due to increasing marginal demand for capacity and the decreasing marginal capacity of additional lanes.
At signalized intersections signal timing practice has been an effective way of distributing traffic effectively due to the capacity demands by each turning movement.
Exclusive left turn lanes at signalized intersection make it possible for left turning vehicles to safely wait their signal phase for movements without the rear end crash risk and the loss to capacity of through movement traffic.
Ousama Shebeeb in his paper “Safety and Efficiency for Left-Turn Lanes at Signalized Intersections” examined the safety and efficiency at signalized intersections using accident data in three consecutive years and the average left turn stopped delay per vehicle in the peak hour period. The study concluded that the protected-only approaches are less efficient; however, they offer a higher level of safety than other phasing types. He went to caution that protected-only phasing should be applied as a means of
enhancing left-turn safety when expected delay is acceptable based on desired level of service. The study also found out that permissive-only approaches are associated with the best efficiency but the highest accident rates. On a final note he mentioned that from engineering perspective, if the objective is operational efficiency, traffic engineers should favor the permissive left-turn sequence over protected.10
John Lu et al analyzed crash data of signalized intersections in Florida and concluded that signalization did have impacts on traffic safety at intersections. Using statistical and operational research models different variables of the intersection were related to the occurrence of crashes depending on the crash types under consideration.11 Lin PS et al developed strategies to minimize the negative traffic operational impact resulting from inadequate left turn lane length using traffic simulations12
In the paper “Impacts on Safety of Left-Turn Treatment at High-speed Signalized Intersections”, Maze et al showed that signals that are part of a signal system tend to have lower accident rates than isolated signals and presented regression models that could be
used to determine the likely impact of various left turn treatments on intersection accident rates13.
The National Intersection Safety Workshop held in Milwaukee, WI; November 14-16, 2001 developed the national agenda based on the solutions developed for each group. The conference divided the participants into groups with specific objectives. The groups considered the following:
(1) what resources/solutions do we already have in place to assist in intersection crash reduction efforts? what do we have already that is working? (2) what resources/solutions are not in place to assist in crash reduction efforts? and (3) other creative
resources/solutions that have not been tried. Within the third session, the objective was to develop the national agenda based on the solutions developed for each group. The agenda included strategies and a discussion of how they might be implemented. 14
Roy and Lindeberg used cons/benefit techniques to compare crash data and delay in determining the type of intersection operation to be used to minimize the total cost of a given signalized intersection. It determined the method that had the lowest crash rates and overall intersection delay.15
The study by Green and Agent confirmed the fact that crash rates are higher in urban than rural setting. In both rural and urban settings the rate was highest for four-lane undivided highways and lowest for four-lane divided highways. He developed a
spreadsheet that can be divided by highway district with the objective of investigating the intersections with the highest Cash Reduction Factors (CRFs) and determining if
Intersection crash studies are often geared towards the before and after studies where a countermeasure chosen for implementation is analyzed against the before situation. The benefit/cost ratio of a countermeasure implementation is computed using the crash reduction factors. Crash reduction factors are unique for each case and vary by type of roads and level of urbanization.
The method used in calculating CRFs in Florida has been based on the commonly used simple before-and-after approach. This approach has been used widely by state DOTs. However this approach is also known to suffer a widely recognized problem known as the regression-to-the-mean (RTM)- a statistical phenomenon that occurs when a non-random sample is selected from a population. When data from these locations are used to derive CRFs, the resultant CRFs will tend to overestimate the crash reduction for a treatment site.17
Intersection safety using crash data analysis is based on statistical applications of the crash data covering a specified period of time. The methodology used has been generally Binomial distribution, Poisson distribution, Poisson-gamma (or negative binomial) and multinomial probability models. Each approach has its associated range of assumptions and conditions that is suitable for application.
In his paper “Crash reduction following installation of centerline rumble strips on rural two-lane roads” Persaud et al used the empirical Bayes before-after procedure to account for regression to the mean while normalizing for differerences in traffic volume and other factors. The study found out that the there was significant reduction for all injury crashes combined (14%, 95 confidence interval) as well as for frontal and opposing direction sideswipe injury crashes (25%, 95 confidence interval).
It must be mentioned that the study was commissioned as a result of major crash problem involving vehicles crossing the center line of a rural two-lane roads.18 Using the same methodology, Empirical Bayes method, Bhagwant et al looked into the safety effects of conversion of some selected intersections into roundabouts in some cities in the United States. The study considered 23 intersections and found out that 40 percent of all crash severities combined and 80 percent for all injury crashes reduction were achieved by the conversion.19
Chapter 3 Methodology
Selection of Intersections
To look into to the left turn lane overflow, signalized intersections had to be selected for further studies. Selection of Signalized intersection identified was based on the following conditions:
a. That the road falls in the Florida Intrastate Highway System (FIHS) within Hillsborough and Pinellas Counties
b. That the intersection is signalized
c. That the intersection has three or four approaches. d. That the intersection has left turn lane(s).
Identification of Study Signalized Intersections
This was done by asking some residents of Hillsborough and Pinellas County to name signalized intersections with the problem that they are familiar with. This was followed by a field trip for verification (by visual observations during peak hours of operations) and inclusion for further studies.
Many of the signalized intersection with left turn overflow problem that were named however, did not meet the criteria stated for selection. Most of the roads were city roads and did not have exclusive left turn lanes.
Rush Periods
There are two rush periods that were analyzed, morning rush period (AM) and afternoon rush period (PM). The morning and afternoon rush periods were chosen as the time 6:00 through 9:00 and 15:00 through 18:00 respectively.
Within the intersection leg with observed left turn overflow, period 1 is defined as the crash rate for the rush period during which the observed left turn overflow occurs. Period 2 however is the crash rate for the other rush period within the intersection leg with observed left turn overflow. This follows that if the left turn overflow problem at an intersection approach occurs in the morning rush period, then Rush-rate 1 will be the crash rate for the morning (AM) rush period crashes while Rush-rate 2 represents the crash rate for the afternoon (PM) rush period crashes. However if the left turn overflow problem occurs within the PM period, then Rush-rate 1 will be the crash rate for the PM rush period crashes while Rush-rate 2 represents the crash rate for the AM rush period crashes. This was necessary as the observed left turn overflow occurred either within the AM or PM rush periods for the observed signalized intersections. None of the signalized intersections observed had both AM and PM rush periods.
Crash Pattern Analysis
Crash patterns were analyzed using various points around the center line of the intersection as the beginning mileage. The beginning mile post considered were 0 feet from the center line of cross roads to 100 feet about the center line of the cross road of the signalized intersection, reference figure 2 below. That will be using a distance of (x-0) feet for 0 ft from the centerline of the crossroad to (x-100) feet for 100 feet from the crossroad of the centerline. The end mile post considered were 50 feet to 300 feet as overflow distances. This means varying the distance of “F” from 50 ft to 300 ft.
The crashes within the sections of an approach were summarized using the total approach length (X+B+D+F). Keeping all the lengths constants, the overflow length (F) was varied for 100 ft, 200ft and 300 ft. The optimum section used for further analysis is the section comprising 100 feet from the center line of the cross road to 200 feet of overflow distance. Appendix F shows a table of summarized crashes of all approaches for approach lengths from P2 to P1 and varying length X and keeping the length F at 200 ft. The variations considered for length X are from the centerline of the cross roads (X-0), (X-50) and (X-100). The average length from the centerline of the crossroad to the stop line of all intersections with observed left turn overflow was found to be 78 ft. The length of X used for further analysis was thus 100 ft.
Analysis of crash is conducted for all signalized intersections that were
considered including those without an observed left lane overflow problem. This was an attempt to check generally if there was a marked difference between AM rush period and PM rush period crash rates at the area.
Crash Rate
Crash rates are computed by the following formulae:
Crash Rate per ten million vehicles = Number of crashes x 10,000,000 (5*365*AADT)
Crash Rate per ten million vehicles per mile
= Number of crashes x 10,000,000
AM Crash Rate = Number of AM crashes x 10,000,000
(5*365*AADT)
PM Crash Rate = Number of PM crashes x 10,000,000
(5*365*AADT)
Injury Crash Rate Number of injured persons x 10,000,000
(5*365*AADT)
Where AADT is annual average daily traffic. 5 is for 5 year crash data
365 is for 365 days in the year All section lengths are in miles.
Paired t-test
Given two paired sets Xi and Yi of n measured values, the paired t-test determines
whether they differ from each other in a significant way under the assumptions that the paired differences are independent and identically normally distributed.
To apply the test, let
) ( ) ( Y Y Y X X X i i i i − = − = ) )
then t is defined by
∑
= − − − = n i i i Y X n n Y X t 1 2 ) ( ) 1 ( ) ( ) ) Where Xi is a measured item Yi is measured itemX is the mean of measured item X
Y is the mean of measured item Y n is the number of terms
i is any quantity from 1 to n t is the t statistic
This statistic has (n-1) degrees of freedom.
Criteria for t-test
The t test is used to compare two small sets of quantitative data when data in each sample set are related in a special way. The criteria for the sample are:
a. The number of points in each data set must be the same, and they must be organized in pairs, in which there is a definite relationship between each pair of data points
b. If the data were taken as random samples, you must use the independent test even if the number of data points in each set is the same
c. If the data were taken as random samples, you must use the independent test even if the number of data points in each set is the same
d. Even if data are related in pairs, sometimes the paired t is still inappropriate
The paired t test in this study is used to check if crash rates for all 42 signalized intersections differ significantly for the AM and PM rush periods for each pair of intersection approach.
For signalized intersections with observed left turn overflow, the t-test is used to check for difference in crash rates for the approach of interest against the opposite approach. The test is the applied to the same approaches using the rush period crash rates as the variable.
Assumptions
The study was based on left-turn overflows occurring at the named signalized intersection during rush periods in the day. The use of historical crash data was on assumption that the left-turn overflow situation did occur throughout the past years that the data was used. Appendix E, shows the annual average daily traffic (AADT) for historical years 2000 through 2004. It can be seen that the AADT has not changed much over the study period. Some approaches have missing AADT data for some years but was not much to affect a general picture of the event. Fowler Avenue and Leroy Collins Boulevard Eastbound approach had only 2004 AADT. This was because there were no crashes for the section comprising 200 ft. of overflow distance and 100 ft. about the centerline of the cross road, Leroy Collins Boulevard.
It must be noted that the AADT were obtained from the crash data base. For each crash record there is a matching AADT for the location that the crash occurred. An approach of an intersection within the study cordon may have different AADTs. For situatations like that, an average value was used for the analysis.
Hillsborough Avenue at Anderson Road had a steady increase in AADT over the period. The approach AADT increased from 56,000 in 2000 to 66,000 in 2004. The signalized intersections in the Pinellas County had the most growth in traffic over the study period. Main Street at Keene road had an increased AADT from 32,000 in 2000 to 38,500 in 2004. US 19 at Central Avenue and Drew Street had an increase from 34,500 and 66,500 in 2000 to 43,000 and 73,000 in 2004 respectively.
Chapter 4 Data Collection
Geometric Data
High resolution aerial photographs for the Hillsborough County area were obtained from the Hillsborough County Traffic Services Department for the year 2004. The geometric information of the intersection was extracted using ER Viewer Version 7.0. The information taken was namely:
a. The number of left turn lanes
b. Length of roadway from stop line of opposite approaches of an intersection of interest
c. Length of roadway from the stop line of an approach to the beginning of the merge section of the left turn lane (length of the straight section of the left turn lane).
d. Length of the merge section of the left turn lane.
The geometry information of all signalized intersections with observed left turn overflow is shown in Appendix A. The information for rush periods of left turn lane overflow taken are section lengths, number of left turn lanes, median type and mile post defining the section.
Using the straight line diagram (SLD) of the roads for references the following measurement were taken from the aerial photographs of the intersections:
a. Length from stop line to the other stop line of an opposing approach of signalized intersection of interest. The desired length of roadway from the center line of the intersection to the stop line of the left turn lane is computed as half the distance measured (X in Figure 3).
b. Length from the stop line of an approach to the end of the straight portion of the left turn lane (B in Figure 3)
c. Length of the merge lane: Length from the end of the straight portion to the beginning of the merge length (D in Figure 3).
The overflow length F (in Figure 3) however was determined by variation from 50 ft to 300 ft. 200 ft was found to be the optimum overflow distance giving appreciable increase in crashes from a distance of 100 ft. Crashes within an overflow distance of 200 ft and 300ft were not very different.
Crash Data
Crash data was obtained from Florida Department of Transportation District 7 office for the year 200-2004. The crash data has a crash number, date and many other attributes for road geometry, traffic characteristic and crash information regarding the vehicle and the drivers involved.
Figure 3 A Typical 4-Leg Signalized Intersection
Straight line diagrams (SLD) for highways in Hillsborough County were also obtained from the FDOT District 7 office. The straight line diagrams were needed to reference the milepost of sections of a roadway or intersection of interest. This is because the crash data is organized by milepost.
Data was taken with reference to the centerline of the cross road of an intersection except for 2 locations with ramps where mile posts were indicated on the SLD. On Gulf to Bay Boulevard (at US 19) there is a milepost reference at the Northbound US 19 on-ramp. Also on US 19 (at Gandy Boulevard) there is a milepost at the on-ramp Eastbound Gandy Boulevard. For the turn lane for the East-West
approaches of the 4-leg intersection shown in figure 3, X is the length of the roadway from the centerline to the stop line on the approaches. First the distance 2X is measured from the aerial photograph and X computed as half of 2X as the stop line can be seen in the aerial photograph and the centerline deduced.
B and C are the lengths of the straight portions of the turn lanes of the East and West approaches while. D and E are the merge lengths of the turn lanes of the East and West approaches respectively. All these measurements are taken from the aerial
photograph except distance D which is chosen by the analyst. The distance D is the left lane overflow distance for an intersection that the study seeks to evaluate. One length was assumed for all approaches of an intersection.
The total length of a left turn lane is the sum of the merge length and the straight length as B+D and C+E for the East and West approaches respectively as shown in figure 3. The SLD has exact milepost for the crossroad of an intersection, thus the measurements on the leg of an intersection by mile post for any location along the approach can be easily be found.
Locating Mile Posts Along An Approach
Mileage increases from South to North and from West to East
Location M.P for East Approach = Loc. M.P at Cross road - Length of turn lane+X Location M.P for North Approach = Loc. M.P at Cross road + Length of turn lane+X Location M.P for South Approach = Loc. M.P at Cross road - Length of turn lane+X
Using a distance of 200 feet for overflow distance of the turn lane for analysis (F=200 feet in figure 2 above) the location M.P is as follows:
Loc. MP for West Approach = loc MP West Approach + 0.0379 Loc. MP for East Approach = loc MP West Approach - 0.0379 Loc. MP for North Approach = loc MP West Approach + 0.0379 Loc. MP for South Approach = loc MP West Approach - 0.0379
Similarly location mile post for the 100 feet point off the center line of the cross road for an approach of interest are as follows:
Loc. MP for West Approach = loc MP West Approach + 0.0189 Loc. MP for East Approach = loc MP West Approach - 0.0189 Loc. MP for North Approach = loc MP West Approach + 0.0189 Loc. MP for South Approach = loc MP West Approach - 0.0189 0.0189 and .0379 are 100 ft and 200 ft respectively.
Chapter 5 Data Analysis
Intersection Sections for Analysis
The section of the approaches of the signalized intersection under study was varied for different distances. First a section of 50 ft overflow distance to the center line of the cross road was used. Distances were varied for 100 ft, 150 ft, 200 ft, 250 ft and 300 ft. An overflow distance (F in Figure 2) of 200 ft was found to be the optimum distance.
Secondly, the section was varied keeping the 200 ft overflow distance constant and moving the mile post from 0 feet , 50 ft and 100 ft from the center line of the cross road to the signalized intersection of interest. The varied distances are represented by (x-0) feet, (x-50) feet, and (x-100) feet respectively for 0 ft, 50ft and 100ft from the centerline of the cross road. 100’ distance was the optimum distance as it clears influence area of the signalized intersection. This also eliminated the crashes in the influence area of the intersection. This enables us to see the effect of crashes directly related to turning movements at the signalized intersections. Average distance from the centerline of a cross road to the stop line of an intersection approach was 79ft thus 100ft was used for the analysis. This is an attempt to exclude intersection crashes that are not influenced by the left turn overflow problem.
Attributes of Crash Data
The attributes considered in the crash data are as follows: a. FDOT County Number
b. Section c. Subsection d. Date of crash e. Time of Crash f. Day of week g. Location Mile Post h. Section AADT
i. First Harmful event of fault driver j. Direction of travel of fault driver k. Type of crash
l. Type of injury
Organization of Data Analysis
The crashes are grouped by year and the direction of travel as in Table 1 for each approach of the intersection. Table 1 shows the number of crashes by fault vehicle traveling in various directions for Busch Boulevard and Florida Avenue, in the
Westbound approach. It could be seen that this section represent the Westbound approach hence dominates the grouping. Since we are intersected in the crashes by vehicles
traveling West in this approach of the intersection, as it is the approach with observed left turn lane overflow, the West bound crashes are taken for further analysis.
Table 1 Total Number of Crashes for Fault Vehicles
Total Number of Crashes for fault vehicles traveling Total Year West East North South Unknown
2000 7 1 8 2001 3 1 4 2002 10 1 2 13 2003 5 1 6 2004 2 1 1 4 Total 27 2 0 2 4 35 % 77 6 0 6 11 100
For the crashes in the section of a particular approach (direction), further grouping is done by the first harmful event at fault driver and the following as in the table below. Table 2 is the crashes for first harmful event of fault driver grouped by type of crash for Busch Boulevard and Florida Avenue signalized intersection, West bound approach. The crashes are grouped by rear-end, angle, left turn (LT), right turn (RT) , sideswipe and others.
Table 2 First Harmful Event of Fault Driver
Year Description 2000 2001 2002 2003 2004 Total % Rear-end 2 2 7 2 1 14 52 Angle 1 2 1 4 15 LT 0 0 RT 1 1 4 Sideswipe 2 1 3 11 Others 1 1 2 1 5 19 Total 7 3 10 5 2 27 100
Within the direction of travel at fault driver, data is sorted out into day of week from Monday to Sunday as in the table below. Table 3 shows crashes sorted by day of week for Busch Boulevard and Florida Avenue, Westbound approach.
Table 3 Crashes by Day of Week
Year
Day of week 2000 2001 2002 2003 2004 Total %
Monday 1 2 1 4 15 Tuesday 1 1 2 1 5 19 Wednesday 1 1 2 1 5 19 Thursday 0 0 Friday 3 3 2 8 30 Saturday 1 1 1 3 11 Sunday 2 2 7 Total 7 3 10 5 2 27 100
Crashes are then sorted by the rush periods 6:00 through 9:00 and 15:00 through 18:00 for AM and PM rush periods respectively. Table 4 represents crashes sorted by rush periods for Busch Boulevard and Florida Avenue, West Bound Approach.
Table 4 Crashes by Rush Period
Year Rush Period 2000 2001 2002 2003 2004 Total % AM (6-9) 1 1 2 7 PM (15-18) 1 2 3 1 7 26 Others 6 1 6 3 2 18 67 Total 7 3 10 5 2 27 100
Similar tables are constructed for all 42 signalized intersections including those without observed left turn lane overflow problem. The result are exported into another
spreadsheet for further analysis.
The summary of crashes for all intersections with observed left turn overflows is presented in Appendix F. The section of the approaches considered is 100 ft about the center line of the crossroad and an overflow distance of 200 ft.
Analysis
Crash rates are calculated for all 41 signalized intersection main roads under study. The approach sections of the main roads are used for the analysis. Crash rates for both AM and PM rush periods are calculated. This calculation is done for the approach section comprising of 100 ft off the center line of the cross road to 200 feet of overflow distance.
Appendix C shows all crash rates, AM and PM crash rate for all approaches of the signalized intersections. The rush periods for the intersections with observed left turn overflow are shown with a shade indicating the approach at which the overflow occurs. In the table of Appendix C, Crash Rates, intersection approaches with no indication of rush periods, either AM or PM indicates that they have no observed left turn overflow problem. These intersections were important in the study for understanding of general trends in signalized intersections although no left turn overflow was observed within the AM and PM rush period.
Appendix D shows the number crashes for the signalized intersection with observed left turn lane overflow by type of crash and day of the week for all approaches.
For the signalized intersection with observed overflow, further analysis was done for an overview of the data gathered. The total crashes of all approaches of interest was analyzed by day of week. Tuesdays, Wednesdays and Fridays seem to have the greatest number of crashes. This is illustrated by Figure 3 on the next page.
0
5
10
15
20
M on
Tue
Wed
Thu
Fri
Sat
Sun
Day of Week
T
o
tal C
ras
h
es
Figure 4 Crashes by Day of Week for All Signalized Intersections
The total crashes of all signalized intersection with observed left turn overflow was further grouped by type of crash. Rear end crashes was the highest of all crashes with a value of 69 percent. Sideswipe was the second highest of type of crash comprising of 10 percent of the total crashes. This is shown in Figure 5 on the next page.
Type of Crash
69
10
2
2
9
10
Rear-end
Angle
LT
RT
Sideswipe
Others
Figure 5 Type of Crash for All Signalized Intersections
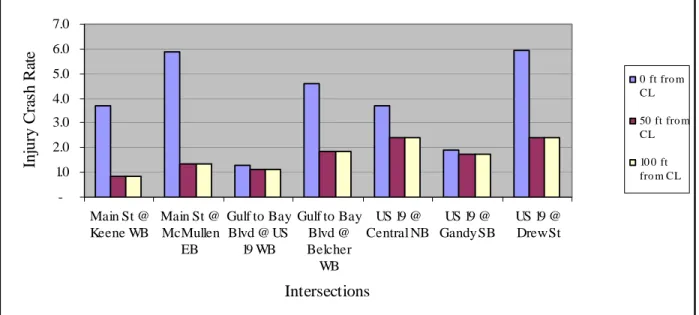
Injury crash rate for the signalized intersection approaches with observed left turn overflow were analyzed for different section distances. The distances considered were 200 ft of overflow length for all cases. The variation was for the distance X (Figure 2) using X, X-50, X-100 respectively for 0ft, 50ft and 100ft off center line of the cross road. It can be seen from Figure 5 that the crash rates decreases as X is decreased intuitively illustrating the degree of safety being least around the center of an intersection and increasing outwards.
-2.0 4.0 6.0 8.0 10.0 12.0 Bus ch @ Florida WB Bus ch Blvd @ I-275S EB Bus ch Blvd @ I-275N EB Dale Mabry @ Waters NB Nebras ka @ Fletcher SB Hills borough @ Anders on EB Intersections In ju ry C ra sh R a te 0 ft fro m CL 50 ft fro m CL 10 0 ft fro m CL
Figure 6 Injury Crash Rate
-1.0 2.0 3.0 4.0 5.0 6.0 7.0 8.0 9.0 Hills bo ro ugh @ S he ldo n EB Hills bo ro ugh @ F lo rida WB F o wle r @ Ne bra s ka WB F o wle r @ Le ro y C o llins EB F o wle r @ B B D EB Ke nne dy @ Da le Ma bry WB Intersections In ju ry Cr a sh Ra te 0 ft fro m CL 50 ft fro m CL 10 0 ft fro m CL Figure 6 (Continued)
-1.0 2.0 3.0 4.0 5.0 6.0 7.0 Main St @ Keene WB Main St @ McMullen EB Gulf to Bay Blvd @ US 19 WB Gulf to Bay Blvd @ Belcher WB US 19 @ Central NB US 19 @ Gandy SB US 19 @ Drew St Intersections Inj u ry Cr as h Ra te 0 ft fro m CL 50 ft fro m CL 10 0 ft fro m CL Figure 6 (Continued)
Table 5 shows the crash rate for all 19 signalized intersections in this study. Crash rat was computed for various section lengths varying the distance from the center line of the crossroad. Crash rates generally decrease as the distance from the center line of the cross is increased.
Chapter 6 Findings
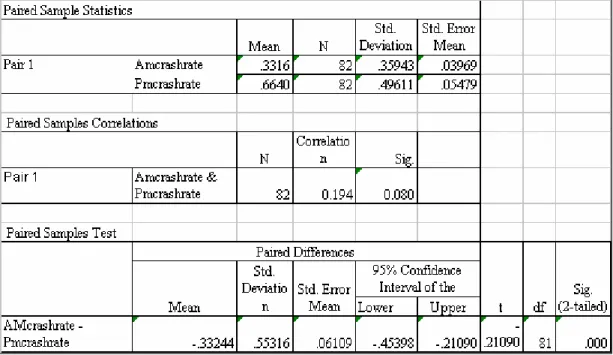
Using all 41 signalized intersections observed, all the 82 opposing approaches were used to verify if the AM crashes differ significantly from the PM crashes. There seem to be a general difference but not significant as shown in table 6. The mean for the crash rates for the PM rush period is higher than that of the AM rush period. This was done for the signalized intersection using the section comprising of 100 feet from the center line of the cross road and 200 feet of overflow distance. The data used is shown in Appendix C.
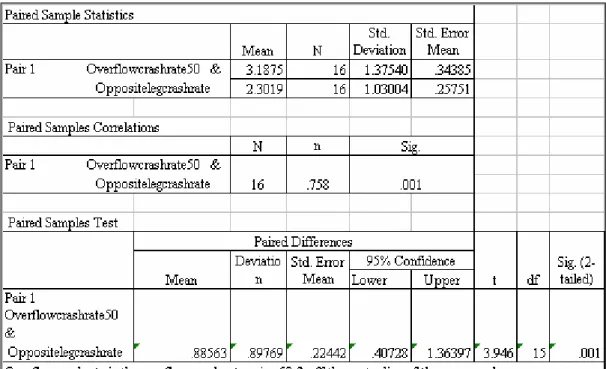
Table 7 Rush Period Crash Rate
The rush period crash rate for intersection approaches with observed left turn overflow is shown in Table 7 above. The section length considered was the section of the approach with 200 ft of overflow distance and a range of distances from the center line of the cross road. The variations were 0 ft, 50ft and 100 ft. 100ft however gives a perfect picture of the scenario under study. It can be seen that the crash rates generally decrease as the distance from the center line of the cross road is increased.
The rush period crash rates were then analyzed for the study signalized intersection that is those with observed overflow left turn lanes.
Rush-rate1 is the crash rate of an intersection approach for the rush period (AM or PM) that the observed left turn overflow occurs, while Rush-rate 2 is the other rush period within the same intersection approach. This follows that for an intersection approach if the left turn overflow occurs in the AM rush period, Rush-rate 1 will be the crash rate for the AM rush period. Rush rate 2 will thus be the crash rate for the PM rush period. On the other hand, if the left turn overflow occurs within the PM rush period, Rush-rate 1 will be the crash rate for the PM rush period with Rush-rate 2 as the crash rate for the PM rush period. The statistical results suggest that there is no significant difference between the crash rates occurring at the rush period of observed overflow situation and the other rush crash rate using all the signalized intersection inclusive of the 3 comprising of 3 leg approaches.
The test was run using only the four-leg approach intersection. No remarkable difference was observed. Table 8 shows the statistical results in this case.
The signalized intersections with observed left turn overflow consists of 16 of four-leg approach type and 3 of three leg approach types namely Fowler Avenue atLeroy Collins Blvd, Busch Boulevard at I-275 S ramp and Busch Boulevard at I-275 N ramp. These 3-leg approaches have dynamics different from the 4 leg approach type. The paired t test was however run eliminating these three-leg approach signalized intersection. The result shows that there is a significantly more crashes on the signalized intersection approach with left turn overflow than the opposing approach without this problem.
The crash rate for the signalized intersection leg with an observed left turn overflow was compared to the opposite leg that does not experience left turn overflow. The statistical results suggest a significant difference between their crash rates at the 95% confidence level. The crashes on the approach with observed overflow are significantly more than the opposite approach without the overflow at the 95% confidence level. This finding support the thesis that the signalized intersection approach with observed left turn overflow has significantly more crashes than the opposing approaches.
Table 9 on the next page shows the statistical results for crash rates of study intersection using only the 4 leg approach types.
Table 9Statistical Results for Crash Rates of Study Intersections (4-leg only)
Table 10 shows the statistic using all observed left turn over approach intersection inclusive of the 3 of the 3 leg approach type. It can be seen that there seems to be a general difference in the crashes but not significant at the 95 percent confidence level.
The same statistic was carried for the signalized intersections with observed left turn overflow using a section 50 feet from the center line of the cross road to 200 feet of overflow distance. As can be seen from the statistics there is not difference at all. It is even worse using the section exactly from the center line of the cross road to 200 feet of overflow distance. This firms the reason that the mechanism governing the crashes in the influence area of an intersection has nothing to do with the left turn overflow.
Chapter 7
Conclusions and Recommendations
Conclusions
The study considered a number of variations of the intersection approach section for the left turn lane overflow problem. Of the left turn overflow distances considered for further crash analysis, 200 feet distance was found to be optimum for consideration in the
analysis.
Comparing the crash rates for the intersection approaches with observed left turn overflow against the opposite approach the evidence that the approach with left turn overflow had more crashes than the other was overwhelming. Crashes on the intersection approach with observed left turn overflow is significantly more than the opposite
approach without this problem. Care must be observed not to include different types of approaches in this analysis. In this case having 3 leg approach intersection with 12 of 4 leg approach intersection did not make the picture clear.
The rush period crash rates for the approaches with observed left turn overflow does not show any difference whatsoever from the other rush period within the same approach. The crash data showed generally more crashes occurring in the PM rush period suggesting why no difference was found. Most of the observed left turn overflow occurs in the AM rush period.
An attempt however to show that there is a significant difference between the AM rush period crash rates and that of the PM rush period using all 42 signalized intersection approaches came out in the negative. This may suggest that more factors than considered are at play.
This study makes a strong case that a signalized intersection with a left turn overflow approach problem has significantly more crashes on that leg than the opposite leg without this problem.
Further research into the dynamism of left turn overflow at signalized intersection using conflict study, duration of queue within the rush periods and traffic signal timing information will make the picture even clearer in the next phase of this project.
Recommendations
The following countermeasures are recommended to deal with the left-turn overflow at signalized intersections:
a. Provision of advanced warning signs to inform drivers about the impending left-turn overflow. This will enable drivers to have sufficient time to make the necessary lane changes to avoid the overflow queue.
b. Retiming of the traffic signals. Retiming of traffic signals has the advantage of improving the capacity of left-turning vehicles to successfully negotiate the turn on their green time
c. Increase in the number of left-turn lanes. This almost doubles the capacity of left-turning vehicles that can successfully negotiate the turn movement on the green time of the left-turn.
d. Increase in the left-turn lane length. This countermeasure has the advantage of increasing the number of left-turning vehicles to be stored in the left-turn bay reducing the tendency to block through movement vehicles and also increase overall safety.
References
1 http://safety.fhwa.dot.gov/intersections/inter_facts.htm.
2 U.S. Department of Transportation Federal Highway Administration (2003).
Manual on uniform traffic control devices.
3 (http://safety.fhwa.dot.gov/intersections/docs/01prob.pdf).
4 Yusuf, M. Mohamedshah et al (2000). Association of Selected Intersection Factors With
Red-Light-Running Crashes. Institute of Transportation Engineers Journal.
5 Retting, Richard, Houten, Ron Van (2000). Safety Benefits of advance Stop Lines at
Signalized Intersections: Results of a Field Evaluation. Institute of Transportation Engineers Journal.
6 Bared, Joe G. (2005). Improving Signalized Intersections.
Public Roads.
7 Staplin L, Fisk AD (1991). Cognitive Engineering Approach to Improving Signalized
Left Turn Intersections. Hum Factors.
8 Harwood, Douglas W. et al (2003). Safety Effectiveness of Intersection
Left- and Right-Turn Lanes. Transportation Research Board.
9 Kornel Mucsi , Ata M. Khan (2003). Effectiveness of Additional Lanes at Signalized
Intersections. ITE Journal.
10 Shebeeb, Ousama (1995). Safety and Efficiency for Exclusive Left-Turn Lanes at
Signalized Intersections. Institute of Transportation Engineers Journal.
11 Pernia, JC; Lu, JJ; Weng, MX; Xie, X; Yu, Z (2002). Development of Models to
Quantify the Impacts of Signalization on Intersection Crashes, Tampa: Florida Department of Transportation.
12 Lin, P-S; Kou, C-C (2004). The Effects of Left-Turn Lane Queue Storage Lengths on
Intersection Delay. Washington, DC: Institute of Transportation Engineers.
13 Maze, TH; Henderson, JL; Sankar, R (1994) Impacts on Safety of Left-Turn Treatment
14
U.S. Department of Transportation Federal Highway Administration (2003).National Agenda for Intersection Safety.
15 Roy, C; Lindeberg, M (2004). A Study of Left Turn Operations at Signalized
Intersections. Washington, DC: Institute of Transportation Engineers.
16 Green, ER; Agent, KR (2003). Crash Rates at Intersections. Lexington: University of
Kentucky.
17
Albert Gan, Joan Shen and Adriana Rodriguez (2005). Update of Florida Crash Reduction Factors and Countermeasures to Improve the Development of District Safety Improvement Projects. Miami: Lehman Center for Transportation Research.
18 Bhagwant N. Persaud; Richard A. Retting; Craig A. Lyon (2004). Crash Reduction
Following Installation of Centerline Rumble Strips on Rural Two-lane roads. Accident Analysis and Prevention.
19
Bhagwant N. Persaud; Richard A. Retting;Per E. Garder; Dominique Lord (2000). Safety Effects of Roundabout Conversions in the United States, Empirical Bayes Observational Before-After Study. Transportation Research Record.
Appendix C: Crash Rates Table 15 Crash Rates
Appendix C: (Continued) Table 15 Continued
Appendix C: (Continued) Table 15 Continued
Appendix D: Crash by Type and Day of Week Table 16 Crash by Type and Day of Week
Appendix D: (Continued) Table 16 Continued
Appendix E Annual Average Daily Traffic for Study Period Table 17 Annual Average Daily Traffic for Study Period
Appendix E (Continued) Table 17 Continued