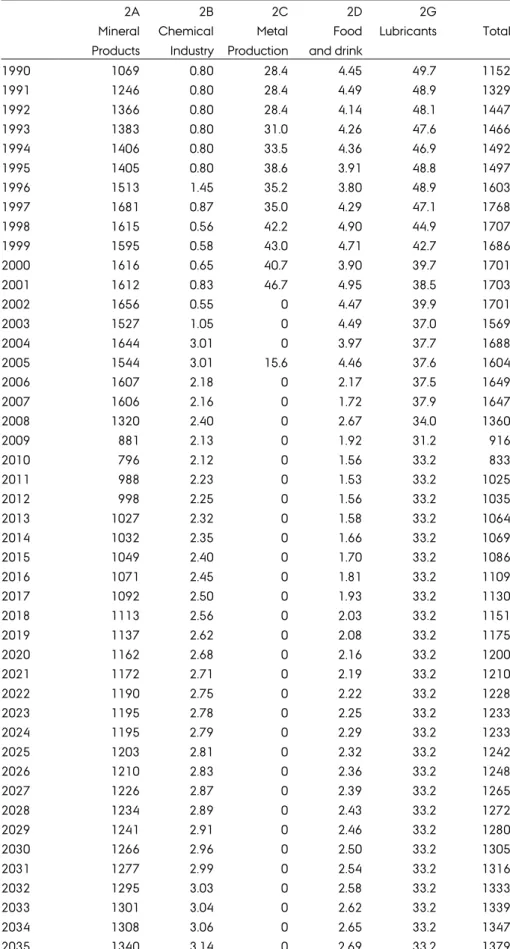
PROJECTION OF GREENHOUSE GASES
Full text
Figure


Related documents
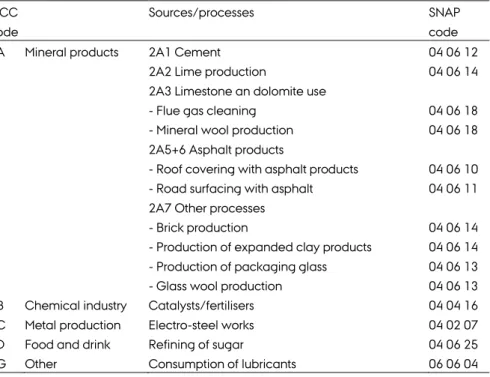
and NMVOC) for combustion and industrial processes used in the Finnish greenhouse gas inventory are evaluated based on domestic and international literature, available
Developing an ANFIS-PSO Based Model to Estimate Mercury Emission in Combustion Flue Gases.. Alireza Baghban 1, Masoud Hadipoor 2 , Shahaboddin
It is recommended for the purpose of emission inventory calculations at Zurich Airport to use the methodology and emission indices of "ZRH/FOCA" in table 4-3 based on real
Determination upon adaptation and mitigation strategies was on the basis of several scenarios of emission level reduction while the prioritized strategy selection was based
Finally, in Section A.3, we carry out a fully automated analysis of the Plato data based on all affine projections, not just first and second order statistics.. We conclude that


