Quantitative risk assessment, aggregation
functions and capital allocation problems
Jaume Belles Sampera
Aquesta tesi doctoral està subjecta a la llicència Reconeixement- NoComercial – SenseObraDerivada 3.0. Espanya de Creative Commons.
Esta tesis doctoral está sujeta a la licencia Reconocimiento - NoComercial – SinObraDerivada 3.0. España de Creative Commons.
This doctoral thesis is licensed under theCreative Commons Attribution-NonCommercial-NoDerivs 3.0. Spain License.
jau m e b e l l e s s a m p e r a
Q U A N T I TAT I V E R I S K A S S E S S M E N T, A G G R E G AT I O N F U N C T I O N S A N D C A P I TA L
Q U A N T I TAT I V E R I S K A S S E S S M E N T, A G G R E G AT I O N F U N C T I O N S A N D C A P I TA L A L L O C AT I O N P R O B L E M S
jau m e b e l l e s s a m p e r a
Research Group on Risk in Insurance and Finance
IREA - Institut de Recerca en Economia Aplicada Regional i Pública
Departament d’Econometria, Estadística i Economia Espanyola Facultat d’Economia i Empresa
Universitat de Barcelona
Jaume Belles Sampera: Quantitative risk assessment, aggregation func-tions and capital allocation problems,Riskcenter, May2015.
Dissertation submitted in fulfillment of the requirements for the PhD in Business.
s u p e r v i s o r s:
Dr. Miguel Ángel Santolino Prieto Dr. Montserrat Guillén Estany
l o c at i o n:
A G R A Ï M E N T S
Aquesta tesi doctoral recull els resultats de la recerca acadèmica que he dut a terme els darrers quatre anys, però també és el fruit de tota la meva trajectòria professional, acadèmica i personal. Hi ha un munt de persones amb les qui he conviscut durant tots aquests anys i a qui estic molt agraït per diversos motius: perquè m’han instruït, recolzat i ajudat o, senzillament, perquè he tingut la sort de poder-les conèixer i compartir temps amb elles. Malgrat que no deixi constàn-cia en aquestes línies de tots els seus noms, les he tingut presents en molts moments.
Sóc incapaç d’imaginar com hagués estat aquesta tesi sense el guiat-ge d’en Miguel i de la Montse, els meus directors. Entre moltes de les seves virtuds en destacaria la passió que tots dos tenen per la recerca, la seva capacitat incansable de treball i la seva habilitat per fer enten-dor i senzill allò que a molts de nosaltres ens podria semblar intricat. La seva implicació en aquest projecte ha estat total des d’un bon inici, des del moment en el qual els vaig plantejar les idees que tenia més o menys embastades com a punt de partida. Immediatament em van ajudar a fixar objectius, a ampliar i enriquir el contingut, a centrar es-forços i a esbossar un pla de treball que permetés, en algun moment dels quatre anys següents, donar per enllestida la meva tesi doctoral. I la seva feina ha estat tan encertada que aquest moment finalment ha arribat. Com en qualsevol procés de dissertació, hi ha hagut mo-ments d’eufòria i momo-ments de desencís: en Miguel i la Montse sempre m’han fer tocar de peus a terra en els primers i m’han animat i enco-ratjat en els segons. A més, tots dos han fet gala d’una inesgotable paciència, perquè he de reconèixer que sóc força tossut i, de vegades, empipadorament pessimista. Em podria estendre llargament sobre les coses que n’he après de tots dos, en àmbits purament acadèmics i de recerca però també en altres àmbits, com en la gestió de persones o en el treball en equip. Espero continuar gaudint de la seva compa-nyia i aprenent d’ells tot allò que pugui: a part de l’evident satisfacció personal que comporta concloure una tesi doctoral, m’enduc la sen-sació d’haver fet dos nous amics d’aquells que ho són per tota la vida.
També vull donar les gràcies als meus companys al Riskcenter i a la Facultat d’Economia i Empresa de la Universitat de Barcelona. M’han envoltat d’un ambient de treball agradable i motivador, i m’han acol-lit amb els braços oberts des del primer moment. Manuela, Ana María, Helena, Óscar, Rosina, Tono, Maria,... trobaré a faltar les con-verses dels dinars (gairebé tant com els menjars que m’ha preparat
tantes vegades l’Emi, a qui li donc mil gràcies i una forta abraçada). Ramon, Merche i Cati, merci pel vostre suport, per poder comp-tar sempre amb els vostres consells. José María, moltes gràcies per introduir-me al món dels operadors d’agregació. Esther, em vas fer sentir molt a gust en el teu equip dedicat a la recerca en emprenedo-ria. Coloma i Dolors, un fort petó a totes dues.
Les meves experiències professionals en el sector financer i assegu-rador han contribuït decisivament en el resultat final d’aquest treball. Tinc molt bons records de diferents persones amb les que he tingut el gust de treballar a KPMG, als seus clients i, també, a Seguros Cata-lana Occidente, i els vull agrair a totes elles les vivències compartides.
No em vull oblidar de la meva colla d’amics. Fa molts anys que tinc la sort de compartir amb tots ells moments inoblidables, i vull aprofitar l’ocasió per agraïr-los que pugui formar part de cadascuna de les seves històries personals. A tots ells els duc ben aprop del cor. La Lidia i la Marina omplen de comfort i d’amor la meva esfera més íntima. Són la meva llar i per mi és tot un orgull poder dir que són la meva dona i la meva filla. Tinc la impressió que tenim l’estrany privilegi d’haver-nos trobat i de poder i voler compartir les nostres vides. Senzillament, ens estimem. Moltíssimes gràcies Lidia per la teva paciència: ja sé que de vegades dius que no en tens gaire, però no totes les parelles poden dir que han superat la redacció d’una tesi doctoral!
Per acabar, un agraïment molt especial per tota la meva nombrosa i fantàstica família, particularment als meus pares Mario i Maria Do-lors i als meus germans Màrius, Cristina, Damià i Lola. En aquests darrers quatre anys ens han passat un munt de coses, algunes de molt bones (la Muriel i la Marina en són els millors exemples) i altres de molt tristes. Sé que el pare estaria tan orgullós com tota la resta de poder veure impresa aquesta tesi. En nombroses ocasions al llarg de la meva vida he sentit que elstetesi els pares tenien una gran fe en les meves aptituds i capacitats. Sense el seu alè de suport hagués estat impossible arribar fins aquí.
A B S T R A C T
This work is focused on the study of risk measures and solutions to capital allocation problems, their suitability to answer practical ques-tions in the framework of insurance and financial instituques-tions and their connection with a family of functions named aggregation ope-rators. These operators are well-known among researchers from the information sciences or fuzzy sets and systems community.
The first contribution of this dissertation is the introduction of Glue-VaR risk measures, a family belonging to the more general class of distortion risk measures. GlueVaR risk measures are simple to un-derstand for risk managers in the financial and insurance sectors, be-cause they are based on the most popular risk measures (VaR and TVaR) in both industries. For the same reason, they are almost as easy to compute as those common risk measures and, moreover, GlueVaR risk measures allow to capture more intricated managerial and regu-latory attitudes towards risk.
The definition of the tail-subadditivity property for a pair of risks may be considered the second contribution. A distortion risk mea-sure which satisfies this property has the ability to be subadditive in extremely adverse scenarios. In order to decide if a GlueVaR risk measure is a candidate to satisfy the tail-subadditivity property, con-ditions on its parameters are determined.
It is shown that distortion risk measures and several ordered weigh-ted averaging operators in the discrete finite case are mathematically linked by means of the Choquet integral. It is shown that the over-all aggregation preference of the expert may be measured by means of the local degree of orness of the distortion risk measure, which is a concept taken over from the information sciences community and brung into the quantitative risk management one.
New indicators for helping to characterize the discrete Choquet in-tegral are also presented in this dissertation. The aim is complement-ing those already available, in order to be able to highlight particular features of this kind of aggregation function. Following this spirit, the degree of balance, the divergence, the variance indicator and Rényi entropies as indicators within the framework of the Choquet integral are here introduced.
A major contribution derived from the relationship between distor-tion risk measures and aggregadistor-tion operators is the characterizadistor-tion of the risk attitude implicit into the choice of a distortion risk measure and a confidence or tolerance level. It is pointed out that the risk atti-tude implicit in a distortion risk measure is to some extent contained in its distortion function. In order to describe some relevant features of the distortion function, the degree of orness indicator and a quo-tient function are used. It is shown that these mathematical devices give insights on the implicit risk behavior involved in risk measures and entail the definitions ofoverall,absoluteandspecific risk attitudes.
Regarding capital allocation problems, a list of key elements to de-limit these problems is provided and mainly two contributions are made. Firstly, it is shown that GlueVaR risk measures are as useful as other alternatives like VaR or TVaR to solve capital allocation prob-lems. The second contribution is understanding capital allocation principles as compositional data. This interpretation of capital alloca-tion principles allows the connecalloca-tion between aggregaalloca-tion operators and capital allocation problems, with an immediate practical applica-tion: Properly averaging several available solutions to the same cap-ital allocation problem. This thesis contains some preliminary ideas on this connection, but it seems to be a promising research field.
R E S U M
Aquest treball se centra en l’estudi de mesures de risc i de solucions a problemes d’assignació de capital, en la seva capacitat per respon-dre qüestions pràctiques en l’àmbit de les institucions asseguradores i financeres, i en la seva connexió amb una família de funcions anome-nades operadors d’agregació. Aquests operadors són ben coneguts entre els investigadors de les comunitats de les ciències de la infor-mació o dels conjunts i sistemesfuzzy.
La primera contribució d’aquesta tesi és la introducció de les mesu-res de risc GlueVaR, una família que pertany a la classe més general de les mesures de risc de distorsió. Les mesures de risc GlueVaR són senzilles d’entendre per als gestors de risc del sector financer i asse-gurador, perquè estan basades en les mesures de risc més populars (el VaR i el TVaR) en aquestes indústries. Per la mateixa raó, són quasi tan fàcils de calcular com aquestes mesures de risc més comuns però, a més, les mesures de risc GlueVaR permeten capturar actituds de gestió i regulatòries davant del risc més complicades.
La definició de la propietat de la subadditivitat en cues per a una parella de riscos es pot considerar la segona contribució. Una mesura de risc de distorsió que satisfà aquesta propietat té la capacitat de ser subadditiva en escenaris extremadament adversos. Per tal de decidir si una mesura de risc GlueVaR és candidata a satisfer la propietat de la subadditivitat en cues es determinen condicions sobre els seus paràmetres.
Es mostra que les mesures de risc de distorsió i diversos operadors de mitjanes ponderades ordenades en el cas finit i discret estan mate-màticament relacionats a través de la integral de Choquet. Es mostra que la preferència global d’agregació de l’expert pot mesurar-se us-ant el nivell local d’ornessde la mesura de risc de distorsió, que és un concepte traslladat de la comunitat de les ciències de la informació cap a la comunitat de la gestió quantitativa del risc.
Nous indicadors per a ajudar a caracteritzar les integrals de Cho-quet en el cas discret també es presenten en aquesta dissertació. Es pretén complementar-ne els ja existents, per tal de ser capaços de destacar característiques particulars d’aquest tipus de funcions d’agre-gació. Seguint aquest esperit, es presenten el nivell de balanç, la divergència, l’indicador de variança i les entropies de Rényi com a
indicadors en l’àmbit de la integral de Choquet.
Una contribució rellevant que es deriva de la relació entre les mesu-res de risc de distorsió i els operadors d’agregació és la caracterització de l’actitud davant del risc implícita en la tria d’una mesura de risc de distorsió i d’un nivell de confiança. S’assenyala que l’actitud davant del risc implícita en una mesura de risc de distorsió està continguda, fins a cert punt, en la seva funció de distorsió. Per tal de descriure al-guns trets rellevants de la funció de distorsió s’usen l’indicador nivell d’orness i una funció quocient. Es mostra que aquests instruments matemàtics aporten informació relativa al comportament davant del risc implícit en les mesures de risc, i que d’ells se’n deriven les defini-cions de lesactituds davant del risc de tipus general,absolutiespecífic.
Quant als problemes d’assignació de capital, es proporciona un llis-tat d’elements clau per a delimitar aquests problemes i es fan prin-cipalment dues contribucions. En primer lloc, es mostra que les mesures de risc GlueVaR són tan útils com altres alternatives com el VaR o el TVaR per resoldre problemes d’assignació de capital. La segona contribució consisteix en entendre els principis d’assignació de capital com a dades composicionals. Aquesta interpretació dels principis d’assignació de capital permet establir connexió entre els operadors d’agregació i els problemes d’assignació de capital, amb una aplicació pràctica immediata: calcular degudament la mitjana de diferents solucions disponibles per al mateix problema d’assignació de capital. Aquesta tesi conté algunes idees preliminars sobre aque-sta connexió, però sembla un camp de recerca prometedor.
R E S U M E N
Este trabajo se centra en el estudio de medidas de riesgo y de solu-ciones a problemas de asignación de capital, en su capacidad para responder cuestiones prácticas en el ámbito de las instituciones asegu-radoras y financieras, y en su conexión con una familia de funciones denominadas operadores de agregación. Estos operadores son bien conocidos entre los investigadores de las comunidades de las ciencias de la información o de los conjuntos y sistemas fuzzy.
La primera contribución de esta tesis es la introducción de las medi-das de riesgo GlueVaR, una familia que pertenece a la clase más gen-eral de las medidas de riesgo de distorsión. Las medidas de riesgo GlueVaR son sencillas de entender para los gestores de riesgo de los sectores financiero y asegurador, puesto que están basadas en las me-didas de riesgo más populares (el VaR y el TVaR) de ambas industrias. Por el mismo motivo, son casi tan fáciles de calcular como estas me-didas de riesgo más comunes pero, además, las meme-didas de riesgo GlueVaR permiten capturar actitudes de gestión y regulatorias ante el riesgo más complicadas.
La definición de la propiedad de la subadditividad en colas para un par de riesgos se puede considerar la segunda contribución. Una medida de riesgo de distorsión que cumple esta propiedad tiene la capacidad de ser subadditiva en escenarios extremadamente adver-sos. Con el propósito de decidir si una medida de riesgo GlueVaR es candidata a satisfacer la propiedad de la subadditividad en colas se determinan condiciones sobre sus parámetros.
Se muestra que las medidas de riesgo de distorsión y varios ope-radores de medias ponderadas ordenadas en el caso finito y discreto están matemáticamente relacionadas a través de la integral de Cho-quet. Se muestra que la preferencia global de agregación del experto puede medirse usando el nivel local deornessde la medida de riesgo de distorsión, que es un concepto trasladado des de la comunidad de las ciencias de la información hacia la comunidad de la gestión cuantitativa del riesgo.
Nuevos indicadores para ayudar a caracterizar las integrales de Choquet en el caso discreto también se presentan en esta disertación. Se pretende complementar a los existentes, con el fin de ser capaces de destacar características particulares de este tipo de funciones de agregación. Con este espíritu, se presentan el nivel de balance, la
divergencia, el indicador de varianza y las entropías de Rényi como indicadores en el ámbito de la integral de Choquet.
Una contribución relevante que se deriva de la relación entre las medidas de riesgo de distorsión y los operadores de agregación es la caracterización de la actitud ante el riesgo implícita en la elección de una medida de riesgo de distorsión y de un nivel de confianza. Se señala que la actitud ante el riesgo implícita en una medida de riesgo de distorsión está contenida, hasta cierto punto, en su función de distorsión. Para describir algunos rasgos relevantes de la función de distorsión se usan el indicador nivel deornessy una función cociente. Se muestra que estos instrumentos matemáticos aportan información relativa al comportamiento ante el riesgo implícito en las medidas de riesgo, y que de ellos se derivan las definiciones de les actitudes ante el riego de tipo general,absolutoyespecífico.
En cuanto a los problemas de asignación de capital, se proporciona un listado de elementos clave para delimitar estos problemas y se ha-cen principalmente dos contribuciones. En primer lugar, se muestra que las medidas de riesgo GlueVaR son tan útiles como otras alterna-tivas tales como el VaR o el TVaR para resolver problemas de asig-nación de capital. La segunda contribución consiste en entender los principios de asignación de capital como datos composicionales. Esta interpretación de los principios de asignación de capital permite es-tablecer conexión entre los operadores de agregación y los problemas de asignación de capital, con una aplicación práctica inmediata: cal-cular debidamente la media de diferentes soluciones disponibles para el mismo problema de asignación de capital. Esta tesis contiene algu-nas ideas preliminares sobre esta conexión, pero parece un campo de investigación prometedor.
P U B L I C AT I O N S
Most ideas and figures in this dissertation have previously appeared in the following publications. Here is the list of chapters of this thesis to which they are related:
Belles-Sampera, J., Guillén, M. and Santolino, M. [2014] , ‘Be- Chapters1and2
yond Value-at-Risk: GlueVaR distortion risk measures’, Risk A-nalysis34(1),121–134. [Belles-Sampera et al.,2014a]
Belles-Sampera, J., Guillén, M. and Santolino, M. [2013], Gene- Chapter2
ralizing some usual risk measures in financial and insurance applications, inM. Fernández-Izquierdo, M. Muñoz-Torres and R. León, eds, ‘Modeling and Simulation in Engineering, Eco-nomics and Management. Proceedings of the MS2013
Interna-tional Conference’, Vol. 145 of Lecture Notes in Business
Infor-mation Processing, Springer-Verlag, pp. 75–82. [Belles-Sampera
et al.,2013a]
Belles-Sampera, J., Guillén, M. and Santolino, M. [2014], ‘The Chapters2and3
use of flexible quantile-based measures in risk assessment’, Com-munication in Statistics – Theory and Methods (Accepted).[Belles-Sampera et al.,2014c]
Belles-Sampera, J., Merigó, J. M., Guillén, M. and Santolino, Chapter4 M. [2013],‘The connection between distortion risk measures and
ordered weighted averaging operators’, Insurance: Mathematics and Economics52(2),411–420. [Belles-Sampera et al.,2013b]
Belles-Sampera, J., Merigó, J. M., Guillén, M. and Santolino, M. Chapter5 [2014], ‘Indicators for the characterization of discrete Choquet
integrals’, Information Sciences 267, 201–216. [Belles-Sampera
et al.,2014d]
Belles-Sampera, J., Merigó, J. M. and Santolino, M. [2013], Some Chapter5
new definitions of indicators for the Choquet integral, in H. Bustince, J. Fernández, T. Calvo and R. Mesiar, ed., ‘Aggre-gation Functions in Theory and Practice. Proceedings of the
7th International Summer School on Aggregation Operators’,
Vol. 228 of Advances in Intelligent Systems and Soft Computing,
Springer-Verlag, pp.467–476. [Belles-Sampera et al.,2013d]
Belles-Sampera, J. and Santolino, M. [2013], Algunas reflexiones Chapters7and8
sobre los problemas de asignación de capital y la aplicación de ciertas medidas de riesgo, in E. Gómez Déniz, M. Guillén Es-tany and F. Vázquez Polo, eds, ‘Investigaciones en Seguros y
Gestión del Riesgo: Riesgo 2013’, Vol. 194 of Cuadernos de la
Fundación, Fundación MAPFRE, pp. 161–176. [Belles-Sampera
and Santolino,2013a]
Belles-Sampera, J., Guillén, M. and Santolino, M. [2014],
‘Glue-Chapter8
VaR risk measures in capital allocation applications’,Insurance: Mathematics and Economics 58, 132–137. [Belles-Sampera et al., 2014b]
In addition, the work done in the master thesis generated as an out-put another publication, which is also linked to some of the contents included in the present dissertation:
Belles-Sampera, J. and Santolino, M. [2013], ‘Asignación óptima
de capital en base al perfil de riesgo de las instituciones de in-versión colectiva: una aplicación de las medidas de riesgo dis-torsionadas’, Revista de Métodos Cuantitativos para la Economía y la Empresa15(2),65–86. [Belles-Sampera and Santolino,2013b]
I have been authorized by the coauthors of the previous publica-tions, Dr. Montserrat Guillén, Dr. José M. Merigó and Dr. Miguel A. Santolino, to compile all those ideas and figures in the present work, and to be considered, to all effects, the author of this dissertation.
awa r d s
Chapters1,2,3 and8 were compiled in a monograph entitled New
risk measures for solvency purposes in insurance companies, which re-ceived in October2014the ‘Premi Ferran Armengol i Tubau’ awarded
by the Catalan Society of Economy. Barcelona, May2015
C O N T E N T S
i i n t r o d u c t i o n 1
ii o n r i s k m e a s u r e s a n d a g g r e g at i o n f u n c t i o n s 11
1 b e y o n d va l u e-at-r i s k 13
1.1 Overview on risk measures . . . 14
1.2 Distortion risk measures . . . 15
1.3 A new family of risk measures: GlueVaR . . . 17
1.4 Linear combination of risk measures . . . 18
1.4.1 Analytical closed-form expressions of GlueVaR 20 1.4.2 The Cornish-Fisher approximation of GlueVaR . 23 1.5 Relationship between GlueVaR and Tail Distortion risk measures . . . 24
2 ta i l-s u b a d d i t i v i t y f o r a pa i r o f r i s k s 27 2.1 Subadditivity in the tail . . . 27
2.2 Risk attitudes in GlueVaR . . . 29
2.3 Geometrical discussion on risk attitudes . . . 30
3 r i s k m e a s u r e m e n t w i t h g l u e va r 31 3.1 An example of risk measurement on claim costs . . . . 31
3.2 Insights on the tail-subadditivity property . . . 34
3.3 An example of tail-subadditivity on claim costs . . . . 35
4 d i s t o r t i o n r i s k m e a s u r e s a n d o r d e r e d av e r a g -i n g o p e r at o r s 39 4.1 Ordered averaging operators and the Choquet integral 40 4.2 Relating distortion risk measures and ordered averag-ing operators . . . 48
4.3 First interpretations of the local degree of orness . . . . 54
4.4 An illustration . . . 55
5 i n d i c at o r s f o r d i s c r e t e c h o q u e t i n t e g r a l s 59 5.1 Averaging operators and capacities . . . 60
5.2 Indicators for aggregation operators . . . 61
5.2.1 Indicators associated with ordered weighted av-eraging operators . . . 61
5.2.2 Existing indicators extended to the Choquet in-tegral . . . 64
5.3 New indicators extended to the Choquet integral . . . 66
5.4 Indicators with respect to a linear combination of ca-pacities . . . 70
5.4.1 Linearity features of the extended indicators . . 70
5.4.2 Application: inherited indicators of probabilis-tic ordered weighted averaging operators . . . . 72
6 o n t h e i m p l i c i t r i s k at t i t u d e o f a d i s t o r t i o n r i s k
m e a s u r e 75
6.1 Risk attitude of agents . . . 76
6.1.1 Degree of orness and risk attitude . . . 77
6.1.2 Graphical analysis of risk attitude . . . 80
6.2 An example on claim costs . . . 83
6.2.1 Risk assessment in a scenario involving changes in worst losses . . . 84
6.2.2 Calibration of GlueVaR parameters . . . 84
6.2.3 Results . . . 86
iii o n c a p i ta l a l l o c at i o n p r o b l e m s a n d a g g r e g a -t i o n f u n c -t i o n s 93 7 a n ov e r w i e w o n c a p i ta l a l l o c at i o n p r o b l e m s 95 7.1 Main concepts and notation . . . 96
7.2 Review of some particular principles . . . 99
7.2.1 The gradient allocation principle . . . 99
7.2.2 Other proportional capital allocation principles based on partial contributions . . . 103
7.2.3 The excess based allocation principle . . . 107
8 c o n t r i b u t i o n s t o c a p i ta l a l l o c at i o n b a s e d o n g l u e va r 109 8.1 Risk capital allocation following the Haircut principle . 109 8.2 Proportional risk capital allocation principles using Glue-VaR . . . 112
8.2.1 Stand-alone proportional allocation principles us-ing GlueVaR . . . 113
8.2.2 Proportional allocation principles based on par-tial contributions using GlueVaR . . . 113
8.3 An example of risk capital allocation on claim costs . . 114
8.4 Further comments on these contributions . . . 116
9 c a p i ta l a l l o c at i o n p r i n c i p l e s a s c o m p o s i t i o na l d ata 121 9.1 The simplex and its vectorial and metric structure . . . 121
9.1.1 From capital allocation principles to composi-tional data and backwards . . . 124
9.2 Simplicial concepts applied to capital allocation . . . . 124
9.2.1 Cost of risk, reward to riskless and reward on return&risk principles . . . 125
9.2.2 Ranking principles using the simplicial distance 126 9.2.3 Averaging principles using the simplicial arith-metic mean . . . 127
9.2.4 An illustration . . . 127
iv c o n c l u s i o n s 133
v a p p e n d i x 141
a a p p e n d i x 143
a.1 Equivalent expression for the GlueVaR distortion function143
a.2 Bijective relationship between heights and weights as
parameters for GlueVaR risk measures . . . 144
a.3 Tail-subadditivity for GlueVaR risk measures . . . 144
a.4 Relationship between GlueVaR and Tail Distortion risk
measures . . . 146
a.5 Proof of the ordered weighted averaging operator
unique-ness . . . 147
a.6 An ascending quadratic weighted additive set function
is a capacity defined onN . . . 147
a.6.1 Two particular cases of AQWA capacities . . . 150
a.7 Proof of Proposition5.3.1 . . . 153
a.8 Results for global degree of orness in Chapter6 . . . . 155
b i b l i o g r a p h y 157
L I S T O F F I G U R E S
Figure1.1 Examples of GlueVaR distortion functions . . . 19 Figure2.1 Feasible weights for GlueVaR risk measures . . 30 Figure6.1 Approximated areas under distortion functions
of VaR and TVaR . . . 79 Figure6.2 Quotient functions of VaR and TVaR . . . 82 Figure6.3 Graphical information provided byQ
κω1β,α,ω2. . 83 Figure6.4 Quotient functions of optimal solutions (local
orness) . . . 90 Figure9.1 Example of ranking capital allocation
princi-ples using the simplicial distance . . . 131 Figure A.1 Quotient functions of optimal solutions (global
orness) . . . 156
L I S T O F TA B L E S
Table1.1 VaR and TVaR distortion functions . . . 17 Table1.2 Analytical closed-form expressions for GlueVaR 22 Table3.1 Risk assessment with quantile-based risk
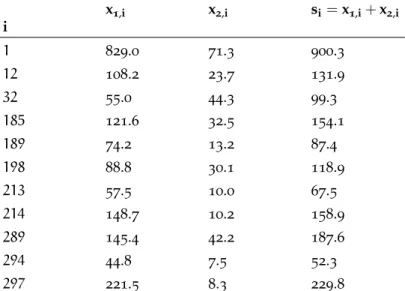
mea-sures . . . 33 Table3.2 Example of common5%-right tail for a pair of
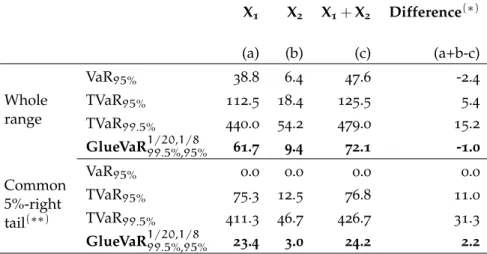
risks . . . 37 Table3.3 Illustrative comparison between subadditivity
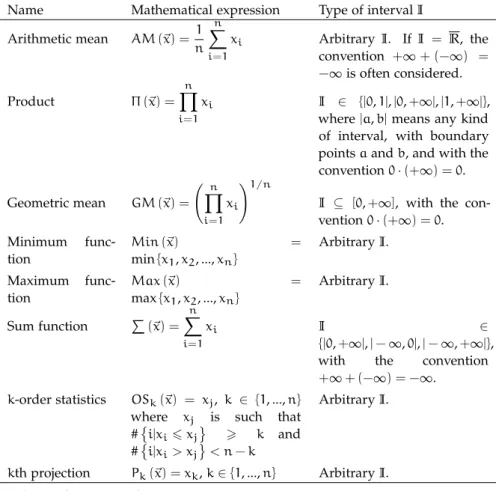
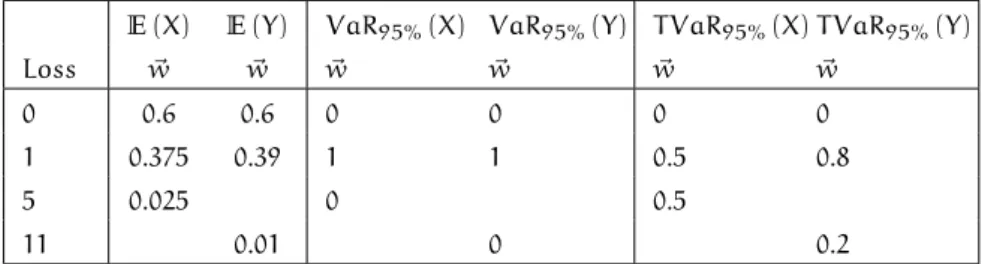
and tail-subadditivity . . . 38 Table4.1 Basic aggregation operators. . . 41 Table4.2 Example of loss random variables X and Y. . . 56 Table4.3 Distorted probabilities in the ordered weighted
averaging operators forXandY . . . 56 Table4.4 Distortion risk measures and the associated
lo-cal degree of orness forXandY. . . 57 Table4.5 Weighted ordered weighted averaging
opera-tor vecopera-tors linked to disopera-tortion risk measures forXandY. . . 57 Table5.1 Summary of indicators associated with ordered
weighted averaging operators . . . 61 Table5.2 Summary of existing indicators extended to the
Choquet integral . . . 66 Table5.3 Summary of new indicators extended to the
Choquet integral. . . 71
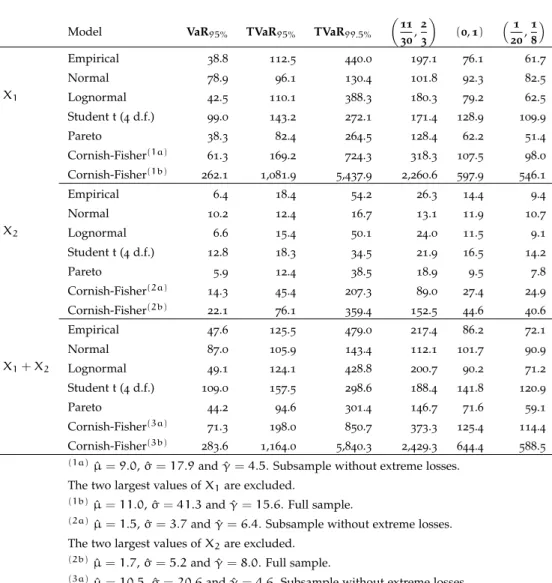
Table 6.1 Boundary values of local degree of orness of
calibrated GlueVaR . . . 88 Table 8.1 Risk assessment of claim costs using GlueVaR
risk measures . . . 115 Table 8.2 Proportional capital allocation solutions using
GlueVaR for the claim costs data . . . 117 Table 9.1 Illustration: Absolute and relative capital
allo-cation principles . . . 128 Table 9.2 Inverse allocation principles . . . 130 Table 9.3 Average of the three capital allocation
princi-ples from Table9.1. . . 132 Table A.1 Boundary values of global degree of orness of
calibrated GlueVaR . . . 156
Part I
I N T R O D U C T I O N
b a c k g r o u n d a n d m o t i vat i o n
Since the appearance in 1988 of the first Basel Capital Accord for
worldwide banking, quantitative risk management has become an es-sential instrument both in the financial and the insurance sectors. The Bank of International Settlements (BIS) was the leader of this agree-ment, which has been updated twice: once in year 2004 (Basel II
agreement) and once more in 2010 after the worldwide spread of
the last financial crisis (Basel III accord, see http://www.bis.org/ list/bcbs/index.htm). The European Commission with the assis-tance of the European Insurance and Occupational Pensions Author-ity (EIOPA) has been developing, in parallel, the Solvency II regula-tory framework for the insurance sector (see http://ec.europa.eu/ internal_market/insurance/solvency/index_en.htm). The growing interest for quantitative risk management has possibly taken place be-cause all the decision makers involved in the financial industry have endorsed it: from entities to local supervisory authorities, including audit, consultancy and advisory firms.
Quantitative risk management is one of the main concerns of man-agement teams in the insurance and financial sectors. Among all the possible elements of interest that can be associated to this topic, it is my belief that risk measurement and the duality of risk aggregation and disaggregation are two key issues. This dissertation tries to shed some light on them.
This work is focused on the study of risk measures and solutions to capital allocation problems, and their suitability to answer practi-cal questions in the framework of insurance and financial institutions.
The selection of appropriate risk measures and of solutions to cap-ital allocation problems are issues under on-going discussion among researchers and practitioners. Insurance firms are subject to the capi-tal requirements established by regulators’ guidelines and directives. These requirements are typically equal to, or proportional to, a risk measure value that determines a minimum cushion of economic liq-uidity. The selection of such risk measures and tolerance levels is crucial therefore from the regulators’ point of view.
Companies in the insurance sector prefer to minimize the level of capital reserves required by solvency regulations, because they must contend with many restrictions on how this capital can be invested and, as such, the return on their capital reserves is usually lower than that provided by other opportunities. For this reason, companies typically favor regulations that impose risk measures and tolerance levels that are not overly conservative. Managers also prefer simple, straightforward risk measures rather than more complicated alterna-tives, since they claim that the former are more easily communicated.
From the regulators’ perspective, controlling the risk of insurance companies is fundamental in order to protect consumers and investors, which may have conflicting objectives. Strict solvency capital require-ments may limit the capacity of firms, but they also reassure con-sumers and guarantee the position of the insurance industry in the economy. Thus, the debate as to what constitutes a suitable risk mea-sure and what represents a suitable tolerance level is interminable, without apparently having been much investigation as to what might represent an appropriate compromise.
So with respect to risk measures, it seemed adequate to deepen in advantages and pitfalls of most commonly used risk measures in the actuarial and financial sectors, because the discussion could re-sult attractive both to practitioners and supervisor authorities. This perspective allowed to list some of the additional proposals that can be found in the academic literature and, even, to devise some alterna-tives.
Capital allocation problems fall on the disaggregation side of risk management. These problems are associated to a wide variety of pe-riodical management tasks inside the entities. In an insurance firm, for instance, risk capital allocation by business lines is a fundamen-tal element for decision making from a risk management point of view. A sound implementation of capital allocation techniques may help insurance companies to improve their underwriting risk and to adjust the pricing of their policies, so to increase the value of the firm. This piece of work is, to some extent, a theoretical study. Departing from an appropriate literature review, theoretical connections have been deduced. Nonetheless, the obtained theoretical results may be applied in practice. In order to support this statement, most of the theoretical developments have been illustrated with examples, which have been chosen as close to real practice as possible.
o u t l i n e o f t h e t h e s i s
This dissertation is structured in five parts. The first one is this introduction, while the fourth part is devoted to conclusions. The part number five contains the Appendix. The contributions of this thesis are exposed in the central parts, where they have been grouped as follows. The part number two consists of six chapters (from number
1 to 6) dedicated to investigate risk measures and their relationship
with aggregation operators. The third part is devoted to provide an overview on capital allocation problems and to highlight how these problems may be related to aggregation functions. The last three chapters (from number 7 to 9) belong to this part. In what follows,
some comments on the content of each chapter are presented, in order to get an overall picture of the work that has been done.
Chapter1- Beyond Value-at-Risk
A new family of risk measures, called GlueVaR, is defined within the class of distortion risk measures. The relationship between Glue-VaR, Value-at-Risk (VaR) and Tail Value-at-Risk (TVaR) is explained. Analytical closed-form expressions are shown for the most frequently used distribution functions in financial and insurance applications, as well as first order Cornish-Fisher approximations for general skewed distribution functions. In addition, relationships between GlueVaR and Tail Distortion risk measures are shown to close this first chap-ter.
Chapter2- Tail-subadditivity for a pair of risks
This chapter is devoted to the definition of tail-subadditivity for a pair of risks given a confidence level, and to discuss the reasons for introducing this new property for risk measures in general. The tail-subadditivity for a pair of risks is, to some extent, a property of risk measures concerning their ability to indicate the benefits of diversification in extremely adverse situations. A proposition that states which GlueVaR risk measures are likely to meet that property is proven, and the chapter ends with a first discussion on the rela-tionship between GlueVaR parameters and attitudes regarding risk measurement.
Chapter3- Risk measurement with GlueVaR
This chapter is devoted to illustrate different practical situations in which GlueVaR can be used. Two examples are presented. The same data set on insurance claim costs is used in both examples. One of them shows the values that different risk measures belonging to
the GlueVaR family give to a set of random variables. Different as-sumptions on the type of distribution function that characterize these random variables are considered. The second one illustrates the tail-subadditivity property and compares it with the tail-subadditivity prop-erty.
Chapter4- Distortion risk measures and ordered averaging operators Distortion risk measures summarize the risk of a loss distribution by means of a single value. In fuzzy systems, the ordered weighted averaging (OWA) and weighted ordered weighted averaging (WOWA) operators are used to aggregate a large number of fuzzy rules into a single value. In this chapter it is shown that these concepts can be derived from the Choquet integral, and then the mathematical rela-tionship between distortion risk measures and the OWA and WOWA operators for discrete and finite random variables is presented. This connection offers a new interpretation of distortion risk measures and, in particular, Value-at-Risk and Tail Value-at-Risk can be un-derstood from an aggregation operator perspective. The theoretical results are numerically illustrated and the local degree of orness con-cept is discussed.
Chapter5- Indicators for the discrete Choquet integrals
As it has already been mentioned in the previous chapter, ordered weighted averaging operators are powerful tools used in numerous decision-making problems and each OWA may be understood as a discrete Choquet integral. Aggregation operators are usually charac-terized by indicators. In this chapter four indicators usually associ-ated with the OWA operator are extended to the discrete Choquet integral: namely, the degree of balance, the divergence, the variance indicator and Rényi entropies. All of these summarizing indicators are considered from a local and a global perspective. Linearity of indicators for linear combinations of capacities is investigated and, to illustrate the usefulness of results, indicators of the probabilistic ordered weighted averaging (POWA) operator are derived.
Chapter6- On the implicit risk attitude of a distortion risk measure Understanding the risk attitude that is implicit in a risk assessment is crucial for decision makers. This chapter takes advantage of all the work made in the previous ones to characterize the underlying risk at-titude involved in the choice of a risk measure, where it belongs to the family of distortion risk measures. A two-stage strategy is developed therein to reach this goal. First, it is shown that aggregation indicators defined for discrete Choquet integrals provide valuable information
related to the implicit risk attitude in aggregate terms, which leads to the definition of overall risk attitude. In the second stage a graphical analysis based on the distortion function is carried out to provide a lo-cal description of the underlying risk behavior. Here, the concepts of absolute risk attitude andspecific risk attitudearise in a natural manner. The data set of insurance claim costs used in chapter3is used again to provide an example that shows the usefulness of this strategy in practice. This strategy is followed to solve a feasible problem that in-surance companies under the Solvency II regulatory framework could face, and the impact of extreme observations is analyzed.
Chapter7- An overview on capital allocation problems
There is a strong relationship between risk measures and capital allocation problems. Briefly speaking, it may be assumed that each solution to a capital allocation problem is determined by a capital allocation criterion and a given risk measure. This chapter is intended to detect additional key elements involved in a solution of a capital allocation problem, in order to obtain a detailed initial picture on risk capital allocation proposals that can be found in the academic literature.
Personal notations and points of view are stated here and used from this point forward. Additionally, some particular solutions of interest are commented, trying to highlight both advantages and drawbacks of each one of them.
Chapter8- Contributions to capital allocation based on GlueVaR
This chapter is devoted to show how GlueVaR risk measures can be used for risk measurement purposes and to solve problems of propor-tional capital allocation through examples. The same data set is ana-lyzed in both situations and, once more, it is the data set on insurance claim costs used in previous chapters. Regarding capital allocation, a first theoretical step is done for convenience: the capital allocation framework suggested by Dhaene et al. [2012b] is generalized to
al-low the application of the Value-at-Risk measure in combination with a stand-alone proportional allocation criterion (i.e., to accommodate the Haircut allocation principle). Afterwards, two new proportional capital allocation principles based on GlueVaR risk measures are de-fined an the example is presented, in which allocation solutions with tail-subadditive GlueVaR risk measures are discussed and compared with the solutions obtained when using the rest of alternatives.
Chapter9- Capital allocation principles as compositional data
In the last chapter, some connections between capital allocation problems and aggregation operators are emphasized. The approach is based on functions and operations defined in the standard simplex which, to best of my knowledge, remained an unexplored approach. Appendix
Some of the largest or most intricate proofs have been gathered in the appendix to ease the reading.
p r e l i m i na r y d e f i n i t i o n s
A few preliminary comments, notations and definitions should be helpful to keep this dissertation as self-contained as possible.
Definition 1 (Probability space). A probability space is defined by three elements (Ω,A,P). The sample spaceΩ is a set of the possible events of a random experiment, Ais a family of the set of all subsets ofΩ(denoted as
A∈℘(Ω)) with aσ−algebra structure, and the probabilityPis a mapping from A to [0,1]such that P(Ω) = 1, P(∅) = 0 and P satisfies theσ−
additivityproperty.
A probability space is finite if the sample space is finite, i.e. Ω = {$1,$2, ...,$n}. Then ℘(Ω)is theσ−algebra, which is denoted as 2Ω. In the rest of this work, Ninstead ofΩ andm instead of$ are used when referring to finite probability spaces. Hence, the notation is N,2N,P, whereN={m1,m2,. . .,mn}.
Definition 2(Random variable). Let(Ω,A,P) be a probability space. A random variable Xis a mapping fromΩtoR such thatX−1((−∞,x]) := {$∈Ω:X($)6x}∈A,∀x∈R.
A random variableX is discrete ifX(Ω) is a finite set or a numer-able set without cumulative points.
Definition 3 (Distribution function of a random variable). LetXbe a random variable. The distribution function of X, denoted byFX, is defined byFX(x) :=P X−1((−∞,x])
≡P(X6x).
The distribution function FX is non-decreasing, right-continuous and lim
x→−∞FX(x) = 0and limx→+∞FX(x) = 1. The survival function of
X, denoted by SX, is defined by SX(x) := 1−FX(x), for all x ∈ R. Note that the domain of the distribution function and the survival function is Reven ifXis a discrete random variable. In other words, FX andSX are defined forX(Ω) = {x1,x2, ...,xn, ...} but also for any x∈R.
Definition 4 (Risk measure). Let Γ be the set of all random variables defined for a given probability space(Ω,A,P). A risk measure is a mapping ρfromΓ toR, soρ(X)is a real value for eachX∈Γ.
Part II
O N R I S K M E A S U R E S A N D A G G R E G AT I O N F U N C T I O N S
1
B E Y O N D VA L U E - AT - R I S KValue-at-Risk (VaR) has been adopted as a standard tool to assess the risk and to calculate capital requirements in the insurance indus-try. Value-at-Risk at level αis theα-quantile of a random variableX (which is often called loss), i.e.
VaRα(X) =inf{x|FX(x)>α}=F−X1(α) ,
where FX is the cumulative distribution function (cdf) ofX andα is the confidence or the tolerance level 0 6 α 6 1. However, VaR is known to present a number of pitfalls when applied in practice. A disadvantage when using VaR in the insurance or financial contexts is that the capital requirements for catastrophic losses based on this measure can be underestimated, i.e. the necessary reserves in adverse scenarios may well be less than they should be. The underestima-tion of capital requirements may be aggravated when fat-tailed losses are incorrectly modeled by mild-tailed distributions, such as the Nor-mal distribution. There are attempts to overcome this kind of model risk when using VaR or, at least, to quantify the risk related to the modelling [Alexander and Sarabia, 2012]. But, in addition, a second
drawback is that the VaR may fail the subadditivity property. A risk measure is subadditive when the aggregated risk is less than or equal to the sum of individual risks. Subadditvity is an appealing property when aggregating risks in order to preserve the benefits of diversifi-cation. VaR is subadditive for elliptically distributed losses [McNeil et al., 2005]. However, the subadditivity of VaR is not granted, as
indicated inArtzner et al.[1999] andAcerbi and Tasche[2002].
Tail Value-at-Risk (TVaR) is defined as TVaRα(X) = 1
1−α
Z1 α
VaRλ(X)dλ.
Roughly speaking, the TVaR is understood as the mathematical ex-pectation beyond VaR. The TVaR risk measure does not suffer the two drawbacks discussed above for VaR and, as such, would appear to be a more powerful measure for assessing the actual risks faced by insurance companies and financial institutions. However, TVaR has not been widely accepted by practitioners in the financial and in-surance industry. VaR is currently the risk measure contemplated in the European solvency regulation for the insurance sector (Solvency II), and this is also the case of solvency regulation for the banking sector (Basel accords). The TVaR measures average losses in the most
14 1 b e y o n d va l u e-at-r i s k
adverse cases rather than just the minimum adverse loss, as the VaR does. Therefore, capital reserves based on the TVaR have to be con-siderably higher than those based on VaR and significant differences in the size of capital reserves can be obtained depending on which risk measure is adopted.
This chapter is motivated, therefore, by an attempt to respond to the following question. Can a risk measure be devised that would provide a risk assessment that lies somewhere between that offered by the VaR and the TVaR? To this end, a new family of risk measures (GlueVaR) is proposed, which forms part of a wider class referred to as distortion risk measures. The subadditivity properties of these GlueVaR risk measures are analyzed and it is shown that a subfamily of GlueVaR risk measures satisfies tail-subadditivity.
GlueVaR risk measures are defined by means of a four-parameter function. By calibrating the parameters, GlueVaR risk measures can be matched to a wide variety of contexts. Specifically, once a con-fidence level has been fixed, the new family contains risk measures that lie between those of VaR and TVaR and which may adequately reflect the risk of mild-tailed distributed losses without having to re-sort to VaR. In certain situations, however, more conservative risk measures even than TVaR may be preferred. It is shown that these highly conservative risk measures can also be defined by means of the GlueVaR family. Analytical closed-form expressions of GlueVaR for commonly used statistical distributions in the insurance context are derived. These closed-form expressions should enable practitioners to undertake an effortless transition from the use of VaR and TVaR to GlueVaR. First order Cornish-Fisher approximations to GlueVaR risk measures for general skewed distribution functions are also in-troduced in this chapter. Finally, the relationship between GlueVaR and Tail Distortion risk measures is shown.
1.1 ov e r v i e w o n r i s k m e a s u r e s
Two main groups of axiom-based risk measures are coherent risk measures, as stated byArtzner et al.[1999], anddistortion risk measures,
as introduced by Wang[1996] and Wang et al. [1997]. Concavity of
the distortion function is the key element to define risk measures that belong to both groups [Wang and Dhaene,1998]. Suggestions on new
desirable properties for distortion risk measures are proposed in Bal-bás et al. [2009], while generalizations of this kind of risk measures
can be found, among others, inHürlimann[2006] andWu and Zhou
[2006]. As shown inGoovaerts et al. [2012], it is possible to link
1.2 Distortion risk measures 15
developed in the literature.
The axiomatic setting for risk measures has extensively been de-veloped since seminal papers on coherent risk measures and dis-tortion risk measures. Each set of axioms for risk measures corre-sponds to a particular behavior of decision makers under risk, as it has been shown, for instance, in Bleichrodt and Eeckhoudt [2006]
and Denuit et al. [2006]. Most often, articles on axiom-based risk
measurement present the link to a theoretical foundation of human behavior explicitly. For example, Wang[1996] shows the connection
between distortion risk measures and Yaari’s dual theory of choice under risk; Goovaerts et al. [2010b] investigate the additivity of risk
measures in Quiggin’s rank-dependent utility theory; and Kaluszka and Krzeszowiec [2012] introduce the generalized Choquet integral
premium principle and relate it to Kahneman and Tversky’s cumula-tive prospect theory.
Many articles have appeared in recent years that pay attention to risk measures based on distortion functions or on generalizations of the quantiles. An example of the first group is Zhu and Li [2012].
Bellini and Gianin[2012] and Bellini et al.[2014] fit to second group.
An interplay between both groups is found in Dhaene et al. [2012a]
andGoovaerts et al.[2012].
1.2 d i s t o r t i o n r i s k m e a s u r e s
Consider a probability space and the set of all random variables defined on this space. Any risk measure [see, for instance, Szëgo,
2002] ρ is a mapping from the set of random variables to the real
line R, X 7→ ρ(X) ∈ R. Distortion risk measures were introduced by Wang [Wang,1995,1996] and are closely related to the distortion
expectation theory [Yaari,1987]. A review on how risk measures can
be interpreted from several perspectives is provided inTsanakas and Desli[2005], and a clarifying explanation of the relationship between
distortion risk measures and distortion expectation theory is included. A detailed literature review of distortion risk measures is available in [Denuit et al., 2005;Balbás et al., 2009]. There are two key elements
to define a distortion risk measure: first, the associated distortion function; and, second, the concept of the Choquet [Choquet, 1954]
Integral. The distortion function, Choquet Integral and the distortion risk measure can be defined as follows:
Distortion function. Let g : [0,1] → [0,1] be a function such that g(0) = 0, g(1) = 1 and g is injective and non-decreasing. Thengis called a distortion function.
16 1 b e y o n d va l u e-at-r i s k
Choquet Integral The (asymmetric) Choquet Integral with re-spect to a set function µof aµ-measurable functionX:Ω→R is denoted as Z Xdµand is equal to Z Xdµ= Z0 −∞ Sµ,X(x) −µ(Ω) dx+ Z+∞ 0 Sµ,X(x)dx, if µ(Ω) < ∞, where Sµ,X(x) = µ({X > x}) denotes the survival functionofXwith respect toµ. Note thatΩdenotes a set, which in financial and insurance applications is the sample space of a probability space. A set function µ in this context is a func-tion defined from 2Ω (the set of all subsets of Ω) to R. A µ-measurable function X is, widely speaking, a function defined on Ωsuch that expressions like µ({X > x}) orµ({X6x}) make sense. SeeDenneberg[1994] for more details.
Distortion risk measure. Let g be a distortion function. Con-sider a random variable X and its survival function SX(x) =
P(X > x). Functionρg defined by ρg(X) = Z0 −∞ [g(SX(x)) −1]dx+ Z+∞ 0 g(SX(x))dx is called a distortion risk measure.
From the previous definitions, it is straightforward to see that for any random variable X, ρg(X) is the Choquet Integral of X with re-spect to the set functionµ=g◦P, wherePis the probability function associated with the probability space in whichXis defined.
The mathematical expectation is a distortion risk measure whose distortion function is the identity function [Denuit et al., 2005], this
is, ρid(X) = E(X). Therefore, a straightforward way to interpret a distortion risk measure is as follows: first, the survival function of the random variable is distorted (g◦SX); second, the mathematical expectation of the distorted random variable is computed. From a theoretical point of view, note that this interpretation fits the discus-sion that risk may be defined as an expected value in many situations [Aven,2012].
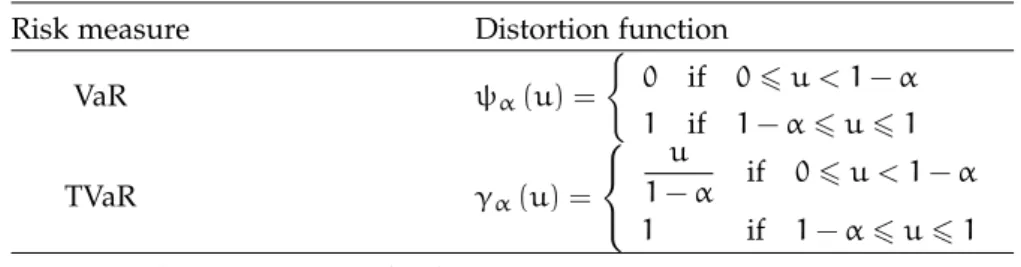
VaR and TVaR measures are in fact distortion risk measures. The associated distortion functions of these risk measures are shown in Table1.1.
Based on the distortion functions shown in Table1.1, onceαis fixed it can be proved that VaRα(X)6TVaRα(X)for any random variable X.
1.3 A new family of risk measures: GlueVaR 17
Table1.1: VaR and TVaR distortion functions Risk measure Distortion function
VaR ψα(u) = 0 if 06u < 1−α 1 if 1−α6u61 TVaR γα(u) = u 1−α if 06u < 1−α 1 if 1−α6u61
For a confidence levelα∈(0,1).
Remark1.2.1. Letgandg∗be two distortion functions and letρg andρg∗ be their respective distortion risk measures. Suppose thatg(u)6g∗(u)for allu∈[0,1]. Thenρg(X)6ρg∗(X)for any random variableX.
This result follows immediately from the definition of distortion risk mea-sures, because ρg(X) = Z0 −∞ [g(SX(x)) −1]dx+ Z+∞ 0 g(SX(x))dx6 Z0 −∞ [g∗(SX(x)) −1]dx+ Z+∞ 0 g∗(SX(x))dx=ρg∗(X). 1.3 a n e w f a m i ly o f r i s k m e a s u r e s: g l u e va r
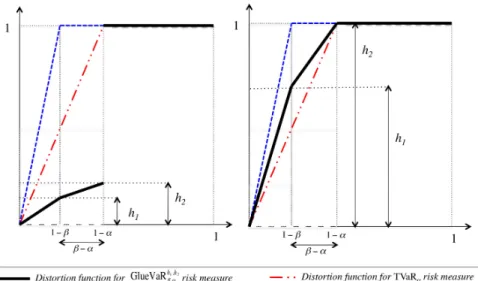
A new family of risk measures, named GlueVaR, is here defined. Any GlueVaR risk measure can be described by means of its distor-tion funcdistor-tion. Given a confidence level α, the distortion function for GlueVaR is: κh1,h2 β,α (u) = h1 1−β·u, if 06u < 1−β h1+ h2−h1 β−α ·[u− (1−β)], if 1−β6u < 1−α 1, if 1−α6u61 (1.1)
whereα,β∈[0,1]such thatα6β,h1∈[0,1]andh2 ∈[h1,1]. Param-eter β is the additional confidence level besidesα. The shape of the GlueVaR distortion function is determined by the distorted survival probabilitiesh1 andh2 at levels1−βand1−α, respectively. We call parametersh1 andh2 the heights of the distortion function.
A wide range of risk measures may be defined under this frame-work. Note that VaRα and TVaRα are particular cases of this new family of risk measures. Namely, VaRα and TVaRα correspond to
18 1 b e y o n d va l u e-at-r i s k
distortion functionsκ0α,,0α andκ1α,,1α, respectively. By establishing
suit-able conditions on the heightsh1 andh2, the GlueVaR family is very flexible. For example, risk managers might like to selectα,β,h1 and h2 so that
VaRα(X)6GlueVaRh1,h2
β,α (X)6TVaRα(X) :
this can be achieved by selecting a set of parameters for their associ-ated distortion functions to ensure that ψα(u) 6 κhβ1,α,h2(u) 6 γα(u) for any u ∈ [0,1], following remark 1.2.1, i.e. by forcing condition h1 6
1−β
1−α. An example of such a case is shown in Figure 1.1 (left-hand side).
The GlueVaR family also allows us to define a highly conservative risk measure GlueVaRh1,h2
β,α , such that TVaRα(X)6GlueVaRh1,h2
β,α (X)6TVaRβ(X) for anyXand that the associated distortion functionκh1,h2
β,α is concave in [0,1]. In this case, 1−β
1−α 6 h1 and h2 = 1 must be fulfilled, as occurs in the example shown in Figure1.1(right-hand side).
1.4 l i n e a r c o m b i nat i o n o f r i s k m e a s u r e s
Given a random variableXand for fixed tolerance levels αand β so thatα < β, GlueVaRh1,h2
β,α (X)can be expressed as a linear combina-tion of TVaRβ(X), TVaRα(X) and VaRα(X). This result allows us to translate the initial graphical-based construction of GlueVaR risk mea-sures into an algebraic construction based on standard risk meamea-sures.
If the following notation is used,
ω1 = h1− (h2−h1)·(1−β) β−α ω2 = h2−h1 β−α ·(1−α) ω3 = 1−ω1−ω2 =1−h2, (1.2)
then the distortion function κh1,h2
β,α (u) in (1.1) may be rewritten as (details can be found in the Appendix):
κh1,h2
β,α (u) =ω1·γβ(u) +ω2·γα(u) +ω3·ψα(u) (1.3) whereγβ, γα,ψαare the distortion functions of TVaR at confidence levels β and α and of VaR at confidence level α, respectively (see Table1.1). Therefore GlueVaR is a risk measure that can be expressed
1.4 Linear combination of risk measures 19
Figure1.1: Examples of GlueVaR distortion functions.
Left. Distortion function is concave in[0,1−α)and VaRα(X)6
GlueVaRh1,h2
β,α (X)6TVaRα(X)for a random variableX;
Right. Distortion function is concave in the whole range [0,1]
and TVaRα(X)6GlueVaRβh1,α,h2(X) 6TVaRβ(X)for a random
20 1 b e y o n d va l u e-at-r i s k
as a linear combination of three risk measures: TVaR at confidence levelsβandαand VaR at confidence levelα,
GlueVaRh1,h2
β,α (X) =ω1·T VaRβ(X) + ω2·T VaRα(X) +ω3·VaRα(X).
(1.4)
Given this relationship, some abuse of notation may be employed for GlueVaRh1,h2
β,α (X)and its related distortion function. The notation GlueVaRω1,ω2
β,α (X) or κ ω1,ω2
β,α (u) may, on occasions, be preferred to that based on heights h1 andh2. The bijective relationship between pairs(h1,h2)and(ω1,ω2)is also shown in the Appendix.
Specifically, in order to simplify the statement of Proposition1.5.1, the expression ofκω1,ω2 β,α (u)is κω1,ω2 β,α (u) = ω1 1−β+ ω2 1−α ·u if 06u < 1−β ω1+ ω2 1−α·u if 1−β6u < 1−α 1 if 1−α6u61 (1.5)
1.4.1 Analytical closed-form expressions of GlueVaR
A useful consequence of (1.4) is that when analytical closed-form expressions of VaRα(X)and TVaRα(X)are known for a random vari-able X, the closed-form expression of GlueVaRh1,h2
β,α (X) can automat-ically be derived without further complications. Otherwise, using the definition of GlueVaR as a distortion risk measure, the Choquet Integral of X with respect to the set function κh1,h2
β,α ◦P should be calculated.
1.4.1.1 Illustration: GlueVaR expression for Studenttdistribution
Let Xbe a random variable such that ˜X = X−µ
σ is distributed as a Studenttrandom variable withνdegrees of freedom (df). In such that case, X has µ mean and a standard deviation equal to
q ν·σ2 ν−2. Then VaRα(X) =µ+σ·tα T VaRα(X) =µ+σ·τ(tα) 1−α · ν+t2α ν−1 ,
wheretαis theα-quantile of a Studenttdistribution withνdf andτ is its density function.
1.4 Linear combination of risk measures 21
Using (1.4) the GlueVaR ofXrandom variable is GlueVaRh1,h2 β,α (X) =ω1· " µ+σ·τ tβ 1−β · ν+t2 β ν−1 !# + ω2· µ+σ·τ(tα) 1−α · ν+t2α ν−1 + (1−ω1−ω2)·(µ+σ·tα) = =µ+σ· " h1 1−β− h2−h1 β−α ·τ tβ · ν+t 2 β ν−1 ! + h2−h1 β−α ·τ(tα)· ν+t2α ν−1 + (1−h2)·tα .
1.4.1.2 Analytical expressions for other frequently used distributions
Normal (N), Lognormal (LN) and Generalized Pareto (GP) distri-butions have simple closed-form expressions of GlueVaR. Notation conventions are used. Namely, φandΦstand for the standard Nor-mal pdf and cdf, respectively. The standard NorNor-mal distribution α and β quantiles are denoted as qα = Φ−1(α) and qβ = Φ−1(β). For the GPdistribution, the definition provided inHosking and Wal-lis [1987] is considered, where the scale parameter is denoted by σ
and kis the shape parameter. The GPdistribution contains the Uni-form (k = 1), the Exponential (k = 0), the Pareto (k < 0) and the type II Pareto (k > 0) distributions as special cases. Closed-form expressions of GlueVaR for several distributions are presented in Ta-ble ??. Note that there are some exceptions to the general rule to deduce these closed-form expressions to be considered. WhenX fol-lows a Pareto distribution withk61and for any confidence levelα, TVaRα(X) = +∞. But whenh1 = 0GlueVaRβh1,α,h2(X) is finite. There is a compensation effect between TVaRα(X) and TVaRβ(X). This is taken into account in Table ??. This table is inspired by a similar one regarding VaR and TVaR that can be found inSandström[2011].
22 1 b e y o n d va l u e-at-r i s k Distr ibution Glue V aR h1 , h2 β , α expression Nor mal: N µ , σ 2 µ + σ · qα · ( 1 − h2 ) + σ · h2 − h1 β − α · φ ( qα ) − φ qβ + σ · h1 1 − β · φ qβ Lognor mal: LN µ , σ 2 exp ( µ + σ · qα ) · ( 1 − h2 ) + exp µ + σ 2 2 · h2 − h1 β − α · Φ ( σ − qα ) − Φ σ − qβ + exp µ + σ 2 2 · h1 1 − β · Φ σ − qβ Exponential: GP ( k , σ ) , with k = 0 σ · [ h2 − ln ( 1 − α )] + σ · ( 1 − β ) · ln 1 − β 1 − α · h2 − h1 β − α − h1 1 − β Par eto: GP ( k , σ ) , with k < 0 + ∞ if k 6 − 1 , h1 6 = 0 σ k · h 1 − ( 1 − α ) k i + h2 − h1 β − α · ( 1 − β ) · σ k · h ( 1 − β ) k − ( 1 − α ) k i + + h2 − h1 β − α · σ k + 1 · h ( 1 − α ) k + 1 − ( 1 − β ) k + 1 i if k < − 1 , h1 = 0 σ · 1 1 − α − 1 − h2 − h1 β − α · ( 1 − β ) · σ · 1 1 − β − 1 1 − α + + h2 − h1 β − α · σ · ln 1 − α 1 − β if k = − 1 , h1 = 0 σ k · h 1 − ( 1 − α ) k i + σ k · h2 − h1 β − α − h1 1 − β · h ( 1 − α ) k · ( 1 − β ) i + + h2 − h1 β − α · σ k · " k · ( 1 − α ) k + 1 k + 1 # + h2 − h1 β − α − h1 1 − β · σ k · " ( 1 − β ) k + 1 k + 1 # if k ∈ ( − 1 , 0 ) T ype II Par eto: GP ( k , σ ) , with k > 0 σ k · h 1 − ( 1 − α ) k i + σ k · h2 − h1 β − α − h1 1 − β · h ( 1 − α ) k · ( 1 − β ) i + + h2 − h1 β − α · σ k · " k · ( 1 − α ) k + 1 k + 1 # + h2 − h1 β − α − h1 1 − β · σ k · " ( 1 − β ) k + 1 k + 1 # T able 1 . 2 : Closed-for m expr essions of Glue V aR for some selected distributions
1.4 Linear combination of risk measures 23
1.4.2 The Cornish-Fisher approximation of GlueVaR
Approximations to GlueVaR risk measures for general skewed dis-tribution functions using a Cornish-Fisher expansion of their quan-tiles are provided in this section. In insurance applications managers often face to highly skewed random variables with right fat tails. In many of these situations, however, they do not know whether the underlying random variable of interest is distributed according to a known parametric distribution function. In those situations that the distribution is unknown, the value of the common quantile-based risk measures is routinely approximated by practitioners. It is shown that approximations of GlueVaR risk measures for general unknown skewed distribution functions can be straightforwardly obtained by means of the relationship of GlueVaR risk measures and the standard quantile-based risk measures.
The Cornish-Fisher expansion is widely used by practitioners to approximate the VaRα(X) and TVaRα(X) values when the random variable follows a skewed unknown distribution [see Cornish and Fisher, 1937; Fisher and Cornish,1960; Johnson and Kotz,1970;
Mc-Cune and Gray, 1982]. The VaR and TVaR measure values can be
approximated as VaRα(X) ' µ+qv,ασ and TVaRα(X) ' µ+qtv,ασ, where µ = E[X], σ2 = V[X] and both qv,α and qtv,α are modified quantiles of the standard normal distribution that take into account the skewness of the distribution function ofX.
FollowingSandström[2007], the modified quantilesqv,αandqtv,α
are computed as follows. Let us consider γ = E
h
(X−µ)3
i
/σ3 as a measure of the skewness of the distribution. If qα = Φ−1(α) andφ are the α-quantile and the density function of the standard normal distribution, respectively, thenqv,αandqtv,αcan be written as,
qv,α=Φ−1(α) + γ 6 h Φ−1(α)2 −1 i =qα+ γ 6 q2α−1, qtv,α= φ Φ −1(α) 1−α h 1+ γ 6 Φ −1(α)3i = φ(qα) 1−α h 1+ γ 6q 3 α i . Extensions of the Cornish-Fisher expansion that consider moments of higher order than γhave been provided in the literature [see, for instance,Giamouridis,2006]. More details can be found in Appendix
B ofSandström[2011].
According to the interpretation of GlueVaR measure as a linear combination of risk measures shown in (1.4), the approximation for the GlueVaR of X random variable following the Cornish-Fisher ex-pansion can be obtained as
24 1 b e y o n d va l u e-at-r i s k GlueVaRh1,h2 β,α (X)'µ+σ h1 1−β− h2−h1 β−α φ(qβ) 1+γ 6q 3 β + h2−h1 β−α φ(qα) 1+γ 6q 3 α + (1−h2) γ 6 q 2 α−1 +qα . The error of the approximation is upper bounded by the maxi-mum error incurred when approximating VaRα(X), TVaRα(X) and TVaRβ(X)using the equivalent Cornish-Fisher expansion for skewed distributions. This result is straightforwardly derived from the linear relationship shown in expression (1.4) and taking into account that weights ω1, ω2 andω3 are lower or equal than one, satisfying that ω1+ω2+ω3 =1.
1.5 r e l at i o n s h i p b e t w e e n g l u e va r a n d ta i l d i s t o r t i o n r i s k m e a s u r e s
As it has been aforementioned, different works that pay attention to risk measures based on distortion functions or based on several generalizations of quantiles have been appeared in recent years. See, for instance,Zhu and Li [2012];Bellini and Gianin[2012];Bellini et al.
[2014];Dhaene et al.[2012a] andGoovaerts et al.[2012].
Next paragraphs are devoted to reveal the connections between GlueVaR risk measures and Tail Distortion risk measures. To the best of my knowledge, Tail Distortion risk measures were introduced in Zhu and Li [2012]. Here the notation used for these family of risk
measures is adapted from that in Lv et al. [2013]. Consider a
distor-tion funcdistor-tiong, this is, a non-decreasing and injective functiongfrom
[0,1]to [0,1]such that g(0) =0 andg(1) =1, and a confidence level α∈(0,1). The Tail Distortion Risk Measure Tg,α associated tog and α is defined as the distortion risk measure with distortion function gα, where gα(u) =g u 1−α ·1[06u < 1−α] +1[1−α6u61]. In other words, ifXis a random variable representing a loss in a prob-ability space (Ω,A,P) and its survival function is SX(x) = P(X > x), therefore Tg,α(X) = Z0 −∞ [gα(SX(x)) −1]dx+ Z+∞ 0 gα(SX(x))dx . (1.6)
1.5 Relationship between GlueVaR and Tail Distortion risk measures 25
Proposition 1.5.1. Consider aGlueVaRω1,ω2
β,α risk measure with parame-tersα,β,ω1 andω2. This GlueVaR is equivalent to a Tail Distortion risk measureTg,αif, and only if,ω2 =1−ω1 and
g(t) = ω1·(1−α) 1−β +1−ω1 ·t·1h06t <(1−α)−1·(1−β)i+ (ω1+ (1−ω1)·t)·1h(1−α)−1·(1−β)6t61i. (1.7)
The proof is provided in the Appendix.
It is worth noting that only GlueVaR risk measures withω3 =0can be represented as Tail Distortion risk measures, because ω1+ω2+
ω3 = 1 must hold as part of the definition of a GlueVaRωβ,1α,ω2 risk measure. In other words, one can only represent as Tail Distortion risk measures those GlueVaR that do not give weight to VaRα.
The origin of GlueVaR risk measures is in my master’s thesis Belles-Sampera[2011]. As a curiosity, the definition of a parametric family
of risk measures named PUp-TVaR can also be found therein, which are exactly the Tail Distortion risk measures linked to Proportional Hazards Distortion functions g(u) =u1a,a> 1from the perspective