1
BioSense Functional Prioritization Survey Results
February 2015
INTRODUCTION
In November 2014, the Centers for Disease Control and Prevention (CDC) provided the BioSense Governance Group (BGG) a list of roughly 600 issues/requirements (some are fixed or duplicates) have been collected in a JIRA by CDC and BioSense contractors. The BGG has been tasked with providing a user prioritized list back to the CDC by March 1, 2015.
A small workgroup had been working through the list of issues presented to BGG from the National Syndromic Surveillance Program. This small workgroup had discussed and ordered the issues from its perspective in order of importance and then provided this to the National Syndromic Surveillance user community for 1) input, discussion and questions and 2) a voting period from February 13-19 where high priority issues were identified.
Results that were received from multiple users in a single jurisdiction were aggregated to reflect an average joint jurisdictional response. Please note: Although jurisdictional data was aggregated, there were two jurisdictional areas that had different responses within their jurisdictions at the state and local level (these were for Illinois and Utah).
Jump to Section:
Introduction
Overall Survey Results
BioSense Governance Group Results Jurisdictions Using BioSense Only Syndromic Surveillance Experience Highest Priority Per User
Conclusion/Final Rankings
OVERALL SURVEY RESULTS
Once the data was aggregated to the jurisdictional level, there were a total of 29 responses that represent jurisdictions, Federal government, and non-governmental organizations. Table 1 reflects the breakdown of responses from public health representatives.
Table 1: Public Health Representation
Answer Response %
CDC 1 3%
Department of Defense 1 3%
Veterans Administration 0 0%
Non-Governmental Organization (Provider, Associations, etc.)
2 7%
State or Territorial Public Health 18 62%
City, County, or Tribal Public Health 6 21%
Other [please indicate] 1 3%
Total 29 100%
Other [please indicate]
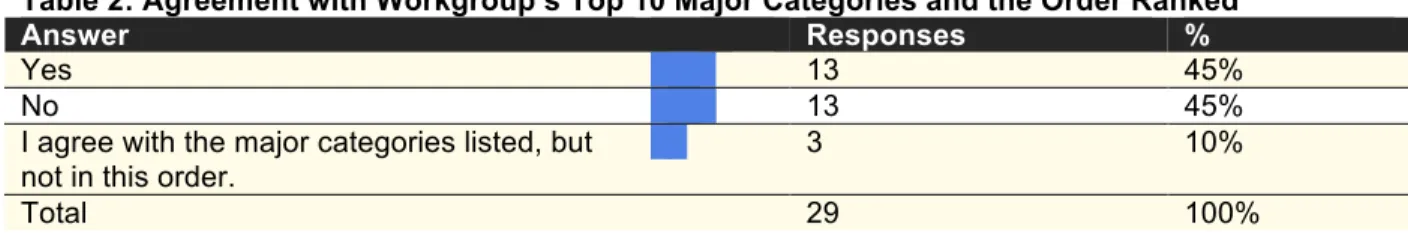
Table 2 reflects that 13 responses (45%) agreed with the workgroup’s prioritization and rankings, three responses (10%) agreed with the workgroup’s major categories, but not the ranking order, and 13 responses (45%) did not agree with the workgroup’s top 10 major categories and was asked to select their own top 10 choices and then prioritize those choices.
Table 2: Agreement with Workgroup’s Top 10 Major Categories and the Order Ranked
Answer Responses %
Yes 13 45%
No 13 45%
I agree with the major categories listed, but not in this order.
3 10%
Total 29 100%
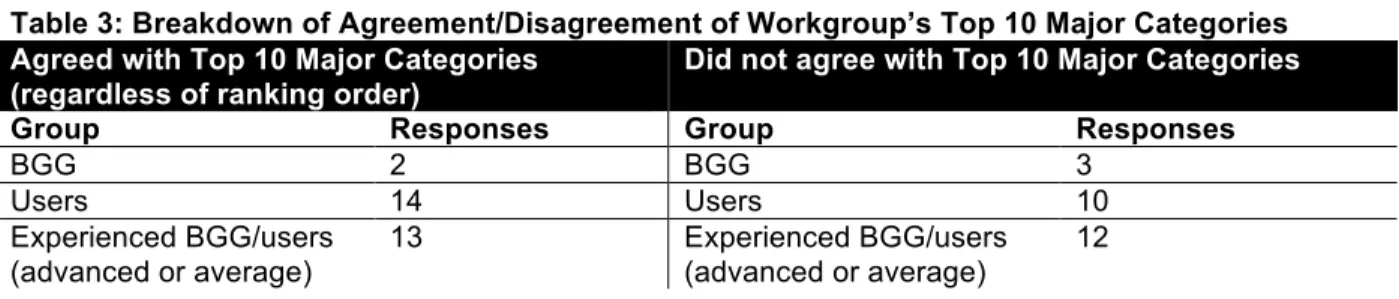
Table 3 reflects the breakdown by BGG, users, and experienced BGG/users who either agreed with the workgroup’s top 10 major categories (regardless of ranking order) or disagreed with the workgroup’s top 10 major categories.
3
Table 3: Breakdown of Agreement/Disagreement of Workgroup’s Top 10 Major Categories
Agreed with Top 10 Major Categories (regardless of ranking order)
Did not agree with Top 10 Major Categories
Group Responses Group Responses
BGG 2 BGG 3 Users 14 Users 10 Experienced BGG/users (advanced or average) 13 Experienced BGG/users (advanced or average) 12
Table 4 reflects the total aggregated responses of top 10 major categories from all participants. Please see the Conclusion/Final Rankings section for a complete list of all 46 major categories and their prioritization level.
Table 4: Final Results of Top 10 Major Categories from All Participants
Rank Major Categories Workgroup
Rank
1 Fix issues relating to discordance of data between front end/back end and line level exports 1
2 Create and revise data processing rules 4
3 Fix issues relating to data being sent by jurisdictions and not being processed at all or not processing correctly 3
4 Create data quality metrics and dashboards 2
5 Communicate with users about problems, planned outages, updates, functionality improvements, bug fixes, etc. 5 6 Address issues relating to misclassification of data 6
7 Fix errors associated with incorrect calculations 7
8 Enable users to compare "raw" and "binned" data 8 9 Improve documentation and training about how data are processed 11 10 Allow users to manage their data by determining which data to keep or delete 9
BIOSENSE GOVERNANCE GROUP RESULTS
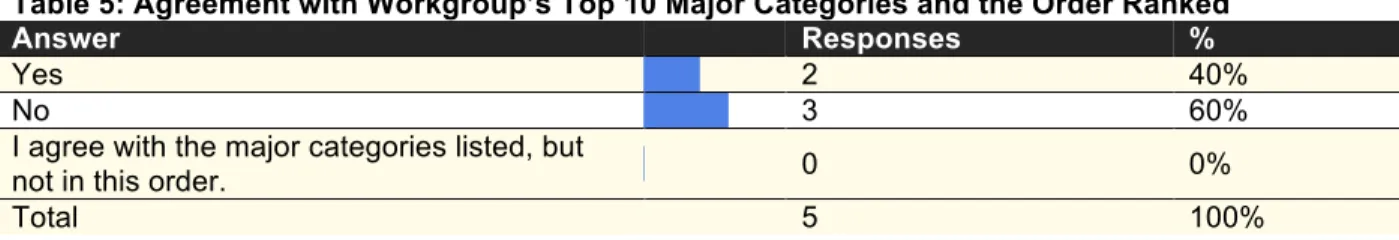
Five members of the BGG participated in the prioritization survey. Table 5 reflects the breakdown of responses from the BGG. Two (40%) members agreed with the workgroup’s rankings and prioritization. Three (60%) members did not fully agree with the workgroup’s rankings and prioritization and therefore selected their own major issues and prioritized them.
Table 5: Agreement with Workgroup’s Top 10 Major Categories and the Order Ranked
Answer Responses %
Yes 2 40%
No 3 60%
I agree with the major categories listed, but
not in this order. 0 0%
5
JURISDICTIONS USING BIOSENSE ONLY
Results were also stratified to reflect jurisdictions who indicated they were not using any other syndromic surveillance system other than BioSense. Table 6 shows that BioSense only users ranking of the major categories similar to the overall survey response.
Table 6: Jurisdictions Using BioSense Only
Rank Major Categories Workgroup
Rank
1 Fix issues relating to discordance of data between front end/back end and line level exports 1
2 Create and revise data processing rules 4
3 Fix issues relating to data being sent by jurisdictions and not being processed at all or not processing correctly 3
4 Create data quality metrics and dashboards 2
5 Communicate with users about problems, planned outages, updates, functionality improvements, bug fixes, etc. 5 6 Address issues relating to misclassification of data 6
7 Fix errors associated with incorrect calculations 7
8 Enable users to compare "raw" and "binned" data 8 9 Improve documentation and training about how data are processed 11 10 Allow users to manage their data by determining which data to keep or delete 9
SYNDROMIC SURVEILLANCE EXPERIENCE
The survey was also stratified based on syndromic surveillance experience. Table 7 shows that 11 jurisdictions (38%) indicated their jurisdiction is advanced in syndromic surveillance experience, 14 (48%) jurisdictions indicated their jurisdiction is average in syndromic surveillance experience, and two (7%) jurisdictions indicated their jurisdiction is novice in syndromic surveillance experience.
Table 7: Syndromic Surveillance Experience
Answer Responses %
advanced in syndromic surveillance 11 38%
average in syndromic surveillance 14 48%
novice in syndromic surveillance 2 7%
no experience at all in syndromic surveillance 1 3%
I don't know 0 0%
N/A 1 3%
Total 29 100%
Table 8 below shows which major category was chosen by an user as the single most important priority along with how many users voted for that major category as being the single most important priority. Table 8 also shows how that major category was ranked in the overall top 10 major categories. Table 8: Major Categories Voted as Most Important Priority
Major Category Times Voted
as Top Priority
Final Priority
Fix issues relating to discordance of data between front end/back end and
line level exports 22 1. HIGH
Create and revise data processing rules 4 2. HIGH
Fix issues relating to data being sent by jurisdictions and not being processed
at all or not processing correctly 1 3. HIGH
Address issues relating to misclassification of data 1 8. HIGH
Improve documentation and training about how data are processed 1 9. HIGH
CONCLUSION/FINAL RANKINGS
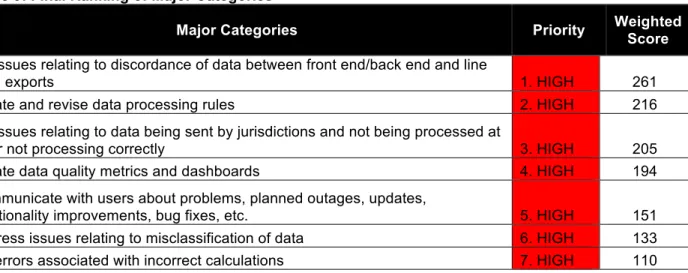
An analysis was conducted that weighted each of the major categories that was selected. For example, something ranked as the top priority would receive 10 points, something ranked as the second priority received 9 points, and so on. Table 9 shows the final ranking of the major categories based on the weighted score calculated. This includes individuals who agreed with the workgroup’s top 10 major categories. Only the top 10 major categories are in ranked order (1 being the highest priority). To depict the medium and low categorization, any major category left that received a weighted score of 2 or higher received a medium categorization and any major category left that received 0 or 1 received a low categorization. Please note: The cutoffs of high-med-low are arbitrary, and review of issues and rankings will be an iterative process, so there will be many other chances to reconsider the order in which items should be addressed as time goes on (and as new issues are submitted). The rankings are simply a way to direct CDC’s efforts at addressing the highest priority issues, plus any medium-low priority issues that may be closely aligned with those issues and/or which may be easily achieved without taking attention away from those high priority items.
Table 9: Final Ranking of Major Categories
Major Categories Priority Weighted Score
Fix issues relating to discordance of data between front end/back end and line
level exports 1. HIGH 261
Create and revise data processing rules 2. HIGH 216
Fix issues relating to data being sent by jurisdictions and not being processed at
all or not processing correctly 3. HIGH 205
Create data quality metrics and dashboards 4. HIGH 194
Communicate with users about problems, planned outages, updates,
functionality improvements, bug fixes, etc. 5. HIGH 151
Address issues relating to misclassification of data 6. HIGH 133 Fix errors associated with incorrect calculations 7. HIGH 110
7
Enable users to compare "raw" and "binned" data 8. HIGH 74 Improve documentation and training about how data are processed 9. HIGH 47 Allow users to manage their data by determining which data to keep or delete 10. HIGH 36 Allow users to create customized classifications of variables (e.g., time, age
groups)* MEDIUM 24
Allow users to create customized syndrome definitions using complex logic
(AND, OR, WHERE) MEDIUM 19
Allow more granular controls for user roles/permissions MEDIUM 18 Allow users to have more refined control over data-sharing parameters MEDIUM 16
Fix issues associated with alerts not working MEDIUM 14
Fix issues relating to data display errors MEDIUM 14
Address issues relating to system not refreshing correctly MEDIUM 9
Fix issues relating to export of data MEDIUM 9
Unclassified MEDIUM 8
Fix issues relating to incorrect classification or display of geographies in the
maps MEDIUM 8
Improve onboarding documentation MEDIUM 7
Allow users to select which data source to analyze MEDIUM 6
Fix issues relating to incorrect display of data or legends on maps MEDIUM 3
Create reports to monitor performance measures MEDIUM 3
Address issues relating to permissions not working properly MEDIUM 2
Allow users to classify/label geographical regions MEDIUM 2
Fix issues relating to slow processing time for queries/graphs MEDIUM 2 Fix issues relating to system time-outs when exporting data** MEDIUM 1
Fix issues relating to maps not refreshing correctly LOW 1
Update software packages available to users LOW 1
Address issues relating to system registration and system access LOW 1
Allow users to track the status of onboarding requests LOW 0
Enhance tools available to users for supporting data analysis and alerting LOW 0
Revise syndrome definitions LOW 0
When a query fails, provide a description explaining why no data were returned LOW 0 Improve formatting of data display (colors, labels, etc.) LOW 0 Fix issues associated with classifications of geography LOW 0
Streamline onboarding procedures LOW 0
Improve issues relating to "look and feel" of the interface (e.g., placement of
buttons, drop-down options, behavior) LOW 0
Troubleshoot jurisdiction-specific data incongruencies LOW 0
Make modifications to login credentialing LOW 0
Improve display of maps (e.g., legends, labels, colors) and performance LOW 0
Add new data sources LOW 0
Develop a library of R code LOW 0
Address specific issues relating to system development LOW 0
Fix CDC-specific system access issues LOW 0
** Although this item only received a weighted rank of “1”, the BGG felt it should be moved to a medium priority because the BGG feels that users should be able to get access to their data and to verify that it is accurate.