Full Terms & Conditions of access and use can be found at
http://www.tandfonline.com/action/journalInformation?journalCode=tbis20
Download by: [148.251.235.206] Date: 13 February 2016, At: 20:03
ISSN: 0006-3657 (Print) 1944-6705 (Online) Journal homepage: http://www.tandfonline.com/loi/tbis20
Effects of cleaning a tidal river of sewage on gull
numbers: a before-and-after study of the River
Tyne, northeast England
S.J. Raven & J.C. Coulson
To cite this article:
S.J. Raven & J.C. Coulson (2001) Effects of cleaning a tidal river of sewage on
gull numbers: a before-and-after study of the River Tyne, northeast England, Bird Study, 48:1,
48-58, DOI: 10.1080/00063650109461202
To link to this article:
http://dx.doi.org/10.1080/00063650109461202
Published online: 29 Mar 2010.
Submit your article to this journal
Article views: 142
View related articles
During the 20th century, great increases took place in the numbers of gulls of many species (Blokpoel & Spaans 1991). One of the main factors to which this has been attributed is the increasing amount of food available to gulls as a result of human activities (Lloyd et al.1991). One such source of food, untreated sewage, is utilized by many gull species (Vernon 1970, Fitzgerald & Coulson 1973, O’Connor 1974, Mudge 1978, Cramp & Simmons 1983).
Until recently it has been legal to discharge
untreated sewage into the tidal reaches of rivers in Britain and Ireland. The presence of suitable food has encouraged large numbers of gulls to collect and feed on the sewage and other organic waste materials deposited in the river. It might be expected that the removal and treatment of the enormous quantities of untreated sewage previously discharged would lead to a dramatic reduction in the number of gulls feeding in the tidal reaches of rivers as water conditions have improved.
Despite the difficulties inherent in deter-mining the causes of long-term changes in numbers of animals (Bryant 1987), several studies have identified responses by birds,
Effects of cleaning a tidal river of sewage on gull
numbers: a before-and-after study of the River
Tyne, northeast England
SUSAN J. RAVEN and JOHN C. COULSON*2
Department of Biological Sciences, University of Durham, UK
For most of the 20th century, the tidal reaches of the River Tyne in northeast
England were used as an open sewer for organic wastes from almost a million
people. This produced anaerobic conditions in the river, but supplied an
appreciable source of food for five species of gulls. Observations on the number
of gulls using the river were made in 1969/70 to establish the situation before
a sewage treatment scheme was implemented. By 1994, the volume of untreated
sewage discharged into the river had been reduced by 97% and by 86% in the
study area, and a second survey was carried out to evaluate the effect of the
clean-up on gull numbers. Overall, gull numbers showed a significant decrease
of 37% between the two study periods. The decrease in winter was 38% and
was also significant, while the decline in summer was 33%, but not significant.
Considering individual species, numbers of Common and Great Black-backed
Gulls declined by 93% and 91% respectively. In both these cases this is
presumed to be due to the decline in available food. Black-headed Gull numbers
did not change significantly and it appears they have been able to find
alternative feeding sites such as mud flats exposed at low tide and the outfall
where treated effluent is discharged. Numbers of Lesser Black-backed Gulls and
Kittiwakes rose dramatically as a result of increases in breeding numbers in the
area. Neither species feeds along the river. Numbers of Herring Gulls did
not change significantly – it is likely that the effect of the decline in food
availability was masked by the increase in breeding numbers in towns along the
river banks. The different response of each of the species of gulls indicates the
differences in their ecology and breeding status in the area.
*Correspondence author. Present address: 29 St Mary’s Close, Shincliffe Village, Durham City DH1 2ND, UK.
particularly waders and wildfowl, thought to be due to changes in the quantity of untreated sewage and other organic waste products entering a river or estuary (Pounder 1976a, 1976b, Campbell 1984, Furness et al. 1986, Green et al. 1993). Such changes can affect birds directly, if the discharged matter is utilized as food or indirectly if the birds’ food supplies are affected (Green et al.1993).
Few studies have considered the effect of changing sewage levels upon gulls. In the Scheldt estuary, Belgium, more Black-headed Gulls Larus ridibundus bred near the estuary after it became polluted, although this increase could not be attributed with certainty to an increase in available food (Van Impe 1985). At Wellington, New Zealand, improvements to sewage treatment and the closure of two abattoirs which had previously discharged waste directly into the harbour were thought to explain a decrease in the numbers of Dominican Gulls L. dominicanusfeeding in the harbour and a redistribution of this species and Red-billed Gulls L. novaehollandiaetowards the one remaining sewer discharging untreated waste (Robertson 1992). Recently, thousands of Kittiwakes Rissa tridactyla have died off the coast of northeast England, killed by an algal toxin produced during local blooms which, apparently, were stimulated as a result of nutrients released from large quantities of sewage dumped off the mouth of the River Tyne (Coulson & Strowger 1999).
By the late 1960s, the River Tyne in northeast England was highly polluted by the input of waste, and the implementation of a treatment scheme was proposed. Prior to the introduction of the treatment scheme, a survey was carried out over a 12-month period to determine the numbers and distribution of gulls frequenting the tidal reaches of the river (Fitzgerald & Coulson 1973). It was found that five of the six gull species used untreated sewage as a food source, albeit to differing extents, the exception being the Kittiwake. It was predicted that if the input of untreated sewage to the river ceased, numbers of Black-headed Gulls and Common Gulls L. canuswould drop by 20–30%, Herring Gulls L. argentatuswould decline by about 60% and Lesser Black-backed Gulls L. fuscus and Great Black-backed Gulls L. marinus would disappear from the study area altogether. It was suggested that such a change might be
benefi-cial for Kittiwakes, since it was expected that live fish would increase in the tidal areas.
In the 1970s, a scheme to exclude raw sewage from the river and to treat it prior to disposal at sea was progressively introduced on Tyneside. This paper reports on a second survey of the abundance and distribution of the six species of gull, carried out in 1993/94, by which time the Tyneside sewage treatment scheme was fully operational. The results of the two surveys are compared to evaluate the effects that improve-ments to sewage management have had on the gulls using the tidal reaches of the River Tyne.
METHODS
In order to facilitate comparison of the results of the two surveys, the procedure of the initial survey (Fitzgerald & Coulson 1973) was followed as closely as possible in the repeat study.
1969–70 survey
The initial survey was carried out from October 1969 to September 1970 along a 24-km stretch of the tidal reaches of the River Tyne. The study area was divided into 14 sections of similar but arbitrary length, their boundaries being marked by permanent landmarks. Surveys along the river were carried out on 17 occasions through the year from the Port of Tyne Authority’s patrol boat on its daily river survey. Each started from the North Shields Ferry Terminal and the survey was carried out on the upstream journey. The number of gulls of each species observed on or over the river, or resting on waterfront buildings and the river banks, was recorded for each section. Gulls on nests or nesting sites (mainly Kittiwakes and some Herring Gulls) were not included. Gulls which flew past the observer in the same direction as the boat was moving were not counted on the assumption that they would be encountered again, but in any case these only involved some 2% of the birds seen.
1993–94 survey
The second series of surveys was carried out weekly from October 1993 to September 1994. Again, the Port of Tyne patrol boat was used and the surveys were carried out at a similar
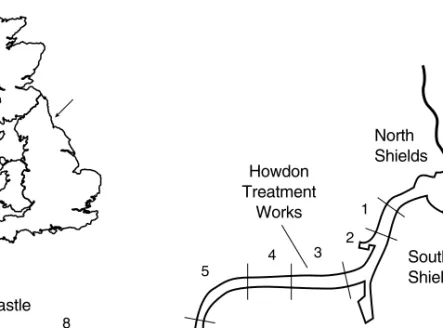
speed, using the same route and section boundaries. Passage under the Swing Bridge at Newcastle was now more difficult and journeys further upstream were only possible at low tide and when the smaller of the Authority’s patrol boats was used. Therefore few surveys of the sections upstream of the Swing Bridge were carried out in 1993/94. In addition, surveys of section 1 were less numer-ous in 1969/70 and so for the purposes of comparative analysis, only sections 2–9, a 13-km stretch of the tidal reaches (Figure 1), have been used in this analysis.
In order to compare the distribution of each species of gull in the two surveys, the mean number of individuals seen per trip in each of the sections 2–9 was calculated for both surveys and these are shown in Fig. 4. Again, only data from the period when each species was present in the study area were used.
Stepwise multiple regression was used to investigate the factors influencing the distri-bution of each of the six species in sections 2–9 of the river during 1993/94. The physical char-acteristics of each section of the river considered are given in the Appendix. The data on gulls were log-transformed. It was not possible to include the influence of the output from the Howdon treatment works as the data
were not suitable for this type of analysis, although there can be little doubt that the Black-headed Gulls were attracted to the new effluent put into the river at this site.
Sewage data
The input of treated and untreated sewage into the river during the second survey was obtained from Northumbrian Water plc and the Environment Agency. Physical characteristics of the river were taken from Ordnance Survey Pathfinder Map No. 549(1:25 000). The degree of urbanization of the banks was estimated as the proportion of the banks that was developed and actively used by industry. The number of breeding pairs of gulls in a strip 0.5 km wide along each bank of the river was obtained from data collected for the 1994 national survey of roof-nesting gulls (Raven & Coulson 1997) and from observations of ground-nesting gulls in the area (pers. obs.).
RESULTS
Changes to sewage treatment
The construction of a new sewerage system for Tyneside started in 1973, with the building of
Newcastle Gateshead Tyne Bridge South Shields North Shields Howdon Treatment Works North Sea 9 8 7 6 5 4 0 1 km 3 2 1
Figure 1.Map of the study area on the tidal stretch of the River Tyne, showing the boundaries of the study sections. Inset map shows the position of the River Tyne in northeast England.
large sewers along each bank of the river and near the coast, north of the river mouth. These sewers intercept sewage from the old system before it reaches the river and transport it to a new treatment works at Howdon, which opened in 1980. At Howdon, sewage under-goes preliminary treatment to remove solid items, followed by further treatment, during which some 60% of the organic content is set-tled out. The sludge is then dumped at sea (information supplied by Northumbrian Water). The fine particulate matter and effluent is discharged into the river in section 3. In 1993/94, 250 000 m3of treated effluent was dis-charged daily from the Howdon treatment works.
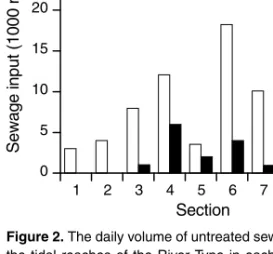
By 1993/94, 97% of all of Tyneside’s domes-tic and industrial organic waste was treated at Howdon prior to discharge into the river or at sea. The volume of untreated sewage discharged into the study area decreased by 86% between the two surveys from 91 079 m3/day in 1969/70 to 12 636 m3/day in 1993/94 (Fig. 2). In all sections studied, an appreciable reduction in discharge of untreated sewage occurred. By 1993/94, three of the eight study sections received no significant input of untreated sewage, including section 8 into which the largest volume, 26 000 m3/day, of domestic sewage and waste meat from an abat-toir, was discharged in 1969/70 via the Ouseburn outfall. In most cases, the volume of untreated sewage discharged was small and only 12 outfalls along the entire tidal reaches discharged volumes considered ‘sig-nificant’ by Northumbrian Water (that is, over 300 m3/day). The improved water quality was indicated by the 1980s when regular passage of salmon through the tidal reaches was established once again (S. Clark pers. comm.) and extensive feeding in the river by Cormorants Phalacrocorax carbo, which previously had mainly used this part of the river as a route to and from the non-tidal, fresh-water stretches of the river upstream of Newcastle.
Other changes on the river
Other changes on the River Tyne since 1969/70 have been the decline of heavy industries, including the closure of several shipyards and factories along the banks. The quay at
Newcastle is no longer used as berths for commercial vessels, and several buildings and workshops are now derelict, while others have been demolished and the banks left as open amenity spaces or redeveloped for new industry and housing. Much of the tidal mud-flats at Jarrow Slake, previously the major gull roost on the river, have been filled in and developed as a coal and car terminal. River traffic decreased from 6500 vessels entering the river in 1970 to less than half this figure in 1993 (Captain A. Nelson, Port of Tyne Authority, pers. comm.).
The number of gulls breeding on Tyneside increased considerably during the period between the two studies. All nested on build-ings except for a few pairs of Herring Gulls nesting in a disused dock. The number of breeding Herring Gulls on Tyneside grew from 27 pairs (Monaghan & Coulson 1977) to 551 pairs (Raven & Coulson 1997), while Kittiwake numbers rose from 199 pairs (Cramp 1971, Galloway et al. 1971) to 423 pairs (pers. obs.). Lesser Black-backed Gulls did not breed on Tyneside at the time of the first survey. They first bred there in 1976 (Monaghan & Coulson 1977) and numbers had increased to 25 nesting pairs by 1994 (Raven & Coulson 1997).
Changes in gull numbers on the river
Figure 3 shows, for each species, the monthly numbers of individuals seen during the two surveys. In both periods of study, it is evident
0 5 1 10 15 20 25 30 Sewage input (1000 m 3/day) Section 2 3 4 5 6 7 8 9
Figure 2.The daily volume of untreated sewage entering the tidal reaches of the River Tyne in each of the study sections for 1969/70 (■■) and 1993/94 (■).
that Common, headed and Great Black-backed Gulls were mainly present in the non-breeding season (July to March), Kitti-wakes and Lesser Black-backed Gulls were mainly restricted to the breeding season (April to August). Herring Gulls occurred throughout the year.
Table 1 shows the mean number of gulls seen per trip throughout the above periods when they were regularly present in the study area, together with the percentage changes in numbers between the two surveys and the
statistical significance of these changes. The mean number of total gulls seen on each census declined by 37% between the two surveys (Table 1, t64= 2.47, P< 0.02). However, the 33% decrease in gulls in summer was not significant (P > 0.2), but the 38% decline in the winter (September to March) numbers was significant (Table 1, t35= 2.29, P< 0.03).
Both Common and Great Black-backed Gulls showed large and significant decreases of 93% and 91%, respectively. The mean numbers of Herring Gulls on the river did not change 0
100
O 200 300
400 Great Black-backed Gull
Number of gulls Month N D J F M A M J J A S O N D J F M A M J J A S 0 200 400 600 800 Common Gull 1000 0 200 400 600 800 Black-headed Gull Kittiwake Month 0 10 20 30 40
Lesser Black-backed Gull 50 0 50 100 150 200 250 0 100 200 300 400 500 Herring Gull
Figure 3.Comparison of the numbers of gulls of each species seen per census in sections 2–9 of the River Tyne in each month of 1969/70 (■■) and 1993/94 (■). In October and December 1969 and in January, February, March, August and September 1970 only one count was made during each month, so the values shown are single counts rather than a mean as in the remaining months.
significantly between the surveys, nor did the mean number of Black-headed Gulls. There were large proportionate increases of Kittiwakes and Lesser Black-backed Gulls.
Changes in distribution
In the case of the Common Gull (Fig. 4), the large decrease in numbers was observed in all sections of the study area. In 1969/70, the vast majority of Great Black-backed Gulls were observed in section 3; however, by 1993/94, the large numbers had disappeared from this section and had not been redistributed else-where on the river (Fig. 4). The increase in Kittiwake numbers was localized and occurred only in the three sections of the study area where colonies were nearby (2, 6 and 9). Even in those species where there was no significant change in numbers between the two study peri-ods, changes in distribution were apparent. There was a pronounced increase in the num-ber of Black-headed Gulls in section 3 (Fig. 4), where there were new discharges entering the river from the Howdon treatment plant and a large decline in section 8, once the site of a major sewage out-fall.
Factors affecting distribution in 1993/94
When considering the analysis, it must be borne in mind that significant inter-correlations
existed between several variables. The distance upstream was negatively correlated with the width of the section (r6= –0.92, P< 0.001) and also, in the case of the Herring Gull, with the number of breeding pairs (r6= –0.86, P< 0.01). There was also a positive correlation between the numbers of pairs of breeding Lesser Black-backed Gulls and the amount of untreated sewage (r6= 0.80, P< 0.05).
The results of these analyses are given in Table 2. The R2values indicate that the majority of the variation in numbers can be explained by variation in one or more of the factors investi-gated, particularly sewage input, area of mud at low tide, distance upstream and numbers of breeding pairs. For only the Common Gull did more than one factor show a significant effect.
DISCUSSION
The before-and-after study to measure the effects of sewage on gull numbers along the tidal stretches of the River Tyne has been made with an interval of 24 years between the two sets of observations, the length of the interval mainly caused by the time taken to plan, build, complete and implement the new sewage treat-ment system. In that period of time, the volume of untreated sewage waste discharged into the river decreased by approximately 86%.
The mean number of total gulls counted dropped by about a third between the two
Table 1.The number of gulls seen per census in sections 2–9 of the River Tyne in 1969/70 and 1993/94 and the per-centage change in abundance. The figures for individual species are for the period of the year when the species is present on the river (see text). The figure for total gulls is an average for the entire year and is subdivided into winter (September–March) and summer (April–August) periods.
Number of gulls per census trip (mean ±se)
Species 1969/70 1993/94 Percentage change t P
Black-headed Gull 589 ±74 504 ±43 –14 t46= 0.93 ns
Common Gull 368 ±99 26 ±6.8 –93 t33.6= 9.96 <0.001
Lesser Black-backed Gull 5.1 ±2.2 29 ±1.7 +468 t27= 10.46 <0.001
Herring Gull 217 ±41 234 ±10 +8 t17.6= 1.57 ns
Great Black-backed Gull 111 ±35 11 ±2.3 –91 t46= 6.08 <0.001
Kittiwake 19 ±8.9 56 ±10 +195 t27= 4.03 <0.001
Mean of monthly mean number of all gulls
Per census (whole year) 1081 ±153 685 ±47 –37 t64= 2.47 <0.02
Summer (Apr–Aug) 742 ±183 498 ±59 –33 t27= 1.27 ns
Winter (Sep–Mar) 1323 ±213 818 ±58 –38 t35= 2.29 <0.03
surveys, and this change was significant for the winter months, when numbers were larger. Numbers of some individual species however changed to a much greater extent and it is likely that total numbers would have declined to a greater extent if it had not been for the appreciable increases in numbers of local breeding Herring Gulls and Kittiwakes and the attraction of Black-headed Gulls to the treated effluent entering the river from the new treat-ment works at Howdon. In the 24 years between the two sets of observations, changes
other than the reduction of sewage entering the river took place, but none of these, except, perhaps, the drainage and development of most of Jarrow Slake, seems to have had any major influence on the numbers and distribu-tion of gulls using the area.
We consider each species in turn.
Common Gull
The Common Gulls wintering in northeast England breed in Scandinavia and Finland 0 20 2 40 60 80
100 Great Black-backed Gull
Mean number of gulls
Section 3 4 5 6 7 8 9 Common Gull 0 40 80 120 160 0 40 80 120 160 Black-headed Gull 0 20 2 40 60 80 100 Kittiwake Section 3 4 5 6 7 8 9
Lesser Black-backed Gull 0 20 40 60 80 0 5 10 15 Herring Gull
Figure 4.The mean number of gulls of each species observed in each of the sections 2–9 in 1969/70 (■■) and 1993/94 (■). Means are restricted to the time of year that the particular species was present in the river (see Methods).
(unpubl. ringing data) and have continued to roost in tens of thousands at coastal roosts at the mouths of the River Tyne and the nearby River Wear. Although the numbers feeding in the tidal reaches of the Tyne decreased by 93%, the species has continued to feed in numbers on pastures in the neighbouring countryside and it is evident that the reduction on the Tyne is not the result of a dramatic reduction in wintering birds of this species in north-east England. In 1969/70, Common Gulls frequently fed at low tide by hovering head into the wind immediately over sewage pour-ing into the river from out-fall pipes, and selected larger food items than the Black-headed Gulls, although both species occurred at the same out-falls. Such larger items are no longer commonly available in the river and apparently the species fails to find suitable feeding along the tidal reaches.
Great Black-backed Gull
The Great Black-backed Gulls visiting north-east England in winter are almost entirely birds which breed along the coast of Norway and which start to return to their wintering areas at the end of July and leave again by mid-March (Coulson et al.1984). Most Great Black-backed Gulls feed at sea and come into coastal areas to feed in numbers only when sea conditions are rough and commercial fishing is curtailed. During the study in 1993/94, large numbers of this species occurred on the coast in rough weather, but few entered the river and numbers decreased by 90%, compared with 1969/70. The lack of large pieces of food, such as waste produced from abattoirs, has now made the river unsuitable as a source of food for this gull,
with the exception of the Fish Quay in section 1, where some still obtain fish waste.
Black-headed Gull
There are no Black-headed Gull colonies within normal feeding range of the tidal reaches of the Tyne. Most of the birds using the river are winter visitors which breed in the countries around the Baltic and these start to arrive in the second half of July (MacKinnon & Coulson 1987). There has been only a small and non-sig-nificant decrease in the numbers of this species on the river, but there has been a marked change in the distribution. Most noticeable has been a decrease in section 8, formerly the site of the largest out-fall on the river, and an increase in section 3. Treated effluent from the Howdon works is discharged into section 3 and Black-headed Gulls increased markedly in this section, particularly at this out-fall and over the extensive mud flats adjacent to it.
Herring Gull
In 1993/94, Herring Gull numbers had redis-tributed, with most being in sections 2–5, whereas in 1969/70 the distribution was more uniform over the length of the study area. Distribution now closely follows that of breeding birds, which, individually, appear to use the river infrequently as a food source. If this was not the case, the numbers present on the river would have been appreciably greater. The greater numbers on the river in winter compared with summer in 1969/70 probably represented an appreciable proportion of winter visitors at that time. By 1993/94, the winter and summer numbers of Herring Gulls
Table 2.The results of stepwise multiple regression analyses of the factors influencing the distribution of gulls on the study area along the River Tyne in 1993/94. Area of mud was determined at low tide. Section 3 was excluded from analy-sis of Black-headed Gull data. Data used in these analyses are given in Appendix 1.
Species Variable Regression slope F df P R2
Black-headed Gull Area of mud 9.85 ×10⁻⁴ 11.4 1,6 <0.02 0.59
Common Gull Area of mud 5.13 ×10⁻⁶ 14.8 1,6 <0.02 0.42
Urbanization (%) –0.534 15.4 2,5 <0.01 0.83 Lesser Black-backed Gull Breeding numbers 0.216 30.1 1,6 <0.002 0.81 Herring Gull Distance upstream –0.085 18.1 1,6 <0.005 0.71 Great Black-backed Gull River width 1.54 126 1,6 <0.001 0.94 Kittiwake Breeding numbers 3.36 ×10⁻³ 9.0 1.6 <0.05 0.54
were similar and were probably mainly resident birds which bred in the immediate area.
Lesser Back-backed Gull
This species is still relatively uncommon on the river. Like the Herring Gull and Kittiwake, its current distribution along the river reflects its breeding distribution. In the case of this species, this correlates with the amounts of untreated sewage still entering sections of the river, although this species was not seen feeding along the river during the 1993/94 study.
Kittiwake
The marked increase in Kittiwakes is closely related to the increase in numbers nesting at colonies along the river at North Shields, Gateshead and Newcastle, where many birds rest, drink and collect nesting material from the river and its banks. It is clear the Kittiwake does not use riverside nesting sites because food is available within the river limits. Numbers feeding in the river have not increased since the 1960s (Coulson & MacDonald 1962) and 1969/70 (Fitzgerald & Coulson 1973) and currently almost all still feed at sea.
From the multivariate analysis of the factors explaining the distribution of each species of gull in the 1969/70 survey, the quantity of sewage entering the section was then an important factor determining the distribution and possibly the abundance of five species. Reducing the value for sewage input to zero in the regression equation produced a prediction for the change in numbers expected when untreated sewage was no longer poured into the river. All five Larus gulls were expected to decrease (Fitzgerald & Coulson 1973) and this has occurred in the three species that only visit the area outside their breeding seasons. The decrease in Great Black-backed Gulls was as predicted, but the decline in Common Gulls was much greater than expected. Changes in the Black-headed Gull numbers were less than predicted by this method, probably because they have found a new feeding site at Howdon. The predicted decreased use of the river by Herring and Lesser Black-backed Gulls
proba-bly occurred, but it has been masked by the increase in breeding birds in the area.
The major reduction in the input of untreated sewage to the tidal reaches of the River Tyne has caused a large decrease in numbers of Common Gulls and Great Black-backed Gulls using this area. In contrast, Black-headed Gulls appear to have switched to other food sources along the river. Herring Gulls, Lesser Black-backed Gulls and Kittiwakes still persist in the area, apparently because suitable nesting sites are available as most individuals feed else-where in the general area. Complete cessation of pollution by sewage of the tidal reaches of the Tyne has yet to be achieved, but it is unlikely to decrease the numbers of Herring Gulls, Lesser Black-backed Gulls and Kittiwakes using the river as long as these species nest there in numbers. The numbers of Black-headed Gulls on the river are appreciably influenced and maintained by the effluent released at Howdon. We predict that Black-headed Gulls will decline further if improvements are made to the treatment of sewage at Howdon which reduce the nature and quantity of effluent currently put into the river.
ACKNOWLEDGEMENTS
We are grateful to Captain Andrew Nelson for arranging for us to accompany the river patrols made by the Port of Tyne Authority between Newcastle and the mouth of the river and for his interest and knowledge of the river which proved most valuable to us. We are also grate-ful to the crews of the patrol boat for their co-operation and help. Northumbrian Water and the Environment Agency made available information concerning the inputs of treated and untreated sewage to the River Tyne.
REFERENCES
Blokpoel, H. & Spaans, A.L. 1991. Superabundance in gulls: causes, problems and solutions. Acta XX Congr. Int. Ornithol.2359–2398.
Bryant, D.M. 1987. Wading birds and wildfowl of the estu-ary and Firth of Forth, Scotland. Proc. R. Soc. Edinburgh93B:509–520.
Campbell, L.H. 1984. The impact of changes in sewage treatment on seaducks wintering in the Firth of Forth, Scotland. Biol. Conserv.28:173–180.
Coulson, J.C. & MacDonald, A. 1962. Recent changes in the habits of the Kittiwake. Br. Birds55:171–177. Coulson J.C. & Strowger, J. 1999. The annual mortality rate of Black-legged Kittiwakes in NE England from 1954 to 1998 and a recent exceptionally high mortality. Waterbirds22:3–13.
Coulson, J.C., Butterfield, J., Duncan, N., Kearsey, S., Monaghan, P. & Thomas, C. 1984. Origin and behaviour of Great Black-backed Gulls wintering in northeast England. Br. Birds77:1–11.
Cramp, S. 1971. Gulls nesting on buildings in Britain and Ireland. Br. Birds64:476–487.
Cramp, S. & Simmons, K.E.L. (eds) 1983. The Birds of the Western Palearctic, Vol. 3. Oxford University Press, Oxford.
Fitzgerald, G.R. & Coulson, J.C. 1973. The distribution and feeding ecology of gulls on the tidal reaches of the Rivers Tyne and Wear. The Vasculum 58:
29–47.
Furness, R.W., Galbraith, H., Gibson, I.P. & Metcalfe, N.B. 1986. Recent changes in the numbers of waders on the Clyde Estuary and their significance for conservation. Proc. R. Soc. Edinburgh 90B:
171–184.
Galloway, B., Meek, E.R. & Yeoman, P. 1971. Birds in Northumbria 1970.Report of the Tyneside Bird Club, Newcastle on Tyne.
Green, P.T., Hill, D.A. & Clark, N.A. 1993. The Effects of Organic Inputs to Estuaries on Overwintering Bird Populations and Communities. British Trust for Ornithology, Contract ETSU TID 4086, Department of Trade and Industry.
Lloyd, C., Tasker, M.L. & Partrridge, K. 1991. The Status of Seabirds in Britain and Ireland.T. & A.D. Poyser, London.
MacKinnon, G.E. & Coulson, J.C. 1987. The temporal and geographical distribution of continental Black-headed Gulls Larus ridibundusin the British Isles.
Bird Study34:11–19.
Monaghan, P. & Coulson, J.C. 1977. Status of large gulls nesting on buildings. Bird Study24:9–104. Mudge, G.P. 1978. Ecological studies of Herring Gulls
(Larus argentatusPont.) and other Larini in an urban environment. Unpublished Ph.D. thesis, University College, Cardiff.
O’Connor, R.J. 1974. Feeding behaviour of the Kittiwake. Bird Study21:1185–1192.
Pounder, B. 1976a. Wintering flocks of Goldeneyes at sewage outfalls in the Tay estuary. Bird Study 23:
121–131.
Pounder, B. 1976b. Waterfowl at effluent discharges in Scottish coastal waters. Scott. Birds9:5–36. Raven, S.J. & Coulson, J.C. 1997. The distribution and
abundance of Larus gulls nesting on buildings in Britain and Ireland. Bird Study44:13–34.
Robertson, H.A. 1992. Trends in numbers and distribu-tion of coastal birds in Wellington harbour. Notornis
39:263–289.
Van Impe, J. 1985. Estuarine pollution as a probable cause of increase of estuarine birds. Mar. Poll. Bull.
16:271–276.
Vernon, J.D.R. 1970. Feeding habitats and food of the Black-headed and Common Gulls. Part 1: Feeding habitats. Bird Study17:287–296.
(MS received 18 October 1999; revised MS accepted 22 May 2000)
APPENDIX
Characteristics of sections 2–9 of the River Tyne in 1993/94.
Mean number of gulls per km Section
no. BHG CG LBBG HG GBBG K Mean width (m)
2 8.7 0.6 0.7 42.1 1.6 2.5 350 3 90.5 3.9 1.3 21.5 2.3 7.4 420 4 44.1 0.9 6.5 31.2 0.5 1.4 250 5 78.0 1.2 10.3 37.4 0.9 3.4 310 6 25.9 2.6 0.2 6.5 0.6 3.2 210 7 23.5 2.3 0.7 2.1 0.3 1.9 150 8 16.0 0.2 0.0 3.7 0.2 1.0 140 9 35.4 1.0 0.1 6.9 0.1 15.5 130 Area of Input of
exposed Distance untreated Number of breeding pairs per km Section mud per km upstream sewage
no. (100m2/km) % urban (km) (m3/day/km) LBBG HG K
2 15 75 2.3 0 1 42 26 3 755 65 3.8 359 0 16 0 4 71 70 5.3 3642 4 24 0 5 209 70 6.8 837 3 13 0 6 135 40 9.2 1223 1 2 25 7 91 33 12.4 202 0 0 0 8 85 100 13.5 0 0 0 0 9 59 100 14.2 0 0 1 202
BHG, headed Gull; CG, Common Gull; LBBG, Lesser backed Gull; HG, Herring Gull; GBBG, Great Black-backed Gull; K, Kittiwake.