© [2011] IEEE. Reprinted, with permission, from [Mao Lin Huang; Jinson Zhang; Quang Vinh Nguyen; Junhu Wang,
Visual Clustering of Spam Emails for DDoS Analysis, Information Visualisation (IV), 2011 15th International
Conference on, 13-15 July 2011]. This material is posted here with permission of the IEEE. Such permission of the
IEEE does not in any way imply IEEE endorsement of any of the University of Technology, Sydney's products or
services. Internal or personal use of this material is permitted. However, permission to reprint/republish this material
for advertising or promotional purposes or for creating new collective works for resale or redistribution must be
obtained from the IEEE by writing to pubs-permissions@ieee.org. By choosing to view this document, you agree to all
provisions of the copyright laws protecting it
Visual Clustering of Spam Emails for DDoS Analysis
Mao Lin Huang
School of Software, Faculty of Engineering & IT University of Technology, Sydney
Australia maolin@it.uts.edu.au
Jinson Zhang
School of Software, Faculty of Engineering & IT University of Technology, Sydney
Australia maolin@it.uts.edu.au
Quang Vinh Nguyen
School of Computing and MathematicsUniversity of Western Sydney Australia
vinh@scm.uws.edu.au
Junhu Wang
3School of Information and Communication Technology
Griffith University, Australia J.Wang@griffith.edu.au
Abstract— Networking attacks embedded in spam emails are
increasingly becoming numerous and sophisticated in nature. Hence this has given a growing need for spam email analysis to identify these attacks. The use of these intrusion detection systems has given rise to other two issues, 1) the presentation and understanding of large amounts of spam emails, 2) the user-assisted input and quantified adjustment during the analysis process. In this paper we introduce a new analytical model that uses two coefficient vectors: ‘density’ and ‘weight’ for the analysis of spam email viruses and attacks. We then use a visual clustering method to classify and display the spam emails. The visualization allows users to interactively select and scale down the scope of views for better understanding of different types of the spam email attacks. The experiment shows that this new model with the clustering visualization can be effectively used for network security analysis.
Keywords- Spam email, network security analysis, clustered visualization, information visualization, network intrusion detection, DDoS attacks
I. INTRODUCTION
Spam email is a common type of the cyber nuisance. It not only wastes resources, but also poses serious security threats [1]. Spam emails can be divided into two types: those with the attachment and others without the attachment. The attachments are normally the executable files that have virus hidden inside. The spam emails with no attachment usually have virus hidden inside of the message body.
DDoS attack is organized by a hacker who utilizes many computers as agents from different locations to launch a coordinated attack against one or more targets that consumes victim’s network bandwidth, or consumes victim’s resources so that legitimate users could not access to the targeted computers [2] [3] [4]. Spam email DDoS attacks cause the email system damage when it clogs mail server and network bandwidth [5].
Our research experiment is based on the dataset we collected from the email networking system running in the Library of the University of Technology, Sydney (UTS) which contains 4100 spam emails received in five month
time period of 2009. The email system is running on Microsoft Exchange Server. All of these spam email attacks come from 450 different sources (IPs). Some of these attacks have been identified as DDoS attacks.
In this project, we propose to use a visual clustering method [6][7] for assisting the analysis of email attacks, especially the DDoS attacks through the visual representation and classification of the spam emails. A clear clustered structure of the spam emails could help analysts to identify the unusual email events and the types of email attacks, including DDoS attacks.
We first analyze the behaviors of spam emails and then create a model for analysis. We use two coefficient vectors: ‘density’ and ‘weight’ of the spam email attack for analysis. We then use a visual clustering method to classify and display the spam emails. The visualization allows users to interactively select and scale down the scope of views for better understanding of different types of the spam email attacks for discovering DDoS attacks. The experiment shows that this new model with the clustering visualization can be effectively used for network security analysis.
II. BACKGROUND
A. Spam email with no attachments
The first type of spam emails are those with no attachments, in which the virus is hidden inside the message body and spreads when users open the message. There are several situations when a machine receives a spam email of this type:
• If there is a huge number of spam messages and unwanted emails are received on a victim email system in a short period, they will clog the email server, consume the network recourses and bandwidth towards a network level DDoS attack that will end up the email service in the victim’s machine.
• If the virus has been opened, it will then be spreading inside the system and the system will be acting as an agent to attack other machines.
• An opened virus sometimes will kill a few or all system processes towards a system crash.
Message 1 shows the receipt of a no-attachment spam email in our email server.
Message 1. Spam email with no attachment
B. Spam email with attachments
The second type of spam emails which is a typical spam email attack contains attachments that can be larger up to 20 MB each. There are several situations that could damage the system when a machine receives a spam email of this type:
• If there is a huge number of spam emails with large size of attachments arrived at the victim’s system, a network level DDoS attack could occur.
• The executable attachment could bring worms, viruses and Trojans into the victim’s system. The system could become an agent for spreading attacks to other systems when those executed attachments send viruses to other machines.
• When those executable viruses eat local disk spaces, memories and kill other applications, an application level DDoS attack could occur in the victim’s system which will cause services denial to their users.
Message 2 shows the receipt of a spam email with the attachment in our email server.
Figure 2. Spam email with attachment
Message 2. Spam email with attachment
C. Visualization in Network Intrusion Detection
The most common visualization approach to the problem of network intrusion detection is the use of IP Matrix. Koike et al. [8] have proposed a 2D IP matrix that is based on the 32-bits IP addressing space. This model divides 32-bits IP address into two groups: the global-level IP matrix and the local-level IP matrix. The global-level IP matrix is the
highest 8 bits and next high 8 bits make a 2-D IP matrix model. The local-level IP matrix is the lower 8 bits × lowest 8 bits. It has been demonstrated that this IP Matrix visualization is effective in visualization and recognition of the infection of worms: a type of viruses. By using this IP matrix, the propagation of the Welchia worm and the Sasser.D worm can be visualized and identified.
Recently, Zhang et al. [9] further developed a 3D IP Matrix visualization called NetViewer that uses the highest 8-bits IP address as the location. The rest of 24-bits are classified into x-axis; y-axis and z-axis for the visual representation of the lower 24-bits of IP addresses in a 3D space. NetViewer can be used to detect the DDoS and Ports Scan attacks in the networks.
However, this approach has a number of limitations: • Unused IP addresses: in this type of visualization,
there are many unused IP addresses, and the display space is used wastefully. To use display space economically, some visualization techniques should be applied. However, it is not appropriate to eliminate non-existent IP addresses because there could be attacks from the spoofed IP addresses. • Unable to detect email virus: This method is not
appropriate to be used for detecting some other types of virus which uses different channels for infection. For example, in the case of an email virus, the next target is selected by using the user’s address book, and these addresses have no relation to IP addresses. In this case, IP Matrix is not useful for prediction of email viruses.
Another approach which is specifically designed to deal with email viruses is called ‘Two-mode visualization’ [10]. During the email communication, there are several network ‘nodes” involved, such as email server, network router and switcher. A large amount of information is recorded in the log files of these network ‘nodes’ which is hard to be represented. However, the Two-mode model has simplified those processes by using three stages:
• Sender sends an email to mail server • Email exchanges between servers
• Receiver receives an email from mail server
Figure 1 shows the example visualization of the Two-mode spam email network. The red nodes represent email servers, yellow nodes represent clients (sender or receiver), green edges represent sending processes, and blue edges represent receiving processes. In Figure 1, we can easily see that three email servers are receiving a large number of spam emails (blue lines) and one email server spread huge viruses (green lines) into the network.
While the Two-mode visualization [10] could help analysts to guess email viruses, such as DDoS attacks, through the abstract views of the density of green edges (the outgoing emails) and blue edges (the incoming emails), it does not provide users with any quantified justification of particular types of the virus.
In this paper we will introduce a new analytical model that uses two coefficient vectors: ‘density’ and ‘weight’ of the spam email attack for DDoS analysis. We then use a |SMTP Messages\Inbound And Outbound
|Thank you for your patience |Body of Message |VIRUS=Trojan-Spy.HTML.Fraud.gen (Kaspersky5) |Commonwealth Bank |oficial@commbank.com.au |undisclosed-recipients:;undisclosed-recipients |ill@lib.uts.edu.au |ill@lib.uts.edu.au
12/06/2009 8:16:08 / / AM |Transport Scan Job |SMTP
Messages\Inbound And Outbound |You have received an eCard |ecard.zip->ecard.exe |VIRUS= VirTool:Win32/Obfuscator.FH (Microsoft,CA(Vet),Command,Kaspersky5) |Steve Hurst |vaccinated5@spbdept.rbc.ru |adt@lib.uts.edu.au |adt@lib.uts.edu.au
visual clustering method to classify and display the spam emails. The visualization allows users to interactively select and scale down the scope of views for better understanding and quantified justification of different types of email virus, including DDoS attacks.
Figure 1. Two-mode visualization of spam email network [10].
III. CLUSTERED VISUALIZATION
Graphs which arise in Information Visualization applications are typically very large: thousands, or perhaps millions of nodes. The graph drawing competitions have shown that visualization systems for classical graphs are limited to (at best) a few hundred nodes. Attempts to overcome this problem have proceeded in two main directions:
Clustering: Groups of related nodes are “clustered" into super-nodes. The user sees a summary of the graph: the super-nodes and super-edges between the super-nodes. Some clusters may be shown in more detail than others. The clustering approach has been proposed several times in the graph drawing and information visualization conferences [6, 7], and is related to the overview diagrams" used by some web navigation facilities [11].
Navigation: The user sees only a small subset of the nodes and edges at any one time, and facilities are provided to navigate through the graph. This approach was taken by the WebOFDAV system [11].
A. The graph level
In our visualization we use a graph model to represent spam emails and their attributes. A graph in our visualization is a classical undirected graph, consisting of nodes and edges. In our application it is likely a very large graph, containing hundreds or thousands of nodes. The graph may be dynamic, that is, the node and edge set may be changing; these changes may be a result of user
interaction through the visualization, or they may be changed asynchronously by an outside agent.
B. The clustering level
Our visualization uses clusters to represent set of groups of spam emails based on variety of similarity rules as defined above. The use of clustered visualization will significantly reduce a visual complexity of displaying large amounts of network related data. A clustered graph C = (G, T) consists of an undirected graph G = (V, E) and a rooted tree T such that the leaves of T are exactly the vertices of G as mentioned in [6]. Figure 2 shows a clustered graph. Our clustered visualization can operate on a clustered graph C= (G, T) by two basic operations, create and destroy a cluster. Both can be performed by user interaction, or by an algorithm attached to the visualization.
Figure 2. Multiple Spring-Forces are applied in the clustered visualization.
C. The abridgement level
The current Intrusion Detection systems lack in display focus. They do not consider user orientations and focuses of large amounts of data. The use of abridgement level in our visualization provides users with a focus+context viewing mechanism for navigating the large cluster tree. In many cases, the whole clustered graph is too large to show on the screen; further, it is too large for the user to comprehend. In our implementation, the clustered visualization draws only an ``abridgement'' of the entire clustered graph at a time.
We now give a formal definition of ``abridgement''. Suppose that U is a set of nodes of the cluster tree T. The sub-tree of T consisting of all nodes and edges on paths between elements of U and the root is called the ancestor tree of U. A clustered graph C' = (G’, T') is an abridgement of the clustered graph C = (G, T) if T' is an ancestor tree of T with respect to a set U of nodes of T and there is an edge between two distinct nodes u and v of G' if and only if there is an edge in G between a descendent of u and a descendent of v. Our visualization has two elementary operations on abridgements; these change the basis of the abridgement. They are open a cluster and close a cluster.
D. The picture level
The picture level is concerned with the geometric position of the clustered graphs and its associated clustered trees as well as visual attributes to be associated to each displayed entity. Picture level of a clustered graph is shown in Figures 5. More formally, a picture of a clustered graph C = (G, T) contains a location p(v) for each vertex v of G and a route c(u, v) for each edge (u, v) of G, in the same way as drawings for classical graphs. Further, a picture has a region b(v) of the plane for each cluster v of T, such that if u is a leaf of T then b(v) is located at p(v), and if u is a child of v in T then b(u) is contained in b(v). The regions currently used by our visualization are rectangles.
Our visualization provides the usual operation of manually moving nodes in a picture. However, the main role of our visualization is animated automatic layout.
E. The force model
We use force-directed algorithm to draw the pictures of clustered graphs. It is based on the Spring-force model described by Eades [12]. Our visualization has three types of spring forces:
• Internal-spring- A spring force between a pair of vertices in the same cluster.
• External-spring- A spring force between a pair of vertices in different clusters.
• Virtual-spring- A spring force between a vertex and a virtual (dummy) node along a virtual (dummy) edge.
As well as spring forces, between each pair of nodes there is a gravitational repulsion force. The forces are applied additively to give an aesthetically pleasing layout of the graph. The sum of forces on each node is continually computed, and the movement of the nodes according to the forces drives the animation, as with the visualization. F. Animations
In our implementation, the whole visualization is fully animated. Every transition, whether triggered by the user, visualization, or by another agent, has its own specific animation. This greatly reduces the cognitive effort of the user in recognizing the new view and change; we aim for a full preservation of the user's ``mental map''. More specifically, there are eight types of animation that are implemented in our system. Five of these are specifically related to the clustering.
G. Visual object (entity) design
We use visual object or entity to represent the spam emails for the display and analysis. Currently we use a Character String with the syntax below to represent spam emails and their attributes:
[rvt]e[vt]_[att]
where rvt represents the repeating times of vt type of virus received in a time slot p, vt represents a particular type of virus, and att represents the attachment type of the virus.
IV. THE DENSITY +WEIGHT MODEL
Each spam email is represented as an attributed node in the visualization [13] which contains its domain-specific attributes, such as receive-time; subject-name; sender-name; receiver-sender-name; cc-receiver-sender-name; source-IP; virus-type; attachment-type, etc. Our model selects four most relevant attributes for the spam email analysis, which include receive-time; virus-type; attachment-type and source-IP.
A spam email that carries a particular type of the virus can be defined as an attributed node
e(t, vt, att, sip)
in which t indicates the arrival time, vt indicate the type of virus, att indicates the type of attachment and sip indicates source IP address.
We assume that in a certain time period p of the email communication between times tx and ty, a email server received a set of n spam emails as defined below
Ep = (e1, e2, … en) (1)
and suppose that there are u types of the virus VT = (vt1, vt2, …, vtu) that are identified, thus a subset of spam emails carrying a particular type of virus vti is defined as
Ep,vt(i) Ep = { e | e Ep e(vt) = vti} (2)
Suppose that there are w different source IP addresses SIP = (sip1, sip2, … sipw) that are identified sending spam emails to the server during p period, thus a subset of spam emails sent from a particular source IP address sipi is defined as
Ep,sip(i) Ep = { e | e Ep e(sip) = sipi} (4)
Accordingly, a subset of spam emails which received from a particular source IP address sipi and containing a particular type vtj of virus is defined as
Ep,sip(i), vt(j) { e | e Ep e(sip) = sipi e(vt) = vtj} (5)
Thus, we can determine whether a particular source IP sending vtj type of the viruses by the following Boolean function
(6)
We then can calculate the total number of IPs whose have sent vtj type of viruses to the server during p time slot as
wvt(j) = |SIPvt(j)| = (7)
Suppose that there are v types of attachment (att1, att2, …, attv) have been identified, thus a subset of spam emails carrying a particular type of attachment atti is defined as
Ep,att(i) Ep = { e | e Ep e(att) = atti} (8)
Accordingly, the subset of spam emails received from a particular source IP address sipi and containing a particular type attj of attachment is defined as
Ep,sip(i), att(j) { e | e Ep e(sip) = sipi e(att) = attj} (9)
Thus, we can determine whether a particular source IP sending spam emails with attj type of the attachments by the following Boolean function
(10)
We then can calculate the total number of IPs whose have sent spam emails with attj type of attachments to the server during p time slot as
watt(j) = |SIPatt(j)| = (11)
We now introduce two terms: virus density d(vti) for measuring the attack pattern of vtj type of virus and attachment density d(attj) for measuring the attachment pattern of attj type of the attachments in p period. These terms are derived from (7) and (11) as shown below
d(vti) = (12)
d(attj) = (13)
where, (0 < d(vti) < 1) and (0 < d(attj) < 1).
If the number of IPs wvt(i) or watt(j) is small, e.g. from a single source IP attack, the density value of d(vti) or d(attj) will close to zero. For example
d(vti) = ≈ 0
If the number of IPs wvt(i) or watt(j) is large, e.g. the number of source IPs is nearly equal to the total number of attacks, the density value of d(vti) or d(attj) will close to one, and it means that a DDoS attack is most likely occurred. For example
watt(j) ≈ |Ep| or wvt(j) ≈ |Ep|
Suppose that in a time slot p, one type of the virus (or attachment) has the highest density and we call it dmax that can be expressed as
dmax = max {D(vti), D(attj)} = max {dvt(1), dvt(2), …, dvt(u), datt(1), datt(2), …, datt(v)}
in our detection model, we will consider dmax density as the possible attack first in the detection process.
We would also introduce the term: weight SW(p) to measure the system (email server)’s workload in handling the attacks in p time period. The system weight is defined below
SW(p) = (14) where M is the maximum number of incoming emails that email server is capable to handle (or transfer) in a short time period p in our practices. Our email server which uses the Microsoft Exchange, can handle 240 emails (M=240) in 15 minutes time frame (around 16 emails per minute).
With light weight spam email attacks, they cost less than 20% of the system capability to handle or transfer these spam emails. Thus, it can be defined as a light weight attack if the system workload is between 0 ≤ SW(p) < 0.2.
Accordingly, we can define a medium level spam email attack if the system workload (or weight) is between 0.2 ≤ SW(p) < 0.7 in handling this attack, and a high level email attack if the system workload (or weight) is between 0.7 ≤ SW(p) < 1.0 in handling that attack.
If the system weight is great than one 1.0 < SW(p), then we consider that there is a critical level of spam email attack has occurred.
We can further define a scalability vector AttackScale(p) for the measurement of DDoS attack. It combines two vectors: the maximum virus density dmax and the system weight SW(p) together. We have
AttackScale(p) = dmax × SW(p) (15)
The vector AttackScale(p) indicates the scale of the most active type of spam emails (with attachment or with no attachment) that are current attacking the email server.
The outcome of our experiments showed that if AttackScale(p)<0.2 and dmax≈ 1, then a small scale DDoS attack is occurred. If 0.2<AttackScale(p)<0.7 and dmax≈1, then a medium scale DDoS attack is occurred. If 0.7<AttackScale(p)<1.0 and dmax≈ 1, then it is most likely that a large scale DDoS attack is occurred. If 1.0≤ AttackScale(p), then a critical level DDoS attack is occurred and the email server could be down.
V. EXAMPLE:SPAM EMAIL VISUALIZATION This section contains a sequence of screen dumps from Figure 3 to Figure 7 collected from our visualization system. They illustrate the visual analysis process for detecting DDoD attacks. These screens will show you how they achieve a better quality of the layout of clustered spam emails through the smooth transaction of views.
VI. FUTURE WORK AND CONCLUSION
This paper introduces the application of clustered data visualization for spam email analysis. We use a new analytical model called density+weight model that uses two
coefficient vectors: ‘density’ and ‘weight’ for the virus and DDoS analysis. The visualization allows users to interactively select and scale down the scope of views for better understanding of different types of the spam email virus and attacks. The experiment shows that this new model with the clustering visualization can be used effectively for network security analysis.
Currently we use character string to represent the attributes of spam emails in the visualization. In the future, we will use a set of graphical nodes with rich graphic properties to represent spam emails. We will attempt to map the graphic properties to the email domain-specific attributes. For example, we will use different shapes, colors, sizes and brightness to represent the domain-specific attributes of emails, such as different types of viruses, types of attachments, and source IP addresses. Under this scheme, the user can gain the knowledge of classification of different spam emails through the visual interpretation.
REFERENCES
[1] M. Wanli, D. Tran, and D. Sharma, "A Novel Spam Email Detection System Based on Negative Selection," in Computer
Sciences and Convergence Information Technology, 2009. ICCIT '09. Fourth International Conference on, 2009, pp.
987-992.
[2] C. Douligeris and A. Mitrokotsa, "DDoS attacks and defense mechanisms: a classification," in Signal Processing and Information Technology, 2003. ISSPIT 2003. Proceedings of the 3rd IEEE International Symposium on, 2003, pp. 190-193. [3] C. Yu and H. Kai, "Collaborative Change Detection of DDoS Attacks on Community and ISP Networks," in Collaborative Technologies and Systems, 2006. CTS 2006. International Symposium on, 2006, pp. 401-410.
[4] X. Yi and Y. Shun-Zheng, "A Novel Model for Detecting Application Layer DDoS Attacks," in Computer and Computational Sciences, 2006. IMSCCS '06. First International Multi-Symposiums on, 2006, pp. 56-63. [5] C. Dhinakaran, L. Jae Kwang, and D. Nagamalai, "An
Empirical Study of Spam and Spam Vulnerable email Accounts," in Future Generation Communication and Networking (FGCN 2007), 2007, pp. 408-413.
[6] M. Huang and P. Eades, “A Fully Animated Interactive System for Clustering and Navigating Huge Graphs”, Graph
Drawing' 1998. pp.374~383
[7] M. Huang and Q. Nguyen, "A Fast Algorithm for Balanced Graph Clustering," Information Visualization, IV'07. 11th
International Conference, 2007, pp. 46-52.
[8] H. Koike, K. Ohno, and K. Koizumi, "Visualizing cyber attacks using IP matrix," in Visualization for Computer Security, 2005. (VizSEC 05). IEEE Workshop, 2005, pp. 91-98.
[9] J. Zhang, P. Yang, L. Lu, and L. Chen, "NetViewer: A Visualization Tool for Network Security Events," in Networks Security, Wireless Communications and Trusted Computing, 2009. NSWCTC '09. International Conference, 2009, pp. 434-437.
[10]X. Fu, S. H. Hong, N. S. Nikolov, X. Shen, Y. Wu, and K. Xu, "Visualization and analysis of email networks," in Visualization, 2007. APVIS '07. 2007 6th International Asia-Pacific Symposium, 2007, pp. 1-8.
[11]M. Huang, P. Eades and R. Cohen, “WebOFDAV - Navigating and Visualizing the Web On-Line with Animated Context Swapping”, Computer Networks, 1998: 638~642 [12]P. Eades, “A heuristic for graph drawing”, Congressus,
Numerantium, pp 149-160, 1984.
M. Huang, "Information Visualization of Attributed Relational Data", in Proc. InVis.au, 2001, pp.143-149.
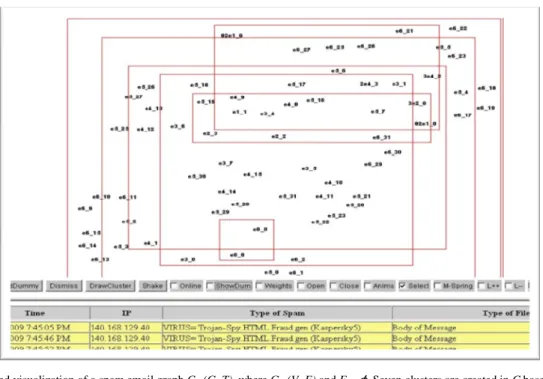
Figure 3. A clustered visualization of a spam email graph C=(G, T), where G=(V, E) and E= ࣘ. Seven clusters are created in C based on the virus types received in a time slot p. However, this layout has many overlaps among clusters.
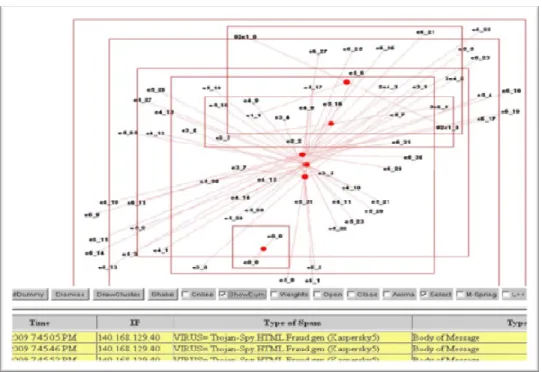
Figure 4. The same layout as shown in Figure 3; however, the virtual nodes (red nodes) and edges are added. Each virtual node appears as the center point of a cluster linking with all the nodes in a particular cluster.
Figure 5. After applying the ‘virtual spring’ forces along the red (virtual) edges, the overlaps among clusters are eliminated. We now can have a clear view of the clustering structure.
Figure 6. From Figure 5, we can quickly identify that dmax= dvt(5), that is the 5th virus has the highest density with 31 repeating rate and 22 of them occurred within 7 minutes of p. To be able to see the detail of ‘Cluster 5’ we close other six clusters through the ‘close’ operation in the abridgement level of the clustering. After an inspection into the detail of vt5, we found that all emails containing vt5 are coming from different source IPs. Thus, density of this virus is
dvt(5) =1. However, the weight of the email system is SW(p) =0.20 and the attack scalability is AttackScale =0.20. Finally, we confirmed our detection outcome: a small scale DDoS attack occurred in our email server.
![Figure 1. Two-mode visualization of spam email network [10].](https://thumb-us.123doks.com/thumbv2/123dok_us/972057.2627459/4.918.94.436.203.516/figure-mode-visualization-spam-email-network.webp)