7-1-2019
Determinants of Cloud Computing Intentions to Use: Role of
Determinants of Cloud Computing Intentions to Use: Role of
Firm’s Size, Managerial Structure and Industrial Sector
Firm’s Size, Managerial Structure and Industrial Sector
Shailja Tripathi
IFHE University, IBS Hyderabad, Telengana, India, [email protected]
Follow this and additional works at: https://scholarworks.lib.csusb.edu/jitim
Part of the Business Analytics Commons, Management Information Systems Commons, Management Sciences and Quantitative Methods Commons, and the Technology and Innovation Commons
Recommended Citation Recommended Citation
Tripathi, Shailja (2019) "Determinants of Cloud Computing Intentions to Use: Role of Firm’s Size, Managerial Structure and Industrial Sector," Journal of International Technology and Information Management: Vol. 28 : Iss. 2 , Article 3.
Available at: https://scholarworks.lib.csusb.edu/jitim/vol28/iss2/3
This Article is brought to you for free and open access by CSUSB ScholarWorks. It has been accepted for inclusion in Journal of International Technology and Information Management by an authorized editor of CSUSB
©International Information Management Association, Inc. 2017 51 ISSN: 1941-6679-On-line Copy
Determinants of Cloud Computing Intentions to Use:
Role of Firm’s Size, Managerial Structure
and Industrial Sector
Dr. Shailja Tripathi
(IFHE University, IBS Hyderabad, Telangana, India)
ABSTRACT
Currently, many companies are adopting cloud computing to accomplish their diverse purposes and to create an elastic and responsive environment that can rapidly respond to new business requirements. This paper attempts to investigate the factors influencing cloud computing adoption from the managerial perspective with the inclusion of the size of the firm, organizational structure and type of industry as control variables. The model is developed with various technological, economic and cognitive factors that affect the behavioral intention to use cloud computing using the technology acceptance model (TAM). Questionnaires were randomly distributed to around 1000 senior managers of various firms in India. Hierarchical multiple regression (HMR) was performed to test the impact of control variables on the factors that influence managerial intention to adopt cloud computing. The result showed that all the independent variables (perceived usefulness, perceived ease of use, perceived risks, perceived benefits, perceived ubiquity, perceived costs, and job relevance) explain an additional 32.3% of the variance in intention to use cloud computing. Based on standardized beta coefficients (β) values, the result showed that the impact of firm size is found highest among other control variables in explaining the amount of variability in behavioral intention to use cloud computing. The result of this study will enable the firms to focus on managerial perspectives of cloud-based applications and their attitude towards adoption.
Keywords: Cloud computing, Technology acceptance model, Hierarchical multiple regression
INTRODUCTION
Researchers are paying more attention to cloud computing as it promotes inter-organizational relationships, encourages collaboration with customers, creates agility in responding to environmental changes and creating value for firms (Ooi et
©International Information Management Association, Inc. 2017 52 ISSN: 1941-6679-On-line Copy al. 2018). Effective use of cloud computing permits the IT department of an enterprise to develop innovative applications rather than spending time in installing and maintaining software and hardware. Online file storage (Dropbox, Google Drive, etc.), social networking sites (Facebook, Twitter etc.), emails (Gmail, Yahoo mail, etc.) and online business applications (Microsoft office live, customer relationship management (CRM), enterprise resource planning (ERP), etc.) are some of the common examples of cloud computing.
By emphasizing the consequences of cloud computing and its suggestions for practitioner and academics, Wang et al. (2011) described cloud computing as an economical commodity which can be retrieved by many companies and individuals. The three service models of cloud computing are Software as a Service (SaaS), Platform as a Service (PaaS) and Infrastructure as a Service (IaaS). SaaS allows the application runs on the cloud without installation on a client computer; PaaS allows to develop and deploy applications without procuring and managing the related hardware and software; and IaaS provides IT infrastructure as computing and storage capabilities on the cloud (Marston et al, 2011). Cloud offers four different deployment models such as public, private, community, and hybrid cloud. Public cloud is an economic model that allows the deployment of IT solutions through the internet publically whereas a private cloud managed within an organization and more secured. A community cloud is shared and controlled by a group of organizations with common interests and hybrid cloud is an amalgamation of both public and private deployment models (Marston et al, 2011).
The efficient use of business resources is one of the main benefits of cloud computing. According to the National Institute of Standards and Technology (NIST), the five most noteworthy features of cloud computing are: Broad network access, in which services are delivered over a network , On-demand self-service, which refers to independent provisioning of resources without human interface with the provider, Resource pooling, which is the combination of resources such as memory, bandwidth, storage, and processing to supply multiple customers, Rapid elasticity means that resources are vigorously scaled up and down with demand and Measured service denotes the spontaneous control and optimization of resources through pay-per-use metering capabilities.
The purpose of this study is to examine the role of the size of the firm, organizational structure and type of industry in the manager’s adoption intention of cloud computing. This paper also explores the various technological, economic and cognitive factors that affect the adoption of cloud computing technology. The factors identified as technological factors in this study are perceived benefits, perceived risks, and perceived ubiquity. Job relevance and perceived costs are
©International Information Management Association, Inc. 2017 53 ISSN: 1941-6679-On-line Copy included as cognitive and economic factors. This present study adopts TAM to evaluate individual intention to use cloud computing. The major contribution of this paper is to examine the amount of variability in individual intention to use cloud computing that perceived risks, perceived benefits, perceived ubiquity, perceived costs, and job relevance accounts after controlling for firm size, industrial sector, and organizational structure.
The rest of the paper is therefore structured as follows: Section 2 presents a theoretical background, literature review on cloud computing, cloud computing adoption in business and individual level, section 3 discusses the research methodology, section 4 presents the data analysis and discussion of findings, and lastly section 5presents the implications, conclusions, limitations and future research directions of the study. The last part of the paper is a limitation and future work.
THEORETICAL BACKGROUND
Technology Acceptance Model (TAM)
The technology acceptance model (TAM) is one of the finest acknowledged models was given by Davis (1989) to predict and explain the acceptance and use of information technology (IT), based on behavioral intention and actual system usage. It is widely used by various researchers for its simplicity and robustness.
Davis (1989) developed TAM based on the theory of reasoned action (TRA) by replacing many of the measures of an attitude of TRA with two factors that are the measures of technology acceptance - perceived ease of use and perceived usefulness. Perceived usefulness is the degree to which a person believes that using a particular system would enhance his/her job performance, whereas perceived ease of use is the extent to which a person thinks that using a particular system would be free of effort. The TAM has been constantly studied and extended as TAM 2 by Venkatesh and Davis (2000) and Venkatesh (2000). The TAM2 model added theoretical constructs subjective norm, voluntariness, and image as social influence processes and job relevance, output quality, result demonstrability, and perceived ease of use as cognitive instrumental processes.
Unified Theory of Acceptance and Use of Technology (UTAUT) was another extension of TAM, proposed by Venkatesh et al. (2003). The purpose of the UTAUT model is to explain user intentions to use IT and its usage behavior with the help of four factors, namely, performance expectancy, effort expectancy, social
©International Information Management Association, Inc. 2017 54 ISSN: 1941-6679-On-line Copy influence, and facilitating conditions. Gender, age, experience, and voluntariness of use were taken as a moderator in this model. Another extension related to TAM was TAM 3, proposed by Venkatesh and Bala (2008), where all the determinants of perceived usefulness and perceived ease of use were added to examine their impact on behavioral intention and system usage.
Cloud computing
Cloud computing was originated in 1990 with the name of Active Server Page (ASP). In 1999, the Salesforce.com was a leading company in the market of cloud computing by delivering enterprise solutions with the help of a website. After that Amazon Web Service as a cloud service was launched by the company called Amazon in the year 2002. Then in 2006, Google Docs introduced to the forefront of public awareness. In the same year, Amazon introduced Elastic Compute Cloud (EC2) as a commercial service on the web by allowing individuals as well as smaller firms to lease computers for executing their computing applications. In 2007, across the United States, there was collaboration across industries including IBM, Google, and numerous universities. In 2008, Eucalyptus introduced the first open-source Amazon Web Services Application Programming Interfaces (AWS API) as a well-matched platform to install private clouds. Then the first open-source software, Open Nebula was introduced to deploy private as well as hybrid clouds. Microsoft penetrated the cloud computing market with Windows Azure in 2009. After that, many key players followed.
For business operations, cloud computing provides a platform that is flexible and highly scalable by outsourcing partial or full IT operations to carry out business using the public cloud (Armbrust et al., 2010). Cloud computing is a service-based technology that integrates both hardware and software distributed through a network on demand regardless of time and location (Marston et al., 2011). Web applications like Web-mail, Flickr, YouTube, and Google docs are widely used cloud services by individuals. Organizations also have begun to employ cloud computing as a means to meet their IT requirements (Lin and Chen, 2012). Its services include data storage, usage, and process on computers that are remotely located and accessed through the internet. Consumers can make use of cloud computing for storing information like pictures or e-mail and accessing software like social networks, videos, games, and music. Private data centers and IT departments can be replaced by cloud computing in public organizations.
With cloud computing, the firms can perform data transactions and data analysis and also value chain functions like sales and distribution, finance, manufacturing and customer service, information sharing and trading partner collaboration
©International Information Management Association, Inc. 2017 55 ISSN: 1941-6679-On-line Copy (Gartner, 2009; Pyke, 2009). Various players are providing cloud computing services economically (Marston et al., 2011).
Mell and Grance (2011) highlighted five important characteristics of cloud computing. On-demand self-service addresses an independent supply of IT resources without a user interface with the provider. Broad network access indicates the delivery of IT resources through the internet. Measured service means the regular control and fulfillment of resource requests optimally through pay per use method. Resource pooling means assembling of IT resources to supply to several consumers. Rapid elasticity describes a vigorous scaling up and down of resources with demand.
Cloud Computing and its usage and implementation in business
Zhang, Cheng and Boutaba (2010) highlighted convincing features that make cloud computing appeal to business owners, including no up-front investment as cloud computing uses a pay-as-you-go pricing model, lowering operating cost as resources in a cloud environment can be rapidly allocated and de-allocated on-demand, highly scalable as cloud providers pool large amount of resources from data centers and make them easily accessible to all the customers by expanding its service to large scales in order to handle rapid increase in service demand, easily accessible as cloud services are generally web-based and can be easily accessed through various devices with internet connection and last but not least reducing business risks and maintenance expenses as by outsourcing the service infrastructure to the cloud, the organization shifts its business risks to the cloud providers, who often have better proficiency and prepared for managing these risks. All types of organizations such as from small and medium-sized firms to MNCs can use cloud computing to access information anywhere. Different types of files and applications can be accessed, a range of services from data storage to functional programs can be provided and collaboration among a group of distant users is possible in a cloud environment. While discussing the emerging IT platform of cloud computing, Sharif (2010) reported that cloud computing is emerging as a potential technology by changing the way the internet and information systems are presently operated and used. Dwivedi and Mustafee (2010) identified the factors that support the adoption of cloud computing through arguments. They suggested concurrent development of several information and communication technologies (ICT) areas like parallel programming paradigms, open-source software, high-performance computing, Green IT, low-cost access-cum-computing devices, and high-speed networks.
©International Information Management Association, Inc. 2017 56 ISSN: 1941-6679-On-line Copy Wang et al. 2011 considered cloud computing as an inexpensive commodity that can be accessed by many businesses and individual customers. Marston et al. (2011) made SWOT (strengths, weaknesses, opportunities, and threats) analysis for cloud computing technology (CCT) and pointed out some key advantages of cloud computing for small firms to lower the cost of entry and benefit from compute-intensive business analytics. Sultan (2011) also found the commercial viability of cloud computing for many SMEs in terms of its flexibility and pay per use cost structure. By evaluating traditional IT services, Dhar (2012) made a comparison between global IT outsourcing and cloud computing and found cloud computing affecting IT outsourcing. He suggested that by analyzing the benefits of cloud computing and its business impacts, the CIOs should develop a short term and long term plan to switch over from the old system to the cloud computing model with the support of top management and stakeholders.
Lin and Chen (2012) examined the understanding and concerns of IT professionals about cloud computing in Taiwan. They found compatibility of a cloud with companies’ policy, IS development environment, business needs and relative advantages of adopting cloud solutions as the primary concerns. Ross and Blumenstein (2013) examined the role of HRM departments in supporting the organizational changes required to introduce cloud-based businesses. They found that cloud computing business models laid at the nexus of ICT and business strategies. Aleem et al. (2013) examined the vulnerabilities of the cloud platform affecting businesses trading on the internet and found that data loss and leakage were the top threat to cloud computing, followed by an account, service and traffic hijacking. Ratten (2014) examined the effects of privacy concerns and consumer innovativeness towards consumer's adoption of cloud computing technology and found that intention to adopt cloud computing services can be predicted by performance expectancy, perceived usefulness and perceived ease of use.
After interviewing executives of five major commercial banks in Ghana, Adjei (2015) found that trust as an essential factor for cloud computing service acquisition by financial institutions and trust increases if users perceive the acts of cloud service providers in honesty and users’ interest. Liu et al. (2016) analyzed the value creation potential of cloud computing in inter-firm partnerships and found that flexibility-related and integration-related features of cloud computing can create value for firms by facilitating inter-firm collaboration in exploiting business opportunities.
©International Information Management Association, Inc. 2017 57 ISSN: 1941-6679-On-line Copy
Cloud computing adoption at individual level
Because of nature, relevance, and orientation of research, the theories of the theory of reasoned action (TRA) and technology acceptance model (TAM) and its extensions help develop models related to cloud computing adoption by an individual. Some of the literature review deals with the adoption of cloud computing by an individual based on TRA and TAM are discussed below.
Using TRA, Benlian and Hess (2011) examined the risks and opportunities associated with the adoption of SaaS from the perspective of IT executives in adopter and non-adopter firms. Their results showed that overall risk perceptions were influenced by security threats and cost advantages as the most important opportunity factor for both adopters and non-adopters of SaaS. Based on the TAM-diffusion theory model, Wu (2011) examined eight factors influencing the adoption of SaaS that are Media Influence (MI), Social Influence (SI), Perceived Benefits (PB), and Attitude toward Technology Innovations (ATI), PU, PEOU, and BI and found PU and PEOU as two key factors of BI, in consistence with several previous studies. Behrend et al (2011) analyzed the factors that influence cloud computing adoption in urban and rural community colleges of higher education by analyzing a sequence of factors and outcomes. Using TAM3, they developed a path analytic model and found the influence of the ability of students to travel to campus on perceived usefulness and also the influence of direct experiences with the platform and instructor support on ease of use. Wu et al (2013) used the duo-theme decision-making trial and evaluation laboratory (DEMATEL) with TAM in developing an evaluation framework and recommended appropriate intervention activities to foster the acceptance of usages of cloud services, such as training, organizational support and peers’ support, etc.
By applying the Social Exchange Theory into TAM, Obeidat and Turgay (2013) developed a model to evaluate cloud computing adoption and found that cloud computing adoption leads to a sense of balance of cloud benefits over costs. Aharony (2015) made an exploratory study using TAM to examine the factors that may influence information professionals, namely librarians and information specialists in deciding to adopt cloud computing in their organizations. The findings suggested that high scores in PEOU and personal innovativeness were due to high scores in the adoption intention of cloud computing. Lal and Bharadwaj (2016) examined the factors that influence cloud computing adoption and its impact on the organizational flexibility in the perspective of information technology executives by applying TAM. Their results indicated that cloud computing provides a relative advantage in terms of scalability, accessibility, and deployment of service on demand.
©International Information Management Association, Inc. 2017 58 ISSN: 1941-6679-On-line Copy
Sabi et al. (2016) combined DOI with TAM to examine the decision-makers in the universities of sub-Saharan Africa to adopt cloud computing and found that the addition of socio-cultural factors provided a more significant assessment of the motivation of universities in the adoption of cloud computing. Sharma et al. (2016) extended TAM by incorporating three external variables of computer self-efficacy, trust, and job opportunity to determine the factors that influence cloud computing adoption by IT professionals. The results indicated that computer self-efficacy, perceived usefulness, trust, perceived ease of use, and job opportunity are the best predictors of cloud computing adoption. Arpaci (2017) applied TAM and examined the antecedents and outcomes of cloud computing adoption in education to achieve knowledge management (KM). The results showed that the perceived usefulness is significantly related to the expectations for knowledge creation and discovery, storage, and sharing. Asadi et al. (2017) investigated the factors influencing cloud computing adoption in the banking sector from the customer’s perspective and found that perceived usefulness, perceived ease of use, cost, attitude towards cloud and trust significantly influence behavioral intention to adopt cloud computing.
Although a large number of adoption studies used TAM in different contexts, all the features that are specific to cloud computing cannot captured by TAM as it uses only two constructs perceived ease of use and perceived usefulness, which have its limitations in explaining the intention to use IT, therefore it is important to include additional construct in order to extend original TAM for better modeling of the intention to use. It is also essential to include the size of the firm, organizational structure and industrial sector as a control variable to study cloud computing adoption in various kinds of firms.
Firm Size
Previous research found that the size of a firm is one of the major determinants of IT innovation (Dholakia and Kshetri, 2004; Hong and Zhu, 2006; Pan and Jang, 2008). Frambach and Schillewaert (2002) argued that SMEs are more innovative and flexible to make quick decisions on adopting new technologies like cloud computing. Low et al. (2011), Oliveira et al. (2014) highlighted that larger companies have resources to cover the cost and investment risk of cloud computing. On the other hand, smaller firms usually lack the resources needed for the creation of knowledge and the implementation and testing of cloud computing. According to Hsu et al. (2014), firms with more number of employees and greater IT budget implement cloud computing. These firms are generally large firms knowing the latest information technology and dynamic IT trends. According to Hsu and Lin (2016), small and medium-sized firms are adopting cloud computing due to its
©International Information Management Association, Inc. 2017 59 ISSN: 1941-6679-On-line Copy scaling flexibility and pay-as-you-go cost structure, while larger firms may be hesitant to adopt cloud computing because it involves the maintenance of their IT/IS infrastructure under the control of its provider. Hence, large firms focus on security issues related to cloud computing adoption whereas, smaller firms stress how adoption can enhance its relative advantage and decrease costs related to management, maintenance, operating and training (Hsu and Lin, 2016). Therefore firm size is taken as a control variable in the study.
Industry Type
Low et al. (2011) and Alismaili et al. (2015) highlighted that different industry sectors adopt cloud computing at a different rate. According to Joe Palian (2018), cloud computing adoption differs from industry to industry, mainly because of the dissimilar levels of security and IT capability. Regulated industries like banking and insurance are more hesitant to adopt cloud services. These companies rely on private cloud to store their data and use cloud services for administrative functions like email, file sharing and sharing of notes. Non-IT and supply-chain centric organizations like retail, media, manufacturing, pharmaceuticals, etc. have limited IT capabilities, therefore, they outsourced some or all of their IT-related tasks to cloud providers for a certain period. Retailing organizations are mostly implemented IaaS and PaaS service model of cloud service. In manufacturing firms, cloud service is used for logistics, sales support functions, HR, product development and life cycle management, as well as some manufacturing operations. According to Oliveira et al. (2014), factors influencing the adoption of cloud computing vary across different industries. According to Hsu and Lin (2016), industry type is projected as an important control variable affecting the level of cloud computing adoption. In earlier studies (Hsu and Lin, 2016), manufacturing firms were more inclined to adopt cloud computing than finance and service firms. CIO report (2010) highlighted the type of industries that are high in cloud computing adoption rates in India are mainly manufacturing, finance and information and communication technology. Therefore, industry type is added as a control variable for analyzing cloud computing adoption in Indian firms.
Organizational Structure
A management structure is how a firm organizes its management hierarchy and plays an important role in achieving the organizational goals by providing coordination between the various departments and divisions in an organization. Implementation of cloud computing requires top management support and business process reengineering therefore, organizational structure plays an important role in cloud computing adoption (Low et al., 2011). Chaudhary and Vithayathil (2013)
©International Information Management Association, Inc. 2017 60 ISSN: 1941-6679-On-line Copy highlighted that cloud computing adoption influence the organizational structure of the IT department of a firm. The author found that the cost-center organizational model is preferred over the profit-center model when cloud providers faced with high competition. The profit-center organizational structure delivers better internal quality improvement to cloud services than the cost center.
According to S Rajendran (2013), cloud computing adoption changes the operational model of the business. This requires changes in the present business processes, organizational structure, culture, and also governance model. According to Ali Farahani Rad (2013), cloud computing reduces the variable cost of IT i.e. the marginal cost of using IT capabilities. This can affect how things are done in the organization and also change the organizational structure of the organization, which in turn, affects performance. Thus it is obvious that cloud computing influences many stakeholders within the organization. Cloud computing adoption can produce different results based on the power and position of stakeholders in the firm and also their willingness to adopt the innovation (Rajendran, 2013). Therefore, an organizational structure is added as a control variable for analyzing cloud computing adoption in Indian firms.
Therefore, the size of the firm, organizational and industrial sector are taken as control variables to identify their impact on behavioral intention to use cloud computing. Previous studies focused mainly on cognitive factors and personal traits that impact user acceptance of cloud computing. It will be interesting to study the influence of technological, cognitive and economic factors along with the control variables like firm size, structure and industry type in cloud computing adoption. This is the motivation for proposing this work. Moreover, due to meager research work done in individual adoption of cloud computing, this research work is motivated and intended to fill this research gap to address those factors from the perspective of senior managers who decide the IT policy for the organization.
RESEARCH METHODOLOGY
Research Hypotheses
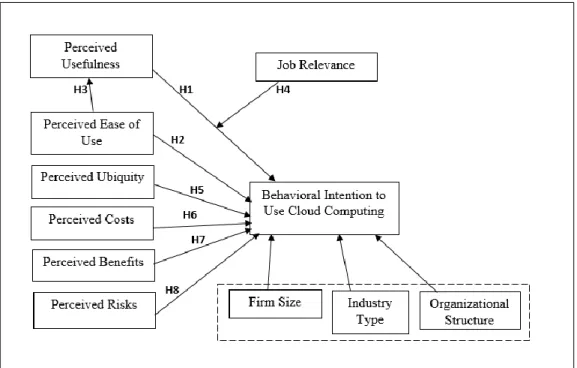
As shown in Figure 1, the proposed model is mainly based on TAM, with the addition of constructs like perceived ubiquity, perceived costs, perceived benefits and perceived risks. The variable ‘job relevance’ has been taken as a moderator in the model which moderates the relationship between perceived usefulness and intention to use cloud computing.
©International Information Management Association, Inc. 2017 61 ISSN: 1941-6679-On-line Copy
Figure 1. Cloud adoption model
The models also include control variables of the industrial sector, organizational structure, and size of the firm. The research model included eight constructs. Based on these constructs, the research hypotheses for this study ere formulated as follows:
Hypotheses related to cognitive factors and behavioral intention to use cloud computing
In the proposed model, under cognitive factors, three constructs are considered and they are perceived usefulness, perceived ease of use, and job relevance. Cognitive factors center on an individual’s mental assessment on matching important assigned works with the consequences of performing the related tasks using a system. (Venkatesh and Davis, 2000). Perceived usefulness and perceived ease of use are the two beliefs proposed by TAM (Venkatesh and Bala 2008). Perceived usefulness is the degree to which a person perceives that using IT will enhance his job performance while perceived ease of use is the degree to which a person perceives that using IT will be free of effort (Davis, 1989). Perceived usefulness was found as an important factor in cloud computing adoption as using cloud services can improve their business efficiency, performance, and productivity (Senk, 2013).
©International Information Management Association, Inc. 2017 62 ISSN: 1941-6679-On-line Copy Perceived usefulness was found as a direct influence on adoption intention whereas perceived ease of use was found the direct and indirect effect on adoption intention through perceived usefulness (Davis et al., 1989). Thus the following two hypotheses have been proposed to show the effects of perceived usefulness and perceived ease of use on behavioral intention to use cloud computing.
H1: Perceived Usefulness positively influences behavioral intention to use cloud computing.
H2: Perceived Ease of Use positively influences behavioral intention to use cloud computing.
The user will choose the system that is easier to operate and more useful between the two identical systems having the same set of functions, therefore it is proved that perceived ease of use has a significant direct influence on perceived usefulness (Davis, 1989).
H3: Perceived Ease of Use positively influences Perceived Usefulness.
Venkatesh and Davis (2000) found that job relevance is a factor that influences perceived usefulness. Likewise, Venkatesh and Bala (2008) concurred with Venkatesh & Davis (2000) that job relevance and output quality affect perceived usefulness. Petty & Cacioppo (1986) developed the Elaboration Likelihood Model (ELM) of persuasion to explain different ways of processing stimuli, the reason for their usage reason, and their results on change of attitude. This model was used by Bhattacherjee and Sanford (2006) to address the moderating effect of job relevance on the relationship between perceived usefulness and attitude in IT adoption. If the user finds the technology relevant and useful to their job, he will increase his intention to use it. In the case of adoption of mobile wireless technology, Kim (2008) and Kim and Garrison (2009) examined the moderating role of job relevance on the relationship between perceived usefulness and behavioral intention and reported that use of mobile technology on the job- related tasks form individual’s attitudes and behaviors toward using technology. Therefore, there is a need to test the influence of job relevance on the relationship between perceived usefulness and behavioral intention to use cloud computing.
H4: Job Relevance moderates the effect of Perceived Usefulness on behavioral intention to use cloud computing.
©International Information Management Association, Inc. 2017 63 ISSN: 1941-6679-On-line Copy
Hypotheses related to technological factors and behavioral intention to use cloud computing
Technological factors center on features of the technologies that can influence the technology adoption process (Tornatzky and Fleischer, 1990). Technological factors refer to the IT-specific requirements, benefits, and risks associated with cloud computing adoption. In the proposed model, the four constructs taken under the technological factors include Perceived Ubiquity, Perceived Benefits, and Perceived Risks.
Perceived Ubiquity is the extent to which an individual perceives that technology provides personalized and constant connection and interactions among individuals and/or networks (Kim and Garrison, 2009). Ubiquitous property of cloud computing allows its availability and accessibility anywhere and anytime which in turn, influence its adoption (Park and Ryoo, 2013). Therefore, it is hypothesized that perceived ubiquity has a positive influence on behavioral intention to use cloud computing.
H5: Perceived Ubiquity positively influences behavioral intention to use cloud computing.
Hsu et al. (2014) stated that perceived benefit is the positive belief of the consequences that are triggered by a certain action. Cost reduction, scalability, portability, as well as reduced software and hardware obsolescence are some of the perceived benefits of cloud computing (Ross and Blumenstein, 2013). Therefore, it is hypothesized that perceived benefits have a positive influence on behavioral intention to use cloud computing.
H7: Perceived Benefits positively influence behavioral intention to use cloud computing.
Hsu et al. (2014) highlighted that perceived risk is the business concerns of a firm while adopting a technology. Perceived risks related to cloud computing are data lock-in, confidentiality, insufficient service quality guarantee, bandwidth bottlenecks, and reliability (Armbrust et al., 2010; Hsu et al., 2014). Sabi et al. (2016) highlighted that other technological attributes of cloud computing such as data security and risks associated with the adoption and usage of cloud computing are expected to directly impact on the diffusion of the technology. Venters and Whitley (2012) hypothesize that the cloud severely affects an organization’s IT structure and interfaces by presenting key risks related to identity management, governance, compliance, software isolation, security responses, and so on.
©International Information Management Association, Inc. 2017 64 ISSN: 1941-6679-On-line Copy Therefore perceived risks may have a negative effect on behavioral intention to use cloud computing.
H8: Perceived Risks negatively influence behavioral intention to use cloud computing.
Hypotheses related to economic factors and behavioral intention to use cloud computing
Phonthanukitithaworn et al. (2015) defined perceived cost as the extent to which a person perceived the cost of using a particular technology. Cloud computing implementation involves various investments to procure hardware, software and their networking, hence cost can be deciding factor for its adoption. Kuan and Chau (2001) and Premkumar and Roberts (1999) used set-up cost, maintenance cost and cost related to training and running of software and hardware as items to measure perceived costs. Therefore, it is hypothesized that perceived costs influence behavioral intention to use cloud computing.
H6: Perceived Costs influence behavioral intention to use cloud computing.
Measurement
The proposed research model consists of 8 constructs and a total of 36 items or indicators. The measurement scales for all the constructs adapted from previous studies are extensively familiar and used. A questionnaire-based survey was conducted to collect data relevant to the study. Under perceived usefulness, five items of usefulness, efficiency, effectiveness, performance, and productivity were adopted from the scale of Davis et al. (1989) and Venkatesh and Davis (2000). Similarly, the six items of perceived ease of use and three items of behavioral intention to use as reported by the above authors have been transformed into the respective questions under the two constructs specified. The three measures of the construct, Job Relevance, as adopted from Venkatesh and Davis (2000) have been converted into three questions. All the specified literature sources are linked to technologies other than cloud computing and hence the measures adopted from such studies have been modified, to reflect a cloud computing context. Three questions have been developed to measure perceived ubiquity of cloud computing by using the three items of providing communication and network accessibility, anytime-and-anywhere communication and connectivity, and using technology for personal and business purposes, adopted from Kim and Garrison (2009). In the same way, following the research report of Hsu et al. (2014), six items of perceived benefits and seven items of perceived risks have been transformed into the same
©International Information Management Association, Inc. 2017 65 ISSN: 1941-6679-On-line Copy number of meaningful questions. The above scales of measurement were found applicable to cloud computing and they have been adopted without any changes in this study. Following the reports of Premkumar and Roberts (1999) and Kuan and Chau (2001), the three measures of the construct of Perceived Costs (set-up, training and running/maintenance of software and hardware) have been transformed into three relevant questions in this study.
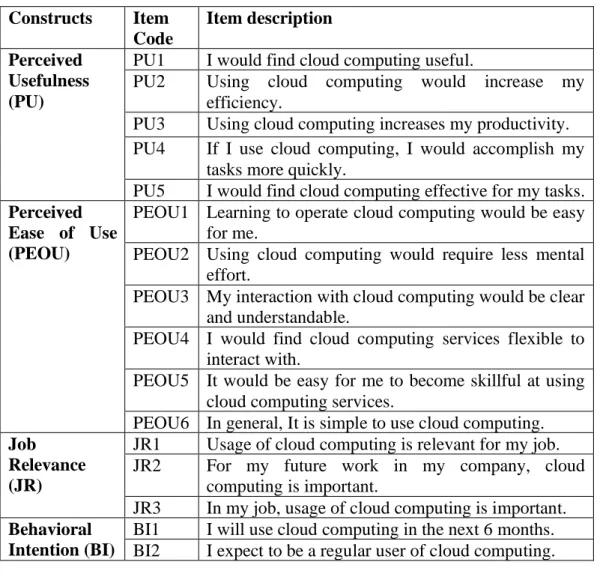
All the items in the questionnaire were measured using a five-point Likert scale with responses ranging from “strongly disagree” to “strongly agree.” All the items used in the questionnaire are presented in Table 3.
Table 3. Summary of variables and respective questionnaire items. Constructs Item Code Item description Perceived Usefulness (PU)
PU1 I would find cloud computing useful.
PU2 Using cloud computing would increase my efficiency.
PU3 Using cloud computing increases my productivity. PU4 If I use cloud computing, I would accomplish my
tasks more quickly.
PU5 I would find cloud computing effective for my tasks.
Perceived Ease of Use (PEOU)
PEOU1 Learning to operate cloud computing would be easy for me.
PEOU2 Using cloud computing would require less mental effort.
PEOU3 My interaction with cloud computing would be clear and understandable.
PEOU4 I would find cloud computing services flexible to interact with.
PEOU5 It would be easy for me to become skillful at using cloud computing services.
PEOU6 In general, It is simple to use cloud computing.
Job Relevance (JR)
JR1 Usage of cloud computing is relevant for my job. JR2 For my future work in my company, cloud
computing is important.
JR3 In my job, usage of cloud computing is important.
Behavioral Intention (BI)
BI1 I will use cloud computing in the next 6 months. BI2 I expect to be a regular user of cloud computing.
©International Information Management Association, Inc. 2017 66 ISSN: 1941-6679-On-line Copy BI3 I intend to use cloud computing in the next 6 months.
Perceived Ubiquity (PUB)
PUB1 In my job, cloud computing providing communication and network accessibility “anytime-and-anywhere” is very crucial.
PUB2 In my job, cloud computing provides me anytime-and-anywhere communication and connectivity. PUB3 How frequently do you use cloud computing for
personal and business purposes?
Perceived Benefits (PB)
PB1 Cloud services can be customized and designed based on company’s needs.
PB2 Cloud services can analyze data on the Internet simultaneously
PB3 Cloud services can shorten IS deployment time. PB4 Cloud services can reduce IT expense (ex: IT
devices, IT maintenances, etc.).
PB5 Cloud services can reduce IT personnel.
PB6 Once connected to the Internet, users can use the system (Mobility).
Perceived Risks (PR)
PR1 Cloud computing leads to customer or confidential information leakage.
PR2 Cloud computing is difficult to integrate with previous IT systems.
PR3 Cloud cannot provide solid quality guarantee. PR4 Cloud computing has poor network transfer speed. PR5 Cloud computing leads to unexpected service
outages
PR6 Cloud computing leads to underperformance of the software and hardware
PR7 Cloud computing restricted to a particular provider, difficult to switch (Data Lock-in).
Perceived Costs (PC)
PC1 The cost of establishing cloud computing technology is high.
PC2 The cost of maintaining cloud computing technology is high.
PC3 The cost of cloud computing technology user training is high.
Sampling design and data collection
The respondents are selected from the database of a project consultancy company, NIIR (National Institute of Industrial Research), which includes 7448 of SMEs and
©International Information Management Association, Inc. 2017 67 ISSN: 1941-6679-On-line Copy large firms of India. Simple random sampling was done to select the sample from the sampling frame. The firms belong to the sectors of IT, service, manufacturing, finance, and telecommunication. The locations of the companies are Hyderabad, Bangalore, Mumbai, Chennai, and Delhi. This study used the questionnaire as the survey instrument to gather data from these organizations. Emails were sent to the senior managers to know whether they have experience in using cloud computing and how long their firm has been using cloud computing. This is to identify whether the firm is a potential adopter or non-adopter of cloud computing. Respondents are senior managers or IT professionals who are decision-makers in the firm. These managers are responsible for the implementation of cloud computing in the firm. They were also asked to express their interest to fill the questionnaire on cloud computing. This research adopts a simple random sampling approach and chooses senior managers of the firms in India. The total duration of data collection was 5 months and 24 days. Out of 550 filled questionnaires, 12 cases were incomplete and hence they were removed. So the final sample size came down to 538. A total of 1000 questionnaires were distributed, of which 538 usable questionnaires were collected indicating a response rate of 53.8%.
Detailed descriptive statistics relating to the respondent’s characteristics are shown in Table 1. The demographic profile of 538 respondents is done in terms of age, gender, and overall experience. The gender distribution shows 86% male and 14% female respondents, while the age distribution of respondents shows the maximum respondents are between the age group of 25 and 30. In this study the target firms are mainly IT (Information Technology), ITES ((IT-enabled services), Services (Consultancy, healthcare, retail, and telecommunication), finance, manufacturing, and pharmaceuticals because these firms have high cloud computing adoption rate as per CIO report (2010).
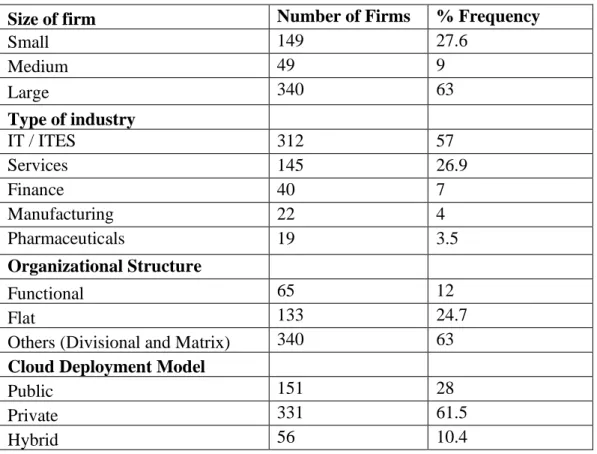
The demographic profile of firms is also done in terms of the type of industry, size of the firm and organizational structure of firms has been examined and presented in Table 2. In the case of the industrial sector, Table 2 shows that IT/ITES and service industries scored the highest of 57% and 26.9% respectively followed by financial and manufacturing sectors with a percentage frequency of 7 and 4 whereas the pharmaceutical industry had a percentage frequency of 3.5. The firms may be categorized into three sizes, namely, small, medium and large firms, based on the size of workforce and turnover. According to Gangwar et al. (2015), small-sized firms have employees less than 400 and turnover less than 75 crores, whereas medium-sized firms have employees between 400 to 800 and turnover between 40 to 300 crores and large firms have employees above 800 and turnover above 300
©International Information Management Association, Inc. 2017 68 ISSN: 1941-6679-On-line Copy crores. In the study, 63% of the firms are large-sized firms with 27.6% small firms and 9% medium-sized firms.
An organizational structure describes how the activities of task allotment, management, and control are oriented towards the accomplishment of organizational goals. There are four common types of organizational structures prevailing in the firms. The first, and most common, is a functional structure. A functional organization is divided into smaller groups based on specialized functional areas, such as IT, finance, or marketing and is a common organizational structure. Most SMEs are implementing a functional structure. Another type of organizational structure is common in large enterprises i.e. divisional or multi-divisional structure in which a company configures its leadership team based on the products, projects or subsidiaries they operate. Another type of structure is common for start-up firms i.e. flat. It flattens the hierarchy and chain of command and gives its employees a lot of autonomy. The last organizational structure is a matrix structure. These structures matrixes employees across different superiors, divisions or departments and it prevails in large-sized firms.
In the present data analysis, organizational structures of divisional and matrix have been considered under the ‘Others’ category. Table 2 shows that 63% of the firms fall in the other category of organizational structure. 12% of the firms have functional structure and 24.7% belong to a flat structure.
Table 1. Demographic profile of respondent
Age Respondents % Frequency
25-30 years 265 49 30-40 years 178 33 40-50 years 72 13 >50 years 23 4 Gender Male 464 86 Female 74 14 Total experience 2-5 years 138 25 5-10 years 293 54 10-15 years 65 12 >15 years 42 8
©International Information Management Association, Inc. 2017 69 ISSN: 1941-6679-On-line Copy
Table 2. Demographic profile with respect to firm
Size of firm Number of Firms % Frequency
Small 149 27.6 Medium 49 9 Large 340 63 Type of industry IT / ITES 312 57 Services 145 26.9 Finance 40 7 Manufacturing 22 4 Pharmaceuticals 19 3.5 Organizational Structure Functional 65 12 Flat 133 24.7
Others (Divisional and Matrix) 340 63
Cloud Deployment Model
Public 151 28
Private 331 61.5
Hybrid 56 10.4
DATA ANALYSIS AND INTERPRETATION
Data analysis was done using exploratory factor analysis and hierarchical multiple regression using Statistical Package of Social Science (SPSS) version 21.
Results of Exploratory Factor Analysis (EFA)
EFA is used to check the data adequacy of data to perform factor analysis, total variance explained and the loading of items on the respective factors. The KMO value is derived as 0.885, which is well in the acceptable range (Field, 2009) by revealing adequacy of data. It is also supported by Bartlett’s test which produced a significant (0.000) test result. Overall, 8 clear factors are extracted from the exploratory factor analysis that accounted for explaining 78.372 % of the variance. All the items are well loaded with loading values above 0.50 on the respective factors. Appendix 1 shows the rotation component matrix for factor loading.
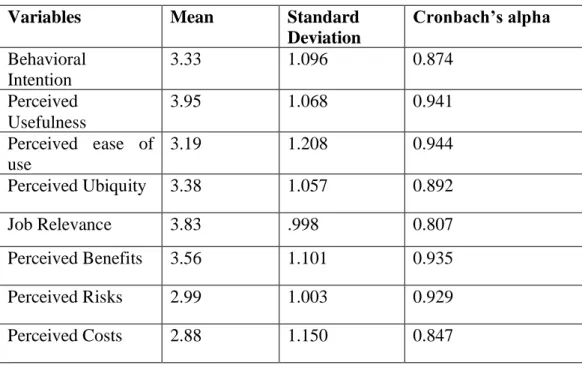
©International Information Management Association, Inc. 2017 70 ISSN: 1941-6679-On-line Copy Harman’s one-factor test was used to check Common method bias. The result showed that eight factors are present and the covariance explained by one factor in the dataset was 28.316%. This indicates that common method bias is unlikely a problem in this study. All measurement scales showed high reliability, with Cronbach’s alpha values exceeding 0.80 as shown in Table 4. Construct validity was strongly supported both by principal component analysis with Varimax rotation method, in which all cross loadings were lower than 0.40 and all factor loadings were more than 0.50.Correlation analyses were used in hypotheses testing. The results of correlation analyses were presented in Table 5.
Table 4. Mean, standard deviation and Cronbach’s alpha of all the scale items Variables Mean Standard
Deviation Cronbach’s alpha Behavioral Intention 3.33 1.096 0.874 Perceived Usefulness 3.95 1.068 0.941 Perceived ease of use 3.19 1.208 0.944 Perceived Ubiquity 3.38 1.057 0.892 Job Relevance 3.83 .998 0.807 Perceived Benefits 3.56 1.101 0.935 Perceived Risks 2.99 1.003 0.929 Perceived Costs 2.88 1.150 0.847
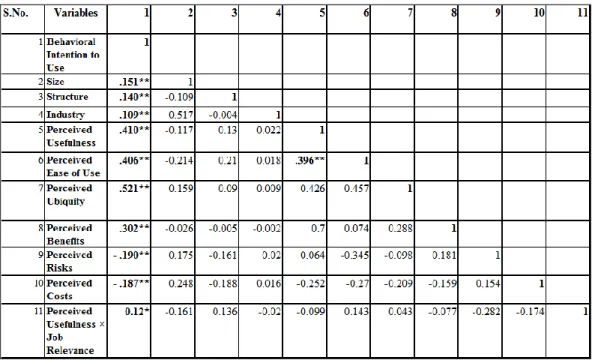
The result of correlation analysis supported the entire eight hypotheses. The result showed that firm size organizational structure and industry type were significantly correlated with behavioral intention (r = -.151, r = .140 and r = .109 respectively, p < 0.01). Perceived Usefulness and Perceived Ease of use are positively correlated with behavioral intention (r = 0.410 and 0.406 respectively, p < 0.01), thus supported hypotheses H1 and H2. However, perceived risks and perceived costs are negatively correlated with behavioral intention (r = -0.190 and -0.187 respectively, p < 0.01), thus supported hypotheses H6 and H8. The analysis showed positive correlation between perceived ease of use and perceived usefulness (r = 0.396, p < 0.01), thus supported H3. Perceived ubiquity and perceived benefits were positively
©International Information Management Association, Inc. 2017 71 ISSN: 1941-6679-On-line Copy correlated with behavioral intention (r = 0.521 and 0.302 respectively, p < 0.01), thus supported hypotheses H5 and H7.Interaction term (perceived usefulness × job relevance) was also found positively correlated with behavioral intention. This means job relevance act as moderator in the relationship between perceived usefulness and behavioral intention (r = 0.12, p < 0.05), thus supported hypothesis H4.
Table 5. Correlation among variables (N = 538)
Note: * p- value < 0.05, ** p-value < 0.01
Results of Hierarchical Multiple Regression (HMR)
Hierarchical multiple regression indicates a sequential entry of variables in order to control for the effects of covariates or to test the effects of predictors independent of the influence of others. The entry in hierarchical regression is done in steps or blocks in SPSS. In this study, hierarchical regression analysis is used to examine the amount of variability in behavioral intention to use cloud computing that perceived risks, perceived benefits, perceived ubiquity, perceived costs and job relevance accounts after controlling for firm size, industrial sector and organizational structure. Hierarchical regression analysis were conducted to test the relative explanatory values of three sets of variables on behavioral intention to use cloud computing: (1) the control variables (firm size, structure and industry type)
©International Information Management Association, Inc. 2017 72 ISSN: 1941-6679-On-line Copy (2) six independent variables in which two are cognitive factors (perceived ease of use and perceived usefulness), three are technological factors (perceived ubiquity, perceived risks, perceived benefits) and one economic factor (perceived costs) (3) moderating variable (job relevance).
These variables were entered in the analysis as three different blocks. The firm’s specific demographic factors such as industry type, organizational structure and firm size were entered and controlled in block 1.A set of six independent variables were entered in second block. Moderator variable of job relevance was entered in third block. A three stage HMR was conducted to examine the relationship between the set of six independent variables against the dependent variable of behavioral intention to use cloud computing after controlling the effects of firm size, structure and industry type. Each block (1, 2, and 3) can be represented as model 1, model 2 and model 3.
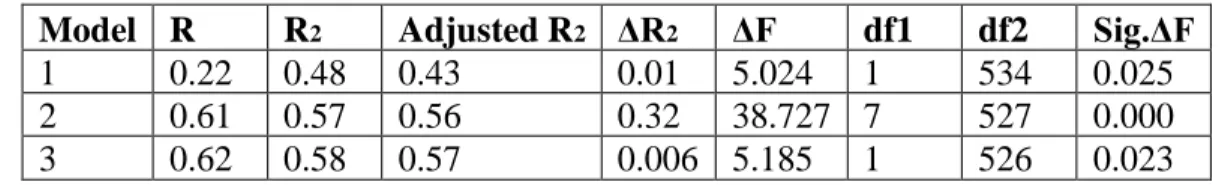
Table 6. Model Summary of Hierarchical Multiple Regression
Model R R2 Adjusted R2 ΔR2 ΔF df1 df2 Sig.ΔF
1 0.22 0.48 0.43 0.01 5.024 1 534 0.025
2 0.61 0.57 0.56 0.32 38.727 7 527 0.000
3 0.62 0.58 0.57 0.006 5.185 1 526 0.023
a. Predictors: (Constant), Size, Structure, Industry
b. Predictors: (Constant), Size, Structure, Industry, Perceived Benefit, Perceived Risks, Perceived Costs, Perceived Ubiquity, Perceived Usefulness, Perceived Ease of Use
c. Predictors: (Constant), Size, Structure, Industry, Perceived Benefit, Perceived Risks, Perceived Costs, Perceived Ubiquity, Perceived Usefulness, Perceived Ease of Use, Interaction term (PUJR)
d. Dependent Variable: Behavioral Intention to Use
From Table 6, Model 1 with size, industry type and structure as predictors of behavioral intention, the R2 value was 0.048, thus a positive relationship existed between predictor variables and behavioral intention. The R2 value of 0.048 or 4.8% was significant at F (1,534) = 5.024, p <0.05, since it could account for 4.8% of the variance. Model 2, with nine predictor variables (Size, Structure, Industry, Perceived Benefit, Perceived Risks, Perceived Costs, Perceived Ubiquity, Perceived Usefulness, and Perceived Ease of Use), was an improvement over the earlier model, gave a better value of R escalated from 0.220 to 0.610, with an R2of 0.57 and an R2change of 0.32, thus 57% of the variance had been accounted for. The change in R2was significant at F (7, 527), p<0.05, this showed that second set
©International Information Management Association, Inc. 2017 73 ISSN: 1941-6679-On-line Copy of predictor variables contributed significantly towards behavioral intention to use cloud computing. Model 3 with addition of moderator variable ‘job relevance’ gave a better value of R escalated from 0.61 to 0.62, with an R2value of 0.58 and an R2change of 0.006, thus 58% of the variance had been accounted for. After controlling for all firm’s specific demographic variables in Model 1, Both Model 2 and 3 significantly explained the variance in behavioral intention to use cloud computing (F(7, 527) = 38,727 and F(1,526) = 5,185, p<0.05).Thus the findings showed that all the models significantly contributed towards behavioral intention to use cloud computing. The result showed that all the independent variables explain additional 32.3% of variance in intention to use cloud computing. Based on standardized beta coefficients (β) values in Model 1, the result shows that the impact of firm size is found highest among other control variables in explaining the amount of variability in behavioral intention to use cloud computing.
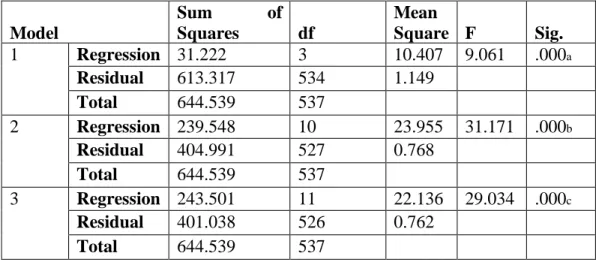
Table 7. ANOVA Results of the Three stage Model Hierarchical Regression Analysis Model Sum of Squares df Mean Square F Sig. 1 Regression 31.222 3 10.407 9.061 .000a Residual 613.317 534 1.149 Total 644.539 537 2 Regression 239.548 10 23.955 31.171 .000b Residual 404.991 527 0.768 Total 644.539 537 3 Regression 243.501 11 22.136 29.034 .000c Residual 401.038 526 0.762 Total 644.539 537
df means degrees of freedom; F is the calculated value of the Analysis of variance (ANOVA)
The ANOVA result (Table 7) highlights the significance of each of the three models (three predictors, nine predictors, ten predictors respectively). It could be seen that all three models were significant at p<0.05 respectively. It was noted in particular that the F value was largest for the model with nine predictors i.e. Model 2. F values were the overall predictive effects which were different from the F for the amount of change experienced when adding an additional variable.
©International Information Management Association, Inc. 2017 74 ISSN: 1941-6679-On-line Copy
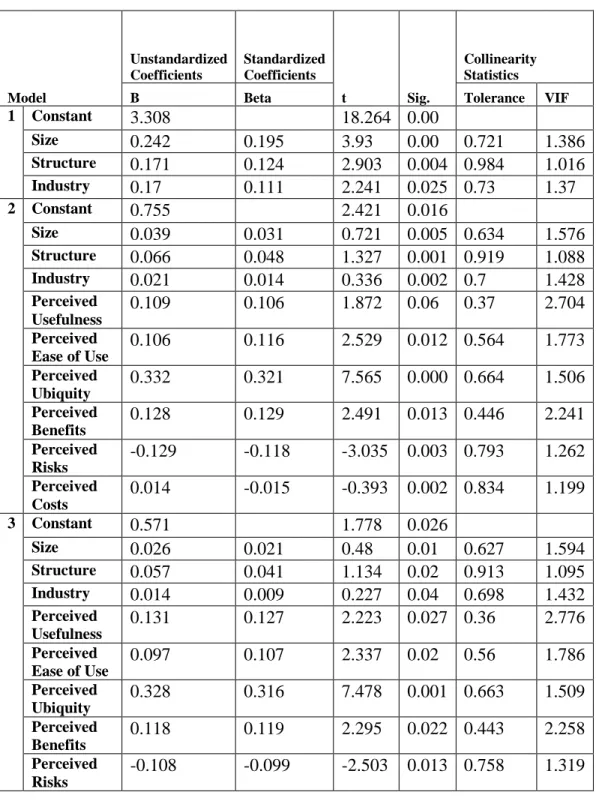
Table 8. Summary of Hierarchical Regression analysis for variables predicting Behavioral Intention to Use Cloud Computing
Model Unstandardized Coefficients Standardized Coefficients t Sig. Collinearity Statistics
B Beta Tolerance VIF
1 Constant 3.308 18.264 0.00 Size 0.242 0.195 3.93 0.00 0.721 1.386 Structure 0.171 0.124 2.903 0.004 0.984 1.016 Industry 0.17 0.111 2.241 0.025 0.73 1.37 2 Constant 0.755 2.421 0.016 Size 0.039 0.031 0.721 0.005 0.634 1.576 Structure 0.066 0.048 1.327 0.001 0.919 1.088 Industry 0.021 0.014 0.336 0.002 0.7 1.428 Perceived Usefulness 0.109 0.106 1.872 0.06 0.37 2.704 Perceived Ease of Use 0.106 0.116 2.529 0.012 0.564 1.773 Perceived Ubiquity 0.332 0.321 7.565 0.000 0.664 1.506 Perceived Benefits 0.128 0.129 2.491 0.013 0.446 2.241 Perceived Risks -0.129 -0.118 -3.035 0.003 0.793 1.262 Perceived Costs 0.014 -0.015 -0.393 0.002 0.834 1.199 3 Constant 0.571 1.778 0.026 Size 0.026 0.021 0.48 0.01 0.627 1.594 Structure 0.057 0.041 1.134 0.02 0.913 1.095 Industry 0.014 0.009 0.227 0.04 0.698 1.432 Perceived Usefulness 0.131 0.127 2.223 0.027 0.36 2.776 Perceived Ease of Use 0.097 0.107 2.337 0.02 0.56 1.786 Perceived Ubiquity 0.328 0.316 7.478 0.001 0.663 1.509 Perceived Benefits 0.118 0.119 2.295 0.022 0.443 2.258 Perceived Risks -0.108 -0.099 -2.503 0.013 0.758 1.319
©International Information Management Association, Inc. 2017 75 ISSN: 1941-6679-On-line Copy Perceived Costs -0.025 -0.026 -0.681 0.012 0.821 1.218 Perceived Usefulness × Job Relevance (PUJR) 0.121 0.085 2.277 0.023 0.842 1.187
Dependent Variable: Behavioral Intention to Use Cloud Computing
For the problem of multi-collinearity to be encountered, tolerance has to be close to zero while variance inflation factor (VIF) has to be close to 10, but that was not the situation as revealed in Table 8. This implies that there was no multi-collinearity (Coakes, 2005). From Table 5, the β coefficients for the constant and ten predictors including control and moderator variables were as follows; Constant β = 0.571, t = 1.778, p = 0.026: significant; Size, β = 0.026, t = 0.48, p = 0.01: significant; Structure, β = 0.57, t = 1.134, p = 0.02: significant; Industry, β = 0.014, t = 2.223, p = 0.04: significant; Perceived Usefulness, β = 0.131, t = 2.223, p = 0.027: significant; Perceived Ease of Use, β = 0.097, t = 2.337, p = 0.020: significant; Perceived Ubiquity, β = 0.328, t = 7.478, p = 0.001: significant; Perceived Benefits, β = 0.118, t = 2.295, p = 0.022: significant; Perceived Risks, β = -0.108, t = -2.503, p = 0.013: significant; Perceived Costs, β = -0.025, t = -0.681, p = 0.012: significant; Interaction term (PUJR), β = 0.121, t = 2.277, p = 0.023: significant. Hierarchical multiple regression was also performed to check the impact of perceived ease of use on behavioral intention, both directly and indirectly via its impact on perceived usefulness.
©International Information Management Association, Inc. 2017 76 ISSN: 1941-6679-On-line Copy
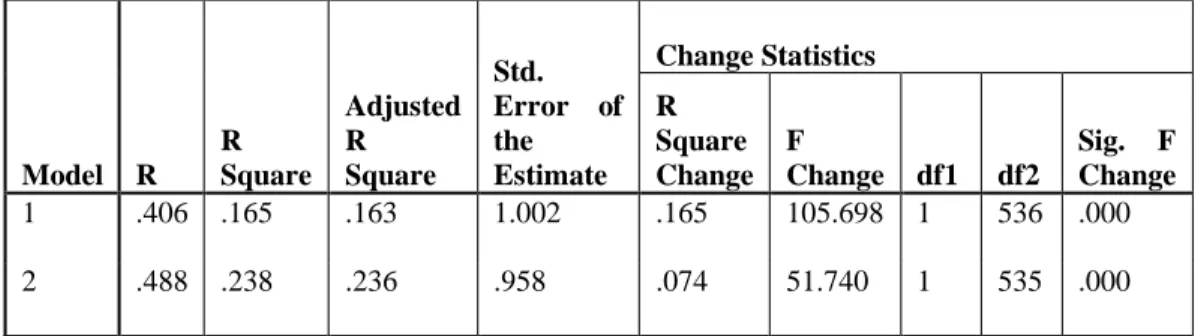
Table 9. Summary result of direct and indirect impact of perceived ease of use on behavioral intention Model R R Square Adjusted R Square Std. Error of the Estimate Change Statistics R Square Change F Change df1 df2 Sig. F Change 1 .406 .165 .163 1.002 .165 105.698 1 536 .000 2 .488 .238 .236 .958 .074 51.740 1 535 .000 a. Predictors: (Constant), perceived ease of use
b. Predictors: (Constant), perceived ease of use, perceived usefulness c. Dependent Variable: behavioral intention
A summary in Table 9 indicates that the first step explains 16.5 percent of the variance in company behavioral intention, F (1, 536) = 105.698, p = 0.000. As expected, the majority of the variance explained in behavioral intention could be attributed to perceived ease of use. Results from the second step of the regressions reveal that through the presence of mediating variable (perceived usefulness) the amount of variance explained in behavioral intention increases by approximately 7.4percent, F (1, 535)= 51.740, p= 0.000.Hence, the evidence supports the inference that the perceived usefulness mediate the relationship between perceived ease of use and behavioral intention. Hierarchical regression results showed that there is indirect relationship between perceived ease of use and behavioral intention via perceived usefulness (β = 0.289, t = 2.295, p < 0.01).
The best fitting model for predicting behavioral intention to use cloud computing from the above analysis would be the linear combination of the constant, firm size, organizational structure, perceived usefulness, perceived ease of use, perceived ubiquity, perceived benefits, perceived risks, perceived costs and interaction of perceived usefulness and job relevance on behavioral intention.
©International Information Management Association, Inc. 2017 77 ISSN: 1941-6679-On-line Copy
The Model
Y (Behavioral Intention to Use Cloud Computing) = β0 + β1(Firm Size)
+β2(Structure)+ β3(Industry Type) + β4(Perceived Usefulness) + β5(Perceived
Ease of Use) + β6(Perceived Ubiquity) + β7(Perceived Benefits) + β8(Perceived
Risks) + β9(Perceived Costs) + β10(Perceived Usefulness × Job Relevance)
Where, β0, β1, β2, β3, β4, β5, β6, β7and β8are respectively 0.571, 0.026, 0.057, 0.014,
0.131, 0.097, 0.328, 0.118, -0.108, -0.025 and 0.121.
Table 10. Result of hypotheses tested using hierarchical multiple regression analysis Hypothesis Statement Standardized coefficients (β values) Significant t value Result H1 Perceived Usefulness → Behavioral intention 0.131 0.027 Supported H2
Perceived Ease of Use
→ Behavioral intention
0.097 0.020 Supported
H3
Perceived Ease of Use
→ Perceived Usefulness 0.289 0.000 Supported H4 Perceived Usefulness x Job Relevance →Behavioral intention 0.121 0.023 Supported H5 Perceived Ubiquity→Behavioral intention 0.328 0.001 Supported H6 Perceived Costs→Behavioral intention -0.025 0.012 Supported H7 Perceived Benefits→Behavioral intention 0.118 0.022 Supported H8 Perceived Risks→Behavioral intention -0.108 0.013 Supported
©International Information Management Association, Inc. 2017 78 ISSN: 1941-6679-On-line Copy
DISCUSSION
Consistent with previous studies related to technology adoption, the present study also finds that an individual’s decision to adopt an innovation is influenced by the individual’s perception of ease of use and usefulness (Davis et al., 1989). As per previous studies based on TAM, this study also found the relationship between perceived ease of use and intention to use is mediated by perceived usefulness. According to Lian et al. (2014), establishing a private cloud computing deployment model is an expensive investment for the firms and therefore the significance of cost concern becomes quite noticeable. Costs are higher in the private cloud model as the company has to buy all the servers required and pay to the staff handling the cloud. According to Sabi et al. (2016), economic factors such as cost are expected to be moderated by the size of the organization such that larger organizations will more easily afford the cost of cloud computing than smaller organizations. Thus the findings of the study also coincide with the previous research that perceived costs negatively influence behavioral intention to adopt cloud computing. The result also showed that perceived ubiquity and perceived benefits positively influence behavioral intention to use cloud computing. The moderating role of job relevance was also found significant in the relationship between perceived usefulness and behavioral intention to use cloud computing as suggested by Kim (2008) and Kim and Garrison (2009) in the case of mobile technology.
The firm’s specific demographic variables such as firm size, organizational structure, and industry type were found significantly influencing organizational intention to use cloud computing. The result was consistent with a previous study done by Pan and Jang (2008) and Low et al. (2011), that due to economic factors, the size of the firm is one of the major factors of IT adoption. According to Gruman (2008), small-sized firms are adopting cloud computing because of the benefits of cost savings and cost reduction related to IT infrastructure as it can add capacities quickly to an IT system without investing in new expensive infrastructure, buying new software, or training new personnel. Whereas large-sized firms with mature IT infrastructure are adopting cloud computing for better management of unexpected turmoil or risk brought by cloud, without excessive economic impact. Pan and Jang (2008), Zhu et al. (2004) reported that firm size is an essential factor for IT adoption and large firms tend to adopt more innovations, largely due to their greater flexibility and ability to take risk as adopting cloud computing may also cause organizational risk related to customer’s data protection and privacy, problems with data segregation in the cloud and long-term viability of the cloud computing provider (Brodkin, 2008).