Wayne State University Dissertations
1-1-2014
Economic Determinants Of Quality Of Care In
Nursing Homes
Wei Lu
Wayne State University,
Follow this and additional works at:http://digitalcommons.wayne.edu/oa_dissertations Part of theEconomics Commons
This Open Access Dissertation is brought to you for free and open access by DigitalCommons@WayneState. It has been accepted for inclusion in Wayne State University Dissertations by an authorized administrator of DigitalCommons@WayneState.
Recommended Citation
ECONOMIC DETERMINANTS OF QUALITY OF
CARE IN NURSING HOMES
by
WEI LU
DISSERTATION
Submitted to the Graduate School
of Wayne State University,
Detroit, Michigan
in partial fulfillment of the requirements
for the degree of
DOCTOR OF PHILOSOPHY
2014
MAJOR: ECONOMICS
Approved by:
________________________________
Advisor Date
________________________________
________________________________
________________________________
ii
ACKNOWLEDGMENTS
I would like to thank my advisor Dr. Gail Jensen Summers for all the valuable guidance and help she has given me through the years of my study and research. I would like to thank my dissertation committee members Dr. Li Way Lee, Dr. Allen Goodman and Dr. Janet Hankin for their support and advice to my work. I am also thankful for the resources and opportunities provided by the Department of Economics and the Institute of Gerontology at Wayne State University. Especially, I am grateful for the funds Dr. Lee and the Institute of Gerontology provided to help me obtain the CASPER data set. I am also grateful to Dr. Stevenson and Dr. Grabowski for providing the assisted living supply data used in my analyses.
I want to express my gratitude to my parents for their love and encouragement, and to my husband Xiangping Bu for his love and support.
iii
TABLE OF CONTENTS
Acknowledgements..……….….ii
List of Tables………..v
Chapter 1: Introduction………1
Chapter 2: Effects of Long-term Care Market Competition on Nursing Home Quality……….………3
2.1 Introduction………...3
2.2 Background………...6
2.3 Data Sources………..9
2.4 Empirical Specification of Variables………...13
2.4.1 Quality Measures………..13
2.4.2 Case Mix Measures………...14
2.4.3 Definition of the Market………...15
2.4.4 Excess Demand ………15
2.5 Econometric Framework ……….16
2.5.1 Statistical Models………..17
2.6 Results………..18
2.6.1 Effects of Competition on Nursing Home Quality………...18
2.6.2 Effects of Competition on Nursing Home Private-Pay Price………...23
2.6.3 Effects of Competition on Nursing Home Case Mix………...25
2.7 Conclusion………...26
Chapter 3: State Regulation of Long-Term Care Providers and the Quality of Care in Nursing Homes………39
iv
3.2 Background...…...43
3.3 Data………...46
3.4 Econometric Framework ………...50
3.4.1 Market Definition ………...50
3.4.2 Explanatory Variables in the Models ……….……...51
3.4.3 Model Specification………...53
3.5 Results………...…..………...55
3.6 Conclusions………...62
Appendix A: Appendix to Chapter 2………...76
Appendix B: Full Regression for Chapter 2………...77
Appendix C: Full Regression for Chapter 3………...82
References……….………...89
Abstract……….………...93
v
LIST OF TABLES
Table 2.1 Variable Descriptions ………...30
Table 2.2 Type of Quality Indicators ………...33
Table 2.3 Descriptive Statistics of All Variables………...34
Table 2.4 Two-stage Least Square Model on Nine Quality Indicators………...36
Table 2.5 Linear Regression on Nursing Home Daily Average Price………...37
Table 2.6 Linear Regression on Nursing Home Case-mix Index………...38
Table 3.1 Variable Descriptions………...67
Table 3.2 Type of Quality Indicators ………...70
Table 3.3 Descriptive Statistics of All Variables………....71
Table 3.4 Two-stage Least Square Regression Model on Nursing Home Quality Indicators…………...73
Table 3.5 Second-stage Regression and Cross-product Coefficients………...74
Chapter 1
Introduction
This dissertation is a compilation of two essays addressing the effects of economic factors on the quality of care in U.S. nursing homes. Both papers make used of nationally representative data for 2010 on nursing homes in the U.S., state regulation of long-term care providers, particularly Medicaid policy towards nursing homes, the economic structure of local markets in which the facilities operate, including the extent of competition from other long-term care providers, such as assisted living facilities and home healthcare agencies, and county-level population demographic characteristics.
Over the last 20 years nursing homes in many markets across the U.S. have experienced increased competition from home health agencies and assisted living facilities, yet little is known about how these more recent sources of competition affect the quality of care they provide. The first essay examines how nine different measures of nursing home care quality respond to the greater levels of local market competition from these alternative providers of long-term care, as well as other nursing homes. The findings from this empirical analysis reveal that faced with greater competition from assisted living facilities, nursing homes are left to care for more disabled, less healthy patients. Although the nursing home’s staff-to-bed ratios rises in response, significant declines occur in other measures of care quality, such as more process- and outcome-based measures. Competition from home health agencies likewise has mixed effects on the nursing home’s care quality, and competition from other nursing homes in a market tends to decrease care quality. These finding suggest that care quality in nursing homes
may continue to erode as the market for alternative, community-based long-term care services expands.
The second essay examines the important effects of state Medicaid regulations on nursing home care quality. Unlike earlier studies on the effects of Medicaid, this analysis adopts a richer model specification for care quality that controls for the economic structure of the nursing home’s local market, as well as how the state regulates assisted living facilities, who compete with nursing homes for residents. Most previous studies of the effects of state Medicaid policies on care quality analyzed nursing homes in isolation, ignoring the presence of nearby competitor firms, and how state regulation of assisted living facilities might also affect care quality in nursing homes. The findings from the analysis reveal that a higher Medicaid reimbursement rate leads to significant improvements in nine distinct aspects of nursing home quality, while state certificate-of-need programs for nursing homes lead to significant declines in several (but not all) dimensions of care quality. A large presence of assisted living beds in a local market also tends to reduce nursing home quality, and state regulations regarding assisted living facilities indirectly affect nursing home care quality by altering the nature of local market competition. Overall, these results suggest that state laws related to all long-term care providers, not just nursing homes, are important determinants of nursing home care quality.
Chapter 2
Effects of Long-term Care Market Competition
on Nursing Home Quality
2.1 Introduction
Long-term care encompasses a broad range of services, including medical and non-medical care provided to people who need assistance performing activities of daily living. Current estimates suggest that at least 70 percent of individuals over age 65 will need long-term care services at some point in their lifetime (CMS 2014). In 2010, total spending for long-term care services was $207.9 billion, or 8 percent of all U.S. personal health care spending (O’Shaughnessy 2011), most of which is paid by state Medicaid programs.
Historically, nursing homes have been the major providers of long-term care to older adults. In recent decades, however, alternatives to nursing homes have emerged in many areas, such as assisted living facilities and home health care providers. Some states have even begun to cover care in these alternative settings under Medicaid, by established Medicaid 1915(C) waiver programs. With these changes in the structure of the market for long-term care, and changes in Medicaid policy in some states, the overall demand for nursing home care in the U.S. is also changing. More and more seniors are shifting away
from receiving care in a nursing home to receiving home and community-based assisted living care instead.
Assisted living facilities are community-based residential long term care centers that provide housing and supportive services for older adults. Since 1990 the total number of beds in assisted living facilities has grown rapidly. Nationwide the number of beds more than doubled between 1990 and 2002 (Harrington et al 2001), and since then they have continued to grow steadily. As of 2010 there were 51,367 licensed assisted living facilities in the U.S. with a total bed capacity of 1,233,690 beds. Much different from the earliest form, assisted living facilities are able to provide more professional medical care and more services to assist activities of daily living. They are closer substitutes for nursing home services than before.
Recent research suggests that many older adults have moved out from nursing homes into assisted living facilities in order to achieve greater independence and more dignity (Perkins et al 2012). There are now 1.8 million adults who live in this nation's 16,000 nursing homes (Kaye et al 2010), and more than 735,000 adults who live in assisted living facilities (NSAL 2012). With their rapid growth rate, assisted living facilities are expected to eventually surpass nursing homes to become the major providers of long-term care services in the U.S..
Home care providers, which supply long-term care services at a patient’s home, are also an important substitute for nursing home care. Studies have consistently found that most older adults strongly prefer staying in their own home to any other alternative (Gibson et al 2003).
Despite the growing importance of home and community based services in long-term care, few studies have looked at whether and how home care providers and assisted living facilities are affecting nursing homes. This is surprising because economics suggests that nursing homes likely compete not only with other nursing homes, they compete with other types of firms that provide alternatives to institutional care. This implies that when a nursing home chooses care quality for its residents, for example, the structure of the market in which it operates may be influencing its choices. With all the competitive forces now shaping the long-term care market, we should not be examining nursing homes in isolation from the rest of the market. If market competition is having effects on nursing homes, then ignoring these effects could lead to biased results and false conclusions.
This study examines how competition from nearby assisted living facilities and home care providers affects the quality of care provided by nursing homes. Unlike the few previous studies that addressed interactions between assisted living facilities and nursing homes using state-specific data sets, this study analyzes data from a large, nationwide sample of nursing homes. It is the first paper to study the effects of competition from assisted living facilities and home health providers on the quality of care within nursing homes. It also examines the effects of state-level regulations and policies on nursing homes and assisted living facilities.
The paper is organized as follows. Section 1 provides background information on the long-term care market and briefly reviews the literature on nursing home quality. Section 2 describes the data used for the analysis and the specification of variables, while Section 3 describes the statistical methods used. The results are reported in Section 4.
Section 5 summarizes the key findings and their policy implications, and describes possible future work.
2.2 Background
With the growing population of older adults and forthcoming wave of baby boomers, long-term care has been a heated topic among health economists. Being the major provider of long-term care, nursing homes have typically been the center of discussion. Early studies, including Chiswick(1975), Scanlon(1980), and Mukamel et al(2002), focused on the demand for nursing home services and the price elasticities for care, trying to figure out what factors influence the demand function, in order to have a clearer view of how this market operates. Since 2000 researchers have began to focus more on nursing home quality, investigating how state regulations and facility characteristics influence nursing home quality. Although it is difficult to measure quality directly, a whole host of quality measures have been proposed. Zimmerman et al. (1995) suggested quality measures in twelve different domains, discussed their nature and characteristics, and examined their validation using a pilot test. On the other side of the equation, factors from all sorts of aspects are being used to check their effects on nursing home quality.
Facility characteristics, including for-profit status, have been evaluated by Grabowski et al (2003). Their study found that a higher non-profit market share could induce a spillover to the for-profit side of the nursing home market and thereby increase overall quality in a market. This finding is consistent with a review done by Hillmer et al (2005) that found that studies conducted between 1990 and 2002 on the relationship
between nursing home for-profit status and quality of care collectively suggest that non-profit nursing homes provide better quality, measured in many important areas, and the quality difference between for-profit and non-profit nursing homes are systematic. Harrington et al. (2001) also concluded that investor-owned nursing homes have worse residents’ health outcomes than do non-profit homes.
Another line of literature focused on the effects of Medicaid reimbursement rates on nursing home care quality. Cohen and Spector(1996) studied the effects of both the reimbursement method and the Medicaid payment rate in their analysis. They found that both affect nursing home staffing intensity. With the direct link of staffing intensity to nursing home residents’ health outcomes, a higher level of reimbursement rate could increase the staffing level that induces a possible quality increase.
David Grabowski has conducted several studies on the effects of Medicaid payment rates. In a 2001 study he found the reimbursement rate had a small positive effect on nursing home quality, as measured by the proportion of residents with facility-acquired pressure sores as well as the number of registered nurses. In another study based on longitudinal data, Grabowski (2004) found uniformly positive effects on several nursing home quality indicators with an increase in the Medicaid reimbursement rate. This improvement in the strength of the latter analysis is not only attributed to a better model setting, but also to the incorporation of the market competition and changes over time. In fact, competition in the nursing home sector can be a really important factor that influences the interaction between nursing home characteristics and quality outcomes. Zinn(1994) uses market share concentration in terms of Herfindahl index to indicate
competition and finds there are significantly lower prevalence of catheter, restraint use, and not toileted in markets with higher concentration.
Since 1990 there have been significant changes in the long-term care market with the emergence of substitutes for nursing home care. More research is needed examining the effects of the new market structures. The effect of competition on nursing home quality is not as straight forward as the effect of competition on price to see through based on economic theories. Morrisey (2001) pointed out two possible circumstances in which competition might drive quality into completely different directions. On one hand, if quality is related to more services being provided, a lower price caused by competition might tend to bring down quality. On the other hand, if competition leads to greater efficiency and cost savings, quality might rise. These two opposite possibilities call for more evidence based on empirical work.
To date, only a few studies have considered the effects of assisted living facilities on nursing home care quality. Competition from home care agencies has only been addressed crudely with home health staff per capita and percentage of women aged15-64 not in the workforce as proxies. (Zinn 1994). Grunier et al (2007) is one of the few who pay attention to assisted living facilities. By mainly looking at the dementia special care units in nursing homes, they find that competition from assisted living facilities only affected the profile of residents in special care units but not nursing home investment or other aspects. Bowblis (2012) checked the effect from both nursing home market structure and expansion of assisted living on nursing home quality using data in Ohio state. His regression results show that assisted living facilities do have significant, mainly negative, effects on nursing home quality. Although this study is only based on data in
one state, these effects give a good sketch of the long-term care market interaction in Ohio state and suggest a more integrated regulation method for assisted living facilities and it also provides strong empirical evidences and supports to include competition from other sectors in nursing home quality analysis in the future research.
The present study is the first to consider how the quality of nursing home care responds empirically to local market competition from assisted living facilities, home care agencies, as well as other nursing homes. Using nationally representative data from a large sample of nursing homes observed in 2010, two questions are examined. First, is the quality of care provided by a nursing home influenced by local market competition from these three types of firms, and if so, how? Second, is the competition from assisted living facility and home care agency taking the form of a battle over price or services?
2.3 Data Sources
Nursing home-level, county-level, and state-level data from several sources were assembled to conduct the analysis. The data sources include the 2010 Certification And Survey Provider Enhanced Reports (CASPER), the 2010 Nursing Home Compare (NHC) data, the Provider of Services File (POS), the Area Resource File (ARF), the MetLife Market Survey of Nursing Homes data, the Assisted Living, Adult Day Services, and Home Care Costs (MetLife Market Survey) data, the State Data Book on Long Term Care (State Data Book), the Assisted Living State Regulatory Review (AL Regulatory Review), and assisted living facility supply data collected by Stevenson and Grawboski (2010).
The facility level nursing home data are from the CASPER and NHC data sets. The CASPER data set replaced the Online Survey, Certification, and Reporting (OSCAR) System, and is maintained by the Center for Medicare and Medicaid Services (CMS). This data set provides comprehensive information for every Medicare or Medicaid certified nursing home facility with its operational characteristics and aggregate resident information. The CASPER data was merged at the facility-level with the Nursing Home Compare data, which provides information on the quality of care at the nursing home, as reported by the Center for Medicare and Medicaid Services (CMS).
Because our interest centers on the effects of competition between nursing homes, home care agencies, and assisted living facilities, nursing homes that were certified as a skilled nursing facility (SNF) only were dropped from the sample of facilities to be analyzed. The care provided by SNFs is much more intense nursing care, and it is not a substitute for the intermediate-level care provided by home care agencies and assisted living facilities. Dropping the SNF-only facilities leads the total number of observations to decrease by 9.44%, from 14827 to 13426. Without any further sampling, this data set is a near-complete census of all the non-SNF certified nursing homes in the U.S. in 2010.
Several variables such as the staffing level per bed, the total number of health deficiencies, the percentage of empty beds in the county, a Herfindahl index, and case-mix measurement were all calculated for each facility using the data sets listed above. The staffing level was calculated as full-time-equivalent staff per bed, defined as the sum of full-time staff, part-time staff (upon conversion into full-time-equivalent persons), and contract staff (upon conversion into full-time-equivalent persons). The percentage of empty beds was derived from the difference between the total number of resident and
total number of certified nursing home beds for each facility as a percentage of the total number of beds, and then averaged at the county level where the nursing home was located. The Herfindahl index was calculated at the county-level and is based on each facility’s share of beds, defined as the number of beds in that nursing home divided by the total number of beds in that facility’s county.
Data from the Provider of Service file, which provides information on all certified health care institutional providers across the U.S., and the assisted living facility supply data collected by Stevenson and Grabowski were merged with the nursing home facility file based on each nursing home’s zip code. The assisted living data collected by Stevenson and Grabowski describes assisted living facilities across the entire U.S., as of 2007. Before merging their data with the 2010 nursing home file, their variables were each adjusted to reflect 2010 levels, based on the aggregate growth rate in assisted living facilities, as reported by the AARP report on Assisted Living and Residential Care in the States in 2010. Data from the ARF were likewise merged to the nursing home file based on the county. Variables from the ARF include county-specific demographic characteristics, such as per capita income, race, gender, poverty rate, mortality rate, and region identifier.
The MetLife Market Survey was collected by the MetLife Mature Market Institute. It contains daily private-pay price levels for nursing homes, monthly rates for assisted living facilities, hourly rates for home health care agencies, and daily prices for adult day services. The private rates are mainly at the state-level with some metropolitan areas reported as well. Using state-level price information instead of recording it at facility level could help avoid the endogeneity problem between price and quality, thus
the state average private price levels were merged with the other previous mentioned data sets to provide private-pay rates for each long-term care facility.
Data on state regulations covering long-term care facilities were also added to the nursing home file. Most of the variables describing nursing home and assisted living facility regulation take the form of (0,1) indicators. These variables were derived from information reported in the State Data Book on Long Term Care (2007) Program and Market Characteristics (funded by the U.S. Department of Housing and Urban Development) and the Assisted Living State Regulatory Review (2007) (prepared by the National Center for Assisted Living).
According to the State Date Book on Long Term Care, there are four types of rate-setting systems for nursing homes, including prospectively set, flat rate, case-mix based, and combination-type systems. The strictest is a flat rate system because it sets a uniform level of reimbursement for the same class of homes, regardless of their variation in costs. In contrast, a case-mix based system adjusts a nursing home’s rate based on its residents’ case-mix which reflects differences in need. Under a prospective rate system a nursing home’s reimbursement rate is set in advance, based on the previous costs level of each facility, but it doesn’t account for the actual costs. A combination system has both prospective and retrospective elements to how rates are set, so that interim rates eventually align closer to actual costs. Since only one state has a flat rate system and one state has a case-mix based system, this analysis could control for only the prospective and combination systems in the regression models estimated.
State rate-setting systems for assisted living facilities can be categorized into five approaches: flat rate, tiered rate, case-mix based rate, fee-for-service (FFS) rate, and
negotiated rate systems. A flat rate system for assisted living facilities, just like a flat rate system for nursing homes, does not allow any adjustments for conditional differences across assisted living facilities. Rather, each facility receives the same flat rate. A case-mix based system has the same basic logic as a case-case-mix reimbursement system for nursing homes. A tiered rate system is quite similar to a case-mix based system, except it typically has fewer rate categories than a case-mix based system. Under a fee-for-service rate setting scheme, instead of receiving a monthly payment, the assisted living facility has to send bill to the payment agency based on the services delivered to the resident. Finally, a negotiated rate system is a method that combines some or all of the other four systems. Table 2.1 describes all of the variables used in the analysis and their sources.
2.4 Empirical Specification of Variables
2.4.1 Quality Measures
Quality is a multidimensional concept. Measures of it fall into three categories: structural measures, process-of-care measures, and outcome measures. Structural measures are organizational characteristics of nursing homes, and include staffing levels as well as the scope of the nursing home’s health-related deficiencies, such as the number of federal minimum quality standards the facility fails to fulfill. Process measures include the prevalence of indwelling catheters in the nursing home, the prevalence of tube feeding, the prevalence of physical restraints, and the facility’s drug error rate. In general, process measures depend on and reflect the interactions that are occurring between the nursing home staff and its patients. Outcome measures, such as the prevalence of pressure sores in the nursing home, are widely regarded as the most straight forward
measures of care quality. Outcome measures represent changes in resident characteristics that are directly attributable to the practice and environment of the nursing home.
In this paper measures from all three categories are used. Table 2.2 lists the nine variables in the analysis that measure quality and their type. Although registered nurses (RN) per bed, licensed practical nurses (LPN) per bed, and nurse aids per bed are all measures of staffing levels, they should not be regarded as perfect substitutes. RNs usually have more medical skills and can provide more intensive and skilled services to a resident. LPNs focus more on daily medical routines that help preserve a resident’s well being. The all-day-round care provided by nurse aids can possibly affect a resident’s satisfaction and his/her mood. To acknowledge these differences in roles, all three are used as quality indicators in the analysis. Measurements of catheter and pressure sores are adjusted for pre-existing conditions where the prevalence is recorded as percentage of residents who did not have but acquired catheter or pressure sore during the stay in nursing home facilities.
2.4.2 Case Mix Measures
The analysis controls for the case mix of residents in order to ensure that the quality indicators for each nursing home facility are not biased by case-mix differences. A case-mix index was created to measure the level of sickness among residents in each facility, and it was included in all nursing home quality regressions. The nursing home case-mix index was built based on the "Management Minutes System" designed by Bill Thoms (1975). It is expressed in minutes of staff time where different prevalence of disability is given a different weight based on the level of sickness. The indicators of disabilities are mutually exclusive and expressed in term of percentage of residents. In
order to avoid multicollinearity in the statistical analysis, any quality indicator that is embodied in the case-mix system was abandoned as dependant variables. The formula for case-mix index calculation is shown in Appendix A.
2.4.3 Definition of the Market
Before local market competition can be measured, the relevant market needs to be defined. The market should be a place where competition actually happens. In most previous studies of nursing homes the county has been used to represent the local market. Although not ideal, it has proven to be reasonable. For example, by looking at resident characteristics in different regions, Nyman (1994), Gertler (1989), and Banaszak-Holl et al (1996) all found that more than 75% of nursing home residents were from the same county where the home they were in was located. Therefore, following Zinn(1994), Cohen and Spector (1996), and Grabowski (2001), this study used the county to approximate the relevant geographic market.
2.4.4 Excess Demand
States control the supply of nursing home beds through their certificate-of-need and moratorium regulations. Limits on nursing home bed supply can lead to unfulfilled demand in some markets, a phenomenon economists call "excess demand". When excess demand exists, a facility may be able to strategically select residents based on its own preferences. Because potential patients differ in terms of their payment rates and sometimes health conditions, more profitable private-pay patients are usually admitted first. When this happens individuals on Medicaid typically wait in line until an empty bed becomes available. In effect, they lose the right to choose a nursing home based on its quality, which in turn may reduce the willingness of local nursing homes to provide
better quality and to compete with each other based on quality. Different studies have reached different conclusions about the effects of excess demand on the quality of nursing home care, and about how Medicaid reimbursement affects quality in the presence of excess demand (Grabowski 2001, Gertler 1992, Nyman 1989). In this analysis, excess demand was measured as the county-wide average percentage of empty nursing home beds.
2.5 Econometric Framework
Using the 2010 data on nursing homes and their markets described above, we examined the effects of market competition on nursing home quality by estimating a series of linear regression models for the quality measures. In each model estimated, we allowed for the possibility that nursing home beds and the structure of the market might be endogenous to the facility. Specifically, Hausman tests were first conducted to check the endogeneity of nursing home beds, per capita home care agencies, and per capita assisted living beds. The results from these tests ruled out the endogeneity of nursing home beds and home care agencies per capita, but they failed to reject the endogeneity of assisted living beds per capita. To address this issue, two-stage least squares regression model were adopted, explicitely treating assisted living beds per capita as endogenous.
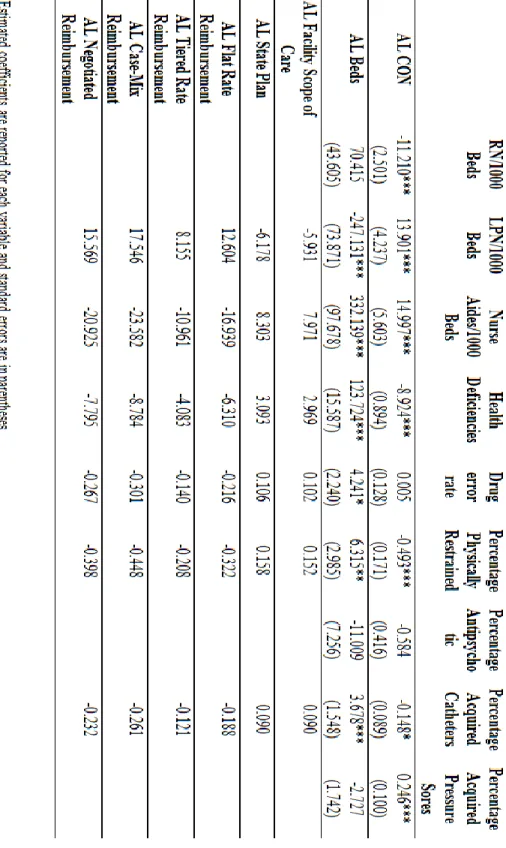
The instrument variables should be correlated with assisted living facility bed number but not correlated with nursing home quality indicators. State regulatory factors that affect the assisted living industry, such as regulation of facility scope of care, reimbursement methods, and whether the state had a Medicaid waiver covering assisted living care, are good candidates for instrument variables. However, some other policy
variables such as assisted living private-pay price level and assisted living certificate-of-need regulation might be correlated with the nursing home quality indicators as well as the variables measuring assisted living facilities. Thus, these variables were left out of the first-stage regression and were used as independent variables in the second stage regression only.
2.5.1 Statistical Models
The basic linear regression model is built as equation (1), where Qim is the dependant variable for nursing home quality of nursing home i in market m. Series of facility characteristics for nursing home i in market m is are included in Xim. Sm, which is the key set of variables in this paper, is composed of market competition from nursing homes, assisted living facilities, and home care agencies in market m. Zm represents county level demographic characteristics. RmNH are variables for nursing home state regulations.
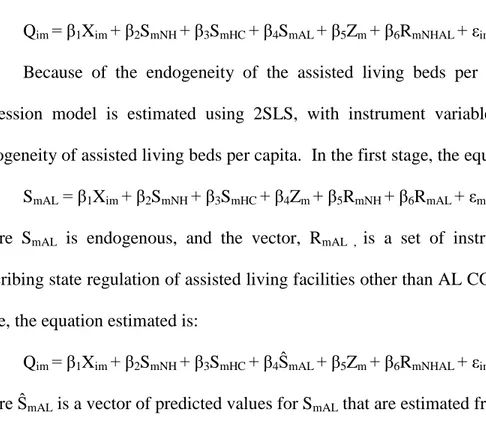
Qim=β1Xim+β2SmNH+ β3SmHC+ β4SmAL+β5Zm+β6RmNH+εim (1) Because of the endogeneity of the assisted living beds per capita, the actual regression model is regressed in two stages with instrument variables dealing with the endogenous variable. Thus, for the first stage, we have:
SmAL = β1Xim+ β2SmNH+ β3SmHC+ β4Zm+ β5RmNH+β6RmAL+εm (2) where SmAL is endogenous, and RmAL is a vector of state regulation instruments to identify the model. Upon estimating equation (2), the following second stage equation was estimated for each quality measure:
Qim=β1Xim+β2SmNH+ β3SmHC+ β4ŜmAL+β5Zm+β6RmNH+εim (3) where ŜmAL was the estimated value from equation (2).
In order to further examine the possible effects of market competition on variables other than quality, two more linear regressions were also estimated. Equation (4) below describes the price per day received by the nursing home, and equation (5) below describes the case-mix of its residents:
PmNH=β1Xim+β2SmNH+ β3SmHC+ β4SmAL+β5Zm+β6RmNH+εim (4) CMimNH=β1Xim+β2SmNH+ β3SmHC+ β4SmAL+β5Zm+β6RmNH+εim (5) where PmNH measures the nursing home’s daily private-pay price level for market m, and CMimNH is the case-mix index for nursing home i in market m. In estimating equations (4) and (5) we allowed for possible heteroscedasticity in the standard errors.
2.6 Results
Table 2.3 reports the mean and standard deviations for all variables used in the analysis.
2.6.1 Effects of Competition on Nursing Home Quality
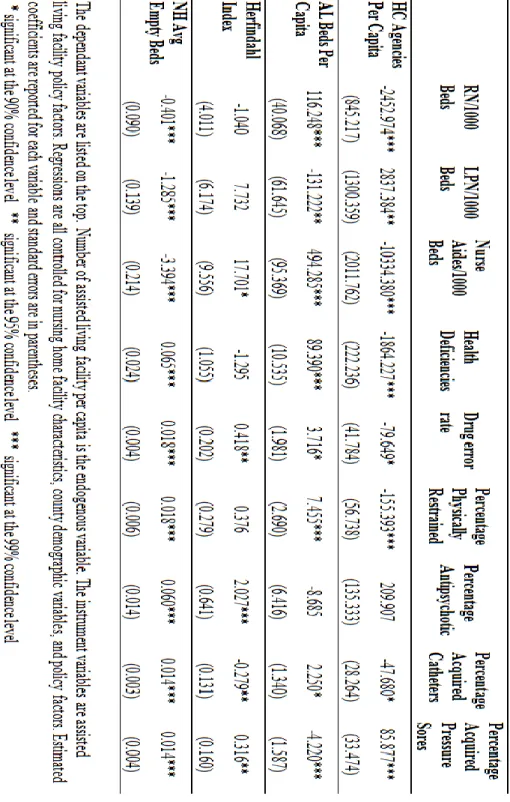
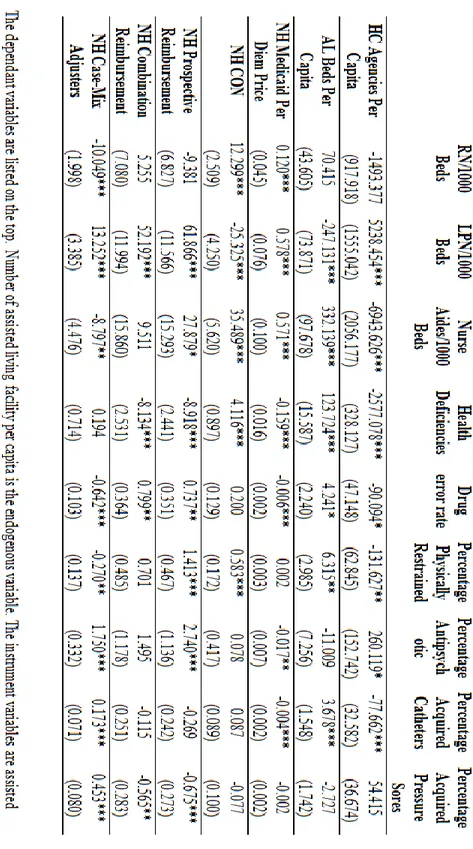
Table 2.4 summarizes the key results from the two-stage least squares regressions for the nine quality indicators. It reports on the coefficients in these models for variables that measure local market competition from nursing homes, home care agencies, and assisted living facilities. Although not reported in the table, each of the models estimated also controlled for all the variables shown in the data summary, and the full regressions are available from the author upon request. Each column of the table describes a different quality measure.
The first three quality indicators measure staffing per bed, and were computed as the number of nursing home professionals per 1000 nursing home beds. The measures
were rescaled for the purpose of reporting coefficients. Staffing levels are believed to be positively correlated with nursing home quality, i.e., the higher the staffing level per bed, the better the nursing home’s quality. The remaining six quality indicators measure deficiencies in health care services, care procedures, and health outcomes, and they are believed to be negatively related to the quality level of a nursing home. For example, the higher the percentage of residents who have facility-acquired pressure sores, the lower the nursing home’s quality. Thus, a positive relationship of an independent variable with a positive quality indicator suggests an increase in that variable increases quality, whereas a positive relationship with a negative quality indicator suggests an increase in that independent variable decreases quality.
Each quality model included four measures of local market competition. Competition from assisted living facilities was measured by the number of assisted living facility beds per capita in the county. Competition from home care agencies was measured by the number of home care agencies per capita in the county. Competition from other nursing homes in the area was measured by the Herfindahl index (HHI) of nursing home bed share in each county. The index used in the regression is adjusted by 1 minus the actual index in order to better ally with the magnitude of competition. After the alternation, a higher adjusted HHI value indicates more intense competition among nursing homes. Finally, the county-wide average percent of empty nursing home beds is a proxy for the presence of excess bed demand in the market.
The results in Table 2.4 strongly suggest that nursing home quality was affected by local competition from home health agencies, assisted living facilities, as well as other nursing homes. The coefficients of home care agencies per capita are statistically
significant for eight of the quality indicators. Competition from home health agencies, however, had mixed effects on quality, tending to reduce nursing staffing levels, while it had mostly positive effects on other structure, process and outcome quality measurements. Judging from the regression results, competition from home care agencies was mainly focused in the labor market where both home care agencies and nursing homes are trying to get more professional nursing staff. The marginal effect of one unit increase in the home care agency per capita would lead to a decrease of 2.45 RN per bed in nursing homes and a 10.33 decrease of nurse aides per nursing home bed. However, the competition from home care agencies doesn’t bring down nursing home quality measured by number of health deficiencies, percentage physically restrained resident, percentage with facility acquired catheters and drug error rate.
In contrast, Table 2.4 also reveals that competition from assisted living facility mainly improves staffing levels in nursing homes, but reduces quality indicated by process measurements. This is likely the result of differences in residents’ characteristics between these two types of long-term care providers. Residents in assisted living facilities tend to be "low-care" patients (Mor et al.2007) who generally have less severe medical needs than residents in nursing homes. Morand colleagues found that about 5 to 12 percent of nursing home residents fall into the category, "low-care". The proportion of these residents is higher in states with lower investment in assisted living facilities. This suggests that where there is a greater presence of assisted living facilities there will be fewer "low-care" patients in nursing homes, leaving nursing homes with residents who have higher levels of disabilities. In this case, nursing homes will need higher levels of
nursing staff, and the health conditions will be lower for the nursing home residents as well.
The latter part of this explanation is supported by the regression results for the process and outcome quality indicators. The number of health deficiencies, the percentage of residents physically restrained, the percentage with catheters, and the drug error rate are all higher in markets with a high number of assisted living beds per capita. These results suggest that when assisted living beds per capita increases by 1, this increases the number of health deficiencies in the nursing home by 89.39, the drug error rate by 3.72, the percentage of residents who are physically restrained by 7.46, and the percentage with catheters by 2.25. However, the health outcome measured by percentage of residents with facility acquired pressure sore improves in the presence of greater competition from assisted living facilities, e.g., a 1 unit increase in assisted living beds per capita decreases the percentage of residents with pressure sores by 4.22.
This finding of negative competition effects on health deficiencies is consistent with recent findings from Bowblis (2012), who studied markets for long-term care in Ohio. He found that a one-unit increase in assisted living beds per 100 population could increase regulatory deficiencies by 4.60. Coefficients on factors, such as percentage physically restrained and percentage with facility acquired catheters that are not significant in his analysis using Ohio state data are significant using the national sample in this study.
The coefficients on the HHI measure the effects of competition from other nearby nursing homes. Competition from other nursing homes appears to have positive effect on staffing levels, while the effects on resident health outcome are mixed. The results
suggest that greater competition from nearby nursing homes decreases the percentage of resident with facility-acquired catheters, but at the same time, it increases the percentage of patients taking antipsychotic medication or who have pressure sores.
Bowblis (2012) used nursing home facility per capita as a proxy for nursing homes’ within sector competition. Despite the difference in competition proxy, the findings about the effects on nursing home resident outcomes are consistent. The drug error rate will also increase with nursing home competition, which the study done by Bowblis failed to measure.
Zinn (1994) also includes a HHI to indicate market concentration in his analysis of nursing home quality. He finds a higher concentration of nursing homes will decrease prevalence of physically restrained, catheterized, and not toileted residents in nursing homes. Although percentage not toileted is not included in this study and percentage physically restrained is not significant in the result, the conclusion with catheterized residents in this study is completely opposite from the one by Zinn. This discrepancy might be caused by difference in measuring prevalence of catheter as facility acquired or as overall level. It also might be affected by the market changes through time. Zinn’s study was based on data from 1987 when home and community based services have not thrived, while this study used 2010 data that fully encompasses the effects from assisted living and home care sectors. The study done by Grabowski in 2004 using data from 1991 to 1998 also has some consistent as well as opposite conclusion with our results. These differences in the conclusions further support the argument that more recent and more comprehensive analyses are needed following the huge change in the long-term care market.
The county average percentage of empty beds serves as a statistically significant and negative explanatory variable for all nine nursing home quality measurements. Although it might seem intuitive to think that with higher level of empty beds, nursing homes using the same amount of staffing and resource can concentrate on smaller number of resident, thus the quality should increase. However, this hypothesis is not supported by the empirical results. Actually, based on the excess demand theory, when the bed constraint is in effect, nursing homes have the power to choose residents. In this case, the homes will most likely choose private payers over Medicaid residents because of the higher price. When there is lower demand than supply, nursing homes lose the power to discriminate on the payer type. Therefore, there will be higher proportion of Medicaid residents in the facilities. Furthermore, as is proven by pervious literature and the regression on case-mix in Table 2.6, the disability level for Medicaid residents are significantly higher. Research done by Nyman (1988) also shows that the low-quality-high-Medicaid relationship not only exists, but is much stronger with excess demand. Under the influences of both worse health conditions and lower payment rate, higher percentage of Medicaid payers will more likely bring down the overall nursing home quality measurements.
2.6.2 Effects of Competition on Nursing Home Private-Pay Price
Table 2.5 shows how the nursing home private daily average price is influenced by market competition. As shown in Table 2.5, competition from home care agencies decreases the nursing home private daily price significantly. This result indicates that the competition effect from home care agencies to nursing homes is mainly presented in the form of price. A study done by Li and Jensen (2011), which analyzes the long-term care
usage pattern of long-term care insurance (LTCI) policy holders, shows that LTCI holders who have moderate disabilities would prefer to stay at home than entering a nursing facility to receive care. This result illustrates that competition from home care agencies reduces the demand of nursing home residents who have LTCI. With the price difference of a private insurer and a Medicaid patient, this competition reduces the price level for nursing homes.
On the other hand, competition from assisted living facilities and other nursing homes both affect nursing home private price positively. However, the magnitudes of these effects on price are very small. For example, a 1 unit increase in the per capita assisted living bed increases the nursing home price by 5.9, and a 1 point change in the nursing home HHI increases the price by 0.93. A positive price effect of competition from assisted living facility might stem from a higher disability rate in nursing homes when there is higher penetration of assisted living facilities. It might also be a result of reverse causality where assisted living facilities grow faster in areas where the price level of nursing home services is higher. The positive competition effect on price from other nursing homes seems counter-intuitive. However, with some limitations in the data sets, nursing homes which are from the same multi-site firm cannot be distinguished from others. Although these nursing homes might be considered as independent small firms that help intensify competition, they are actually operating under the same regime which could reduce competition and increase price.
The association between the average percentage of empty beds in the county and the private-pay price is consistent with economic theory. When demand is lower, price will be lower too. Although only the private-pay price of nursing home service is shown
in Table 2.5, the competition effects on Medicaid reimbursement rate are similar as the private price because of a high correlation (0.6011) between the two price levels.
2.6.3 Effects of Competition on Nursing Home Case Mix
Table 2.6 reports how nursing home case-mix index is affected by market competition. The more home care agencies per capita in a county, the lower the case-mix index of nursing home residents in that county. In other words, competition from home care agencies help reduce the case-mix of nursing home residents, leaving nursing homes with a healthier group that further lower the burden of providing more services. This may be caused by the proportion of post hospital care patients who use home care agency mostly for recovery. These patients whose case-mix indexes are much higher are generally in need of more nursing care. However, strictly speaking, they should not be counted as long-term care patients because they typically need just a relatively short period time of health services. Drawing this part of resident out of nursing homes might be the reason why number of home care agencies is negatively associated with residents’ case-mix in nursing homes.
Assisted living facilities, on the other hand, provide services to individuals who are in less need of care. Competition from assisted living facilities will attract residents with better health conditions moving out of nursing homes, thus increases nursing home case-mix index. Furthermore, as the study done by Spillman et al (2002), the annual use of assisted living residents are much longer than before that about 45 percent of resident stayed throughout the year in 1998. This usage pattern implies that the "low-care" users stay longer in the assisted living facilities than before. This longer stay will delay the timing of entering nursing homes. In that case, when they are actually moved out of
assisted livings into nursing homes, their health conditions would be much worse than before. With the effects from both resident characteristics and usage patterns, competition from assisted living facility increases case-mix index of residents in nursing homes. This assumption is supported by the empirical results here.
Competition from other nursing home shown by the HHI index is positively associated with nursing home case-mix. In other words, case-mix in nursing homes increases with higher level of competition among nursing homes. For a nursing home that operates as a monopoly in a market, it has the full power to choose residents and to set price discrimination. Under this circumstance, healthier and better-paying patients tend to be admitted, and the ones with worse health conditions are left out. When competition becomes more and more severe, however, nursing homes compete for residents by broadening their scopes in admitting patients. In this way, patients with more complications and who need more resources are more likely to be admitted, thus the case-mix in nursing homes is higher with more market competition.
2.7 Conclusion
With the rapid growth in home care agencies and assisted living facilities across the U.S., nursing homes face new sources of competition for provision of long-term care services. This paper is the first to study how local competition from home care agencies and assisted living facilities affects care quality in nursing homes, the private-pay prices they charge, and the case-mix complexity of their residents. From this nationwide analysis of nursing home care quality in 2010, five broad findings emerge.
First, nursing home quality is affected by local competition from assisted living facilities, home care agencies, and other nursing homes. Overall, these effects are mostly statistically significant and intuitive. At the same time, different types of competitors have different effects on nursing homes.
Second, increased competition from home care agencies has mixed effects on nursing home quality. Its effects on staff-to-bed ratios were mostly negative, whereas its effects on other structure, process, and outcome quality measures were mostly positive. We also found evidence that increased competition from home care agencies affects the private-pay prices that nursing homes charge. As the supply of local home care providers increases, the private-pay price in nursing homes declines. One interpretation is that nursing homes are competing with home care providers on the basis of price.
Third, increased competition from assisted living facilities also has mixed effects. Despite some positive effects on staff-to-bed ratios, competition from assisted living facility overall tends to lower nursing home quality. This is because having more assisted living beds in an area significantly raises the case-mix complexity in the nursing home. Since "low-care" residents prefer assisted living facilities, the nursing home’s case-mix shifts to a more-disabled, sicker mix of residents. We also presented evidence that the private-pay price in the nursing home also rose in order to cover the higher cost of caring for this more disabled patient mix. But given a more severe case-mix, care quality tends to suffer.
Fourth, increased competition from other nursing homes had positive effects on staff-to-bed ratios, while the effects on resident health outcomes were mixed. Competition from other nursing homes decreased the percentage of residents with a
facility-acquired catheter, but increased the percentage of patients taking antipsychotics, the percentage with pressure sores, and the drug error rate in the facility.
Fifth, excess demand for nursing home beds in an area has significant negative effects on all measures of nursing home quality. A high empty bed rate may be caused by lower overall demand, and it might also be the result of competition from home and community based services. Under both causes, nursing homes have less power to choose their residents. More Medicaid patients and more "high-care" patients may be admitted, causing the decrease in nursing home quality.
Overall, the findings in this paper are broadly consistent with previous research on the effects of competition in the market for nursing home care. We found that competition from assisted living facilities has mixed effects on care quality in nursing homes. Although staff-to-bed ratios rise, other measures of care quality tend to fall, in part because of the worsening case-mix of the nursing home’s residents. The effects of competition from home care agencies reported here are presented for the first time, and so cannot be compared to prior studies. Yet, our findings for this source of competition seem reasonable. The effects of competition from other nursing homes reported here are differ in some ways from what previous researchers have found. This may be due to differences in the time frame across different studies. With the exception of Bowblis (2012), most previous work on this issue was based on much older data, when nursing homes were the dominant suppliers in markets for long-term care.
In summary, long-term care provided by nursing homes appears to be evolving in response to growing market competition from assisted living facilities and home care agencies. Faced with greater competition from assisted living facilities, nursing homes
are left to care for the more disabled and less healthy patients. Although a facility’s staffing levels rise in response, other measures of care quality decline, such as more process- and outcome-based measures. There are strong indications that the transformation of nursing homes and the market for long-term care will continue.
Tables for Chapter 2:
Table 2.1 Variable Descriptions
Variable Definition Source
Quality Measures
RN/Beds Total number of registered nurses per beds in each nursing facility
CASPER
LPN/Beds Total number of licensed practical nurses per beds in each nursing facility
CASPER
Nurse Aides/Beds Total number of Nurse Aides per beds in each nursing facility
CASPER
Health Deficiencies Number of regulatory health deficiencies in each nursing facility
NHC
Drug Error Rate Percentage of drug error in each facility CASPER
Percentage Physically Restrained
Percentage of resident in each facility who are physically restrained
CASPER
Percentage Antipsychotic
Percentage of resident in each facility who use antipsychotic medication
CASPER
Percentage Acquired Catheters
Percentage of resident in each facility who acquired catheter during the stay
CASPER
Percentage Acquired Pressure Sores
Percentage of resident in each facility who are acquired pressure sore during the stay
CASPER
Nursing Home Facility Characteristics
NH Beds Per Capita Nursing home total beds per capita for each facility CASPER NH Ownership Dummy variable if Government owned=1; 0=otherwise CASPER
For/Non- Profit Dummy variable For-profit=1; Non-profit=0 CASPER
Provider Based Facility Dummy variable =1 if provider based; 0=otherwise CASPER Percentage Medicaid
Residents
Percentage of Medicaid residents in each facility CASPER
Special Care Beds Percentage of nursing home beds for Alzheimer patients CASPER
Case-Mix Index Case mix measurement for each facility CASPER
NH Avg Empty Beds Average percentage of nursing home empty beds in county CASPER HC Agency Per Capita Number of home care agencies per capita in county POS
AL Beds Per Capita Number of assisted living beds per capita in county Stevensen 2010 NH Herfindahl Index Nursing home Herfindahl Index in each county CASPER
County Demographic Characteristics
Census Region Code 1=Northeast 2=Midwest 3=South 4=West ARF
County Per Capita Income
Per capita income in each county ARF
Population 65+ Percentage of population age 65 and over in county ARF
Adult Female Percentage of population adult female in county ARF
Medicaid Eligible Percentage of Medicaid eligible older adults in 65 and over age group in each county
ARF
Mortality Rate County mortality rate ARF
Poverty Rate County poverty rate ARF
Percentage White Percentage white population in county ARF
Percentage Black Percentage black population in county ARF
Population Density Population density per square mile in county ARF
Low Education Type Dummy variable for low educational region ARF
State Policy Factors
NH daily Avg Price Nursing home private-pay daily average price MetLife Market Survey
NH Price Ratio Nursing home Medicaid reimbursement rate over nursing home private pay price
MetLife Market Survey
AL Daily Avg Price Assisted living facility private-pay daily average price MetLife Market Survey
HC hourly Avg Price Home health care agency private-pay hourly average price MetLife Market Survey
Adult Day Care Daily Avg Price
Adult day care facility private-pay daily average price MetLife Market Survey
NH CON Dummy variable for state nursing home Certificates of Need regulation
NH Prospective Reimbursement
Dummy variable for prospective reimbursement system State Data Book
NH Combination Reimbursement
Dummy variable for combination reimbursement system State Data Book
NH Case-Mix Adjusters Dummy variable of whether the reimbursement rate is adjusted for case-mix
State Data Book
AL CON Dummy variable for state assisted living Certificates of Need regulation
AL Regulatory Review AL Facility Scope of
Care
Dummy variable of whether the assisted living facility could provide nursing services
AL Regulatory Review AL Medicaid Waiver Dummy variable of whether the state Medicaid waiver could
cover assisted living costs
AL Regulatory Review AL State Plan Dummy variable of whether there is a state plan to cover
assisted living costs
AL Regulatory Review AL Flat Rate
Reimbursement
Dummy variable for flat rate reimbursement system AL Regulatory Review AL Tiered Rate
Reimbursement
Dummy variable for tiered rate reimbursement system AL Regulatory Review AL Case-Mix
Reimbursement
Dummy variable for case-mix reimbursement system AL Regulatory Review AL FFS Reimbursement Dummy variable for fee-for-service reimbursement system AL Regulatory
Review AL Negotiated
Reimbursement
Dummy variable for negotiated reimbursement system AL Regulatory Review
Table 2.2 Type of Quality Indicators
Quality Indicator Type of Indicator
RN/Bed Structure
LPN/Bed Structure
Nurse Aids/Bed Structure
Health Deficiency Structure
Drug Error Rate Process
Percentage Physically Restrained Process
Percentage Antipsychotic Process
Percentage Acquire Catheters Process Percentage Acquire Pressure Sores Outcome
Table 2.3 Descriptive Statistics of All Variables Total observation number: 13426
Variables Mean Std. Dev.
RN/Beds 0.07169 0.08586
LPN/Beds 0.135396 0.126905
Nurse Aides/Beds 0.378815 0.185241
Health Deficiencies 14.98494 11.32956
Drug Error Rate 1.504207 4.067297
Percentage Physically Restrained 3.11389 5.58665
Percentage Antipsychotic 25.19481 14.81464
Percentage Acquire Catheters 1.623429 2.80799
Percentage Acquire Pressure Sores 2.941331 3.245092
NH Beds Per Capita 0.165465 0.148378
NH Ownership 0.761367 0.426264
For/Non- Profit 0.705123 0.456005
Provider Based Facility 0.048494 0.214816
Percentage Medicaid Residents 62.89192 19.74553
Special Care Beds 4.987203 13.21166
Case-Mix Index 141.9866 43.93583
NH Avg Empty Beds 17.34904 10.53505
HC Agency Per Capita 0.036434 0.057068
AL Beds Per Capita 0.311181 0.221559
Herfindahl Index (1-HHI) 0.7740254 0.2565023
Census Region Code 2.461169 0.946563
County Per Capita Income (in 1000s) 1.722276 0.721113
Population 65+ 14.08715 3.631144
Variables Mean Std. Dev. Medicaid eligible 15.28146 7.763679 Mortality Rate 0.904158 0.23473 Poverty Rate 15.58205 5.318782 Percentage White 77.39127 16.67342 Percentage Black 11.00004 12.85455
Population Density (in1000s) 1.244913 4.045115
Low Education Type 0.121789 0.327054
NH daily Avg Price 192.0493 58.36996
NH Price Ratio 132.4298 68.02018
AL Daily Avg Price 107.2017 19.53959
HC hourly Avg Price 20.66501 2.799751
Adult Day Care Daily Avg Price 60.38816 17.47155
NH CON 0.773915 0.41831
NH Prospective Reimbursement 0.849497 0.357577
NH Combination Reimbursement 0.136091 0.342898
NH Case-Mix Adjusters 0.677738 0.46736
AL CON 0.156333 0.363184
AL Facility Scope of Care 0.749871 0.434623
AL Medicaid Waiver 0.716859 0.450541
AL State Plan 0.244645 0.487086
AL Flat Rate Reimbursement 0.312043 0.463347
AL Tiered Rate Reimbursement 0.432814 0.495487
AL Case-Mix Reimbursement 0.14892 0.356025
AL FFS Reimbursement 0.070242 0.255565
Table 2.5 Linear Regression on Nursing Home Daily Average Price
Nursing Home Daily Average Price Coef. Std. Err.
HC Agency Per Capita -282.378*** (104.318)
AL Beds Per Capita 5.943*** (2.538)
NH Herfindahl Index 0.925*** (0.202)
NH Avg Empty Beds -0.986*** (0.038)
NH Beds Per Capita 296.548*** (46.124)
NH Ownership 5.610*** (1.711)
For/Non- Profit -2.613* (1.583)
Provider Based Facility 3.914* (2.217)
Medicaid Residents 0.163*** (0.017)
Special Care Beds -0.007 (0.021)
Case-Mix Index 0.064*** (0.019)
Census Region Code -13.840*** (0.570)
County Per Capita Income (in1000s) -2.847*** (0.645)
Population 65+ 2.553*** (0.190) Adult Female 2.056*** (0.181) Medicaid eligible -0.204*** (0.056) Mortality Rate -33.054*** (3.007) Poverty Rate 0.428*** (0.094) Percentage White -0.510*** (0.078) Percentage Black -0.746*** (0.076)
Population Density (in1000s) 0.803*** (0.081)
Low Education Type 4.510*** (1.071)
AL Daily Avg Price 1.576*** (0.027)
HC Hourly Avg Price -0.817*** (0.141)
Adult Day Care Daily Avg Price 0.185*** (0.023)
NH CON 23.485*** (1.126) AL CON -14.997*** (0.852) NH Prospective Reimbursement -47.474*** (1.438) NH Combination Reimbursement -50.976*** (1.497) NH Case-Mix Adjusters -7.254*** (0.735) _cons 64.876*** (10.876)
Estimated coefficients are reported for each variable and standard errors are in parentheses.
* significant at the 90% confidence level ** significant at the 95% confidence level *** significant at the 99% confidence level
Table 2.6 Linear Regression on Nursing Home Case-mix Index
NH Case-Mix Index Coef. Std. Err.
HC Agency Per Capita -67.600* (38.170)
AL Beds Per Capita 2.493* (1.510)
NH Herfindahl Index 0.525*** (0.135)
NH Avg Empty Beds -0.285*** (0.036)
NH Beds Per Capita -28.751 (41.364)
NH Ownership 2.775 (2.106)
For/Non- Profit -6.475*** (2.204)
Provider Based Facility -2.477 (2.157)
Medicaid Residents 0.091* (0.052)
Special Care Beds -0.001 (0.020)
Census Region Code 4.728*** (0.609)
County Per Capita Income (in1000s) -2.989*** (0.851)
Population 65+ -0.144 (0.238) Adult Female 0.261 (0.240) Medicaid eligible 0.254*** (0.076) Mortality Rate -7.410** (3.225) Poverty Rate -0.295* (0.169) Percentage White 0.308*** (0.047) Percentage Black 0.418*** (0.053)
Population Density (in1000s) -0.735*** (0.108)
Low Education Type 0.100 (1.384)
Nursing Home Daily Average Price 0.113*** (0.013)
AL Daily Avg Price -0.007 (0.025)
HC Hourly Avg Price -1.122*** (0.112)
Adult Day Care Daily Avg Price -0.086*** (0.020)
NH CON -4.726*** (0.869) AL CON 5.308*** (2.144) NH Prospective Reimbursement 4.834*** (1.561) NH Combination Reimbursement 5.948*** (2.248) NH Case-Mix Adjusters 3.541*** (1.067) _cons 110.307*** (10.620)
Estimated coefficients are reported for each variable and standard errors are in parentheses.
* significant at the 90% confidence level ** significant at the 95% confidence level *** significant at the 99% confidence level
Chapter 3
State Regulation of Long-Term Care Providers
and the Quality of Care in Nursing Homes
3.1 Introduction
The rising number of elderly, disabled, and chronically ill individuals in the US has brought increased attention to the utilization, cost, and quality of long-term care services. Long-term care encompasses a broad range of services, including both medical and non-medical care provided to individuals who need assistance performing activities of daily living. It has been estimated as many as 70 percent of older adults over age 65 will require long-term care services at some point during their remaining lives (CMS 2012). As the major payer for long-term care, state Medicaid programs face the daunting challenge of trying to balance the growing needs of an aging population with the unwillingness of many state legislators to expand their Medicaid budgets to pay for needed services. This situation has led to growing concerns about the quality of care provided to Medicaid residents in nursing homes, as well as a desire among many state legislators to cut back on Medicaid reimbursement rates, program eligibility, and the use of publically-financed long-term care, more generally. Consumers, the media, and the Institute of Medicine are particularly concerned with care quality in nursing homes.
Nursing homes are the major providers of long-term care in the US. They have also been the main focus of government regulation pertaining to long-term care services.