DEBT IS NOT
A DIRTY WORD
Role and use of debt in local government
Prepared by John Comrie
with support and project management assistance by
Institute of Public Works Engineering Australasia
ACKNOWLEDGEMENTS
Some of the content of this paper has been reproduced with the kind permission of the South Australian Local Government Association from its Financial Sustainability Information Paper 15, Treasury Management. ACELG would like to thank the following persons and organisations that have who provided research information and served as a reference group in the preparation of this paper. It is stressed that the views expressed in the paper are those of the author and not necessarily those of members of the reference group. The reference group included the following:
Giovina D'Alessandro, Department of Local Government, Northern Territory
Mark Glasson, Department of Local Government and Communities, Western Australia
Mark Grant, Local Government Victoria, Department of Planning and Community Development
Sue Grau, Local Government Association of Tasmania
Own Harvey-Beavis, Municipal Association of Victoria
Shaun McBride, Local Government New South Wales
Paul Schollum, Western Australian Local Government Association
Brian Sharp, Department of Local Government Community Recovery and Resilience, Queensland
Andrew Wardlaw, Burnie City Council, representing Local Government Managers Australia
John Wright, Local Government Association of South Australia
Local Government Association of Queensland.
ABOUT THE AUTHOR
This paper was prepared by John Comrie. John is a former council Chief Executive Officer and Executive Director of the Local Government Association of South Australia (LGASA) and the South Australian Government’s Office for State/Local Government Relations. He has written much of the guidance material produced by the LGASA to assist councils to improve their financial sustainability strategies and performance. He also wrote the Long-term Financial Planning Practice Note
published by the Australian Centre of Excellence for Local Government (ACELG) and the Institute of Public Works Engineering Australasia (IPWEA) and co-authored IPWEA’s Australian Infrastructure Financial Management Guidelines. Earlier this year he wrote ACELG’s ‘In Our Hands, Strengthening Local Government Revenue for the 21st Century’ Working Paper.
ABOUT ACELG
ACELG is a unique consortium of universities and professional bodies that have a strong commitment to the advancement of local government. The consortium is led by the University of Technology Sydney’s Centre for Local Government, and includes the University of Canberra, the Australia and New Zealand School of Government, Local Government Managers Australia and the Institute of Public Works Engineering Australia. In addition, the Centre works with program partners to provide support in specialist areas and extend the Centre’s national reach. These include Charles Darwin University and Edith Cowan University. www.acelg.org.au
ABOUT IPWEA
The Institute of Public Works Engineering Australasia (IPWEA) is the professional organisation providing services and advocacy for those involved in delivering public works and engineering services to the community, both in Australia and New Zealand. IPWEA provides global leadership in infrastructure asset management and financial planning through its publications, education and training initiatives. www.ipwea.org
ABOUT LGMA
Local Government Managers Australia (LGMA) is the leading professional association representing managers and aspiring managers in local government throughout Australia and the Asia-Pacific. Its purpose is to promote excellence through the advancement of local government management.www.lgma.org.au
Contents
Executive summary ... i 1 Introduction... 1 2 Financial fundamentals ... 2 2.1 Definitions ... 2 2.2 Concept ... 2 2.3 Aim ... 22.4 Consequences of achieving / not achieving aim ... 3
2.5 Summary ... 3
3 Review of local government debt and financial performance ... 5
4 Local government debt management theory ... 14
4.1 What is treasury management? ... 14
4.2 Debt management practices need to reflect operating circumstances ... 14
4.3 Margin between borrowing and lending interest rates ... 15
4.4 When to borrow and liquidity needs... 16
4.5 Interest rate risk exposure ... 16
4.6 Fixed versus variable interest rate borrowings ... 17
4.7 Lendings ... 18
5 Legislative frameworks ... 19
6 Local government debt management practices ... 21
6.1 Why don’t councils make greater use of debt?... 21
6.2 Borrowing for specific purposes ... 23
6.3 The use of credit foncier borrowings ... 23
6.4 The preference for borrowings at fixed rates of interest ... 24
6.5 Reserves and fund accounting... 26
6.6 The cost and availability of borrowings ... 27
6.7 Debt and asset renewal backlogs ... 29
6.8 Risks associated with increased and better use of borrowings ... 30
7 Conclusions... 31
8 Next steps ... 33
i
Executive summary
The local government sector in all Australian jurisdictions has extraordinarily low levels of debt relative to the security and the level of its income base and the nature of its service responsibilities. On average councils have more money in the bank than they have debt. It is important to note however that what is true on average is not necessarily so for all or even most councils. The levels of borrowings (debt) and lendings (cash and other financial assets) are for example likely to vary significantly between individual councils.
Local government service provision is asset-intensive and local government infrastructure assets have on average long (but not infinite) useful lives. In such circumstances and unless a large share of the cost of the initial provision of infrastructure assets was financed by others (for example through grants from other governments and developer contributions) it is impossible over time for a council to finance the acquisition of new assets, while at the same time financing warranted asset renewal, without significant reliance on debt unless service recipients are charged excessively relative to the cost of services they enjoy. Under-use of debt will therefore result in inter-generational inequity in service provision and charging decisions, and/or an inability to accommodate needs and preferences for new capital works and asset renewal.
Previous studies have found that local governments are debt averse. Many (but not all) councils are likely to better serve their communities by making greater use of debt. For example many councils perceive that they have large asset renewal backlogs. If this is true it must be because councils don’t think they can responsibly afford to address these problems. This may well be true in some instances but not generally. Many councils have considerable capacity to deal with urgent asset renewal needs if they were willing and permitted to make greater use of debt.
The way debt is structured when it is raised (typically at a fixed interest rate with specified
repayments required at regular intervals) often generates unnecessary cashflow pressures, greater vulnerability to interest rate changes, and higher net interest costs for councils. These sub-optimal financing and treasury management practices are not entirely the making of the local government sector. Current local government debt-related attitudes and practices are often encouraged in guidelines and requirements specified by jurisdictional authorities. In many cases these instructions reflect approaches that were commonly advocated in the cash accounting era. They are inconsistent with today’s local government operating environment with its emphasis in all jurisdictions on financially sustainable revenue-raising and service level decision-making guided by the use of long-term financial planning data based on accrual accounting techniques.
It is simply not possible for many councils to make significant improvement in their financial, asset management and service delivery performance without greater and better use of debt. If local governments are to make these improvements then changes in guidance and controls regarding borrowings will be required in most jurisdictions. Jurisdictional governments will also need to assist councils in explaining to their communities why, for a well-managed council, debt should not be viewed as a dirty word.
A relaxation on constraints on borrowing by councils could theoretically encourage excessive spending on projects and services that are unaffordable or sub-optimal. These risks will not
ii
materialise in practice if councils base revenue-raising and expenditure decisions on well-developed and financially sustainable strategic, asset management and long-term financial plans. In local government, debt levels should not be ‘as low as possible’ in an absolute sense but should instead be as low as possible relative to what is needed by a council in order to provide affordable, preferred service levels on an ongoing basis whilst maintaining inter-generationally-equitable rating and charging decisions.
Many people are likely to be uncomfortable with the idea of local governments taking on more debt and changing their traditional borrowing and treasury management practices despite the objective merits of doing so. For change to occur it will be necessary to tread carefully in order to build confidence and understanding. As a first step it is suggested that representatives of jurisdictional local government associations and local government regulatory agencies and national local government peak bodies meet to explore the merit of collaborative activity to consider reforms to promote better use of debt by local governments.
The conclusions and suggestions made in this paper are necessarily general. They are likely to be applicable to a greater or lesser extent to the circumstances of most councils, and particularly to those that generate most of their revenue from sources they control and from secure, ongoing sources of grants. Some of the findings and proposals may be less relevant, or irrelevant, to councils that are unable to markedly control their long-term financial destiny predominantly through their own efforts.
1
1
Introduction
Numerous reports over the past decade have highlighted the typical low levels of debt of local governments in all jurisdictions throughout the nation.1 These reports have often claimed that many
councils have the capacity to better serve their communities by making more extensive use of debt. Local governments are by far the most ‘asset intensive’ sphere of government in Australia.2 A high
proportion of the operating costs they incur are associated with initially providing and then
operating, maintaining and renewing long-lived infrastructure assets.3 The local government sector
widely believes, and various reports have suggested, that many councils are significantly under-spending on warranted asset renewal. Many councils also perceive that they have inadequate capacity to invest in additional infrastructure needed to expand and upgrade services and/or accommodate growth.
This paper will argue that two prime causes of many councils’ financial challenges are their aversion to greater use of debt and problematic debt repayment arrangements. In fairness, this aversion to debt and sub-optimal repayment arrangements are often encouraged by legislative frameworks and instructions developed at the jurisdictional level that direct and guide local government decisions and practices.
Much of the infrastructure from which local government services are provided is long-lived but it doesn’t last forever. A council’s optimal outlay levels to renew and replace assets and augment infrastructure stocks can vary considerably over time. This paper will show that it is likely to be impossible in these circumstances for councils to meet infrastructure outlay needs and treat different generations of ratepayers equitably (in terms of services provided relative to rates and charges levied) without extensive use of debt.
In the sections that follow the reasons for the often inadequate and inappropriate use of debt by councils are explored. Also discussed are strategies that could help councils make more effective use of debt to the advantage of ratepayers and service recipients on an ongoing basis.
1
See for example Ernst & Young’s findings (2012, p.31) and their reference to findings of other reports (p.28). See also Department of Regional Australia, Local Government, Arts and Sport (2010, p.17-18).
2
For example, research undertaken by the Local Government Association of South Australia suggests that SA councils have approximately three times as many assets relative to income as the SA Government, and that the SA Government has about three times as many assets relative to income as the Commonwealth. There is no reason to believe local governments elsewhere would be less asset-intensive.
3
Depreciation alone represented 20% of total local government GFS expenses in 2010/11. See Comrie Table 1.
“two prime causes of many councils’ financial challenges
are their aversion to greater use of debt and problematic
debt repayment arrangements”
2
2
Financial fundamentals
Analysis, commentary and arguments made in this paper are based on the application of accrual accounting concepts and generally accepted local government financial strategies. Some critical terms and concepts used in this paper are outlined below.
2.1
Definitions
i). This paper will refer to loans as ‘borrowings’ and monies held on deposit with financial institutions as ‘lendings’ in accordance with Government Finance Statistics (GFS) conventions.4
A borrowing provides a borrower with cash but it is important to recognise that this is not income. A borrowing creates an asset (cash) and a liability (an obligation for repayment). Interest incurred on outstanding borrowings is an expense but repayment of the borrowing itself (the ‘principal’) in full or in part is not. Principal repayments simply result in a reduction in assets (cash) and liabilities.
ii). The terms ‘financing’ and ‘funding’ are often used interchangeably but in this paper and commonly in public finance literature the two terms have different meanings. ‘Funding’ refers to the raising of revenue (for example in a local government context through rates, user
charges, grants, subsidies and contributions). ‘Financing’ describes how payment for an outlay is accommodated. This could for example be through an entity utilising its financial assets (e.g. cash held in a bank account) or by an arrangement to use another entity’s funds (e.g. by raising a borrowing). While ‘financing’ and ‘funding’ are different functions they are interrelated. For example, where total outlays in a particular year cannot be met from revenue in that year, some outlays may be financed by raising a borrowing but the servicing of the borrowing will need to be funded from revenue over a period of time. Thus, decisions regarding raising borrowings are not funding strategies – they are financing strategies.
2.2
Concept
i). A borrowing, whilst not income per se, does allow timing mismatches between income and expenditure outlays to be overcome. It allows income to be harmonised and balanced with expenditure over time. This is effectively what happens when a first home buyer takes out a mortgage to finance the purchase of a dwelling.
2.3
Aim
i). It is these days broadly accepted that councils should strive to achieve small accrual accounting operating surpluses on average over time.5 This is encouraged, for example, through guidelines
and regulatory frameworks in all Australian jurisdictions.
4
GFS is a reporting format used to enable standardised financial reporting by governments in Australia.
5 Throughout this paper the term ‘operating surplus’ is used to mean the difference between accrual accounting operating income and
expenses exclusive of capital revenue. Capital revenue is widely defined to include grants specifically for capital works and physical assets gifted to local governments and it is that definition that is applied in this paper. How big a surplus could be and still be considered small is debatable. It is widely accepted though in a local government context that an operating surplus of up to 10% of operating revenue would generally be reasonable. For example, Queensland Department of Local Government, Community Recovery and Resilience (p.16) recommends an operating surplus of between 0% and 10%.
3
2.4
Consequences of achieving / not achieving aim
i). If a local government is able to achieve a small operating surplus on average over time it will effectively generate funds which are approximately sufficient to offset consumption (i.e. depreciation) of existing assets. On average and over time it should therefore also have approximately sufficient capacity to accommodate asset renewal requirements without the need to raise additional borrowings. Unless it generated large ongoing operating surpluses over time, it would still need to raise additional borrowings as a consequence of the purchase of additional assets or the replacement of assets with ones that deliver a higher level of service. ii). If a local government was generating large ongoing operating surpluses this may call into
question the inter-generational equity of its taxing, pricing and service level decisions.6
Effectively, in such scenarios ratepayers and service recipients will during times of surplus have paid more than the costs associated with service provision.
iii). If a local government has on average, over time:
a) not achieved at least a small operating surplus and
b) not raised additional borrowings as a consequence of the need to finance the acquisition of additional/upgraded assets,
then it will not have the capacity on average over time to be able to fully finance asset renewal needs without raising additional borrowings.
iv). If a local government raises borrowings as a consequence of the need to finance the acquisition of assets, and thereafter on average over the life of the assets achieves a small operating surplus, it will generate sufficient financial assets to repay these borrowings over the useful life of the assets. However it will probably not (depending on the extent of the average operating surplus) be able to do this and also finance subsequent renewal of those assets without raising further borrowings.
v). If a local government raises borrowings as a consequence of the need to finance the acquisition of assets, and thereafter on average over the life of the assets achieves a small operating surplus, it will generate sufficient financial assets to repay these borrowings over the useful life of the assets but will probably not (depending on the extent of the average operating surplus) be able to repay these borrowings over a materially shorter period.
2.5
Summary
Any well-managed organisation;
i). that is dependent on a large investment in infrastructure assets to deliver its service objectives ii). that needs to be mindful of intergenerational equity in generating revenue to offset service
costs and
iii). that has to fund initial provision of a large share of its asset base from service recipients (as opposed to funding it from capital contributions from others),
6 Inter-generational inequity occurs when ratepayers and service recipients are over-charged relative to the cost of service provision during
one period of years and (potentially a substantially different aggregate mix of) ratepayers and users are under-charged relative to cost in other periods of years.
4
is probably justified in having a considerable level of borrowings. This is particularly so if the organisation needs to provide (and finance) additions and enhancements to its stock of
infrastructure assets over time. An infrastructure intensive organisation that prefers to keep debt levels very low is likely to under-invest in new additional infrastructure and/or asset renewal relative to what its operating income stream would allow.
“An infrastructure intensive organisation that prefers to
keep debt levels very low is likely to under-invest in new
additional infrastructure and/or asset renewal relative to
what its operating income stream would allow”
5
3
Review of local government debt and financial
performance
In 2007 all Australian jurisdictions committed to nationally consistent ‘frameworks on local government asset and financial management’, developed by the then Local Government and Planning Ministers’ Council. In 2009, the ministerial council agreed to enhance the frameworks with the support of Commonwealth funding. 7 These decisions were prompted by the Australian Local
Government Association’s National Financial Sustainability Inquiry (conducted by
PricewaterhouseCoopers), and by similar preceding inquiries undertaken in most jurisdictions and other related reports.8 The national frameworks and Commonwealth funding through its Local
Government Reform Fund, together with the findings of the various jurisdictional financial inquiries have in all jurisdictions been catalysts for legislative reforms and support programs aimed at enhancing local government asset management and financial planning and decision-making processes and outcomes.
Many councils are now achieving, or at least progressing towards, achievement of satisfactory operating results. This is highlighted in Graph 1 below. This graph shows nationally and by jurisdiction over time the local government sector’s GFS revenue less expenses, all expressed as percentages of revenue.
7
See Local Government and Planning Ministers’ Council.
8
6
Figure 1: Local government sector GFS revenue less expenses all as percentage of revenue
Source: ABS 5512 General Government Local Key observation:
In all jurisdictions:
- There has been an upward trend in GFS revenue relative to GFS expenses over time.
- GFS revenue now exceeds GFS expenses.
It is important to note that revenue in Graph 1 includes capital revenue. If this amount could be excluded the above would closely reflect the collective operating result of the local government sector expressed as a percentage of total operating revenue. Capital revenue may represent in the order of 20% of total revenue, although this amount will vary over time and between jurisdictions. Nevertheless even discounting for this variation it is reasonable to assume that in many jurisdictions many councils are achieving operating surpluses, or at least do not have significant operating deficits.9
It also needs to be emphasised that the results portrayed in Figure 1 and other graphs in this section represent average performances across the local government sector (by jurisdiction or Australia-wide). Some (and perhaps many) councils will undoubtedly have better results than the average and others will have worse-than-average results. These variations will counter-balance each other.10
Figure 2 below shows the local government sector’s gross interest expenses as a percentage of total GFS expenses nationally and by jurisdiction over time.
9
ABS 5512 does not separately identify the capital revenue component of total GFS revenue. Capital revenue is included in, and likely to be the majority of, the amount shown as ‘Other’ in that publication.
10 Information on the financial performance of individual councils is not publicly available except in each council’s annual reports. It is the
author’s view from his general knowledge of the financial performance of local governments in all jurisdictions that the observations made regarding the sector’s performance are generally applicable to many (but not all) councils.
-40% -30% -20% -10% 0% 10% 20% 30% 40% 2002-03 2003-04 2004-05 2005-06 2006-07 2007-08 2008-09 2009-10 2010-11 2011-12
GFS Net Operating Balance / Total GFS Revenue
7
Figure 2: Local government sector interest expense as percentage of total GFS expenses
Source: ABS 5512 General Government Local Key observation:
Interest expenses represent only a very small share of total expenses of the local government sectors in all jurisdictions (on average 2.1% in 2011/12).
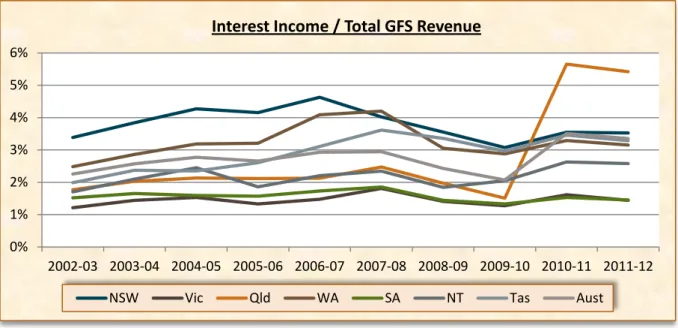
Any discussion of debt levels in local government needs also to have regard to the extent of local governments’ financial assets (cash at bank, monies invested for short and longer periods etc.). As will be discussed in more detail elsewhere in the paper, local governments often have substantial financial assets. Figure 3 below shows interest income as a percentage of revenue nationally and by jurisdiction over time.
Figure 3: Local government sector interest income as percentage of revenue
Source: ABS 5512 General Government Local 0.0% 0.5% 1.0% 1.5% 2.0% 2.5% 3.0% 3.5% 4.0% 4.5% 2002-03 2003-04 2004-05 2005-06 2006-07 2007-08 2008-09 2009-10 2010-11 2011-12
Interest Expenses / Total GFS Expenses
NSW Vic Qld WA SA NT Tas Aust
0% 1% 2% 3% 4% 5% 6% 2002-03 2003-04 2004-05 2005-06 2006-07 2007-08 2008-09 2009-10 2010-11 2011-12
Interest Income / Total GFS Revenue
8
Key observation:
The level of income from interest relative to total GFS revenue:
- has remained relatively stable in most jurisdictions over time.
- varies significantly between jurisdictions. In part this is likely to reflect a legislated requirement in some jurisdictions to retain monies received for some specific future purposes until expended and differences in local government responsibilities (in particular for water supply) between jurisdictions.
Figure 4 below shows the differences between interest expense and interest income (i.e. net interest expense) as a percentage of revenue nationally and by jurisdiction over time.
Figure 4: Local government sector net interest expense as percentage of revenue
Source: ABS 5512 General Government Local Key observation:
Nationally, and in most jurisdictions throughout the past decade, councils on average have been generating more interest income than they have been incurring interest expenses.
The magnitude of interest expenses incurred is a function of both interest rates charged on debt and the amount of outstanding debt (borrowings). Figure 5 below shows local government sector
outstanding borrowings at year end as a percentage of revenue nationally and by jurisdiction over time. -4% -3% -2% -1% 0% 1% 2% 3% 2002-03 2003-04 2004-05 2005-06 2006-07 2007-08 2008-09 2009-10 2010-11 2011-12
Net Interest Expense / Total GFS Revenue
9
Figure 5: Local government sector borrowings as percentage of revenue
Source: ABS 5512 General Government Local Key observations:
Borrowings by local governments as a percentage of GFS revenue are very low on average in all jurisdictions. The national average as at 30 June 2012 was 27%. To put this in context it can be thought of as somewhat similar to a household with a $60,000 annual income having a mortgage of $16,200 and no other debt.11
On average Queensland and New South Wales councils have higher levels of borrowings than elsewhere. This is probably primarily a reflection of the fact that the local government sectors in these jurisdictions have more extensive water supply responsibilities than elsewhere.
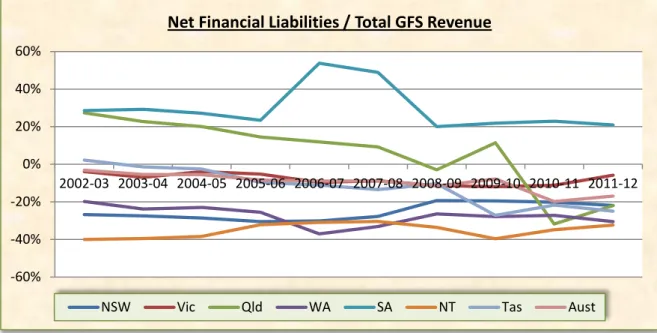
Borrowings are only one particular type of liability, and it is unwise to focus just on this one type. Local governments have other liabilities too (for example accounts payable and provisions for employee entitlements). As indicated above they also often have substantial financial assets that should be included when assessing net indebtedness. A metric commonly applied in the public sector that takes account of all the above factors is net financial liabilities. Net financial liabilities are total liabilities less financial assets. The Australian Infrastructure Financial Management Guidelines (Institute of Public Works Engineering Australasia (IPWEA) 2008) and Long-term Financial Planning Practice Note 6 (Australian Centre of Excellence for Local Government (ACELG) & IPWEA 2012) recommend that local governments set targets for net financial liabilities as a percentage of operating income (known as the net financial liabilities ratio) and publish projected and actual financial performance for this ratio in their budgets, long-term financial plans and annual reports. Most Australian jurisdictions now require or encourage their local governments to so report. Figure 6 below shows the local government sector’snet financial liabilities as a percentage of GFS revenue nationally and by jurisdiction over time.
11
To take the analogy a step further, local governments on average had as at 30 June 2012 assets equivalent to 10 times their annual income. The local government ‘household’ could therefore for comparative purposes be thought of as owning a house worth $600,000. There are some differences of course. Most local government assets can’t be sold but local governments’ incomes are much more secure than those of householders, and financial institutions consider secure income to be more attractive collateral than a mortgage over a property.
0% 10% 20% 30% 40% 50% 60% 2002-03 2003-04 2004-05 2005-06 2006-07 2007-08 2008-09 2009-10 2010-11 2011-12
Borrowing / Total GFS Revenue
10
Figure 6: Local government sector net financial liabilities ratio
Source: ABS 5512 General Government Local12
Key observations:
The level of net financial liabilities of local governments is, on average in most jurisdictions, negative. That is, they have more financial assets than total liabilities.
The net financial liabilities ratio of local governments has, on average in most jurisdictions, remained relatively stable over time.
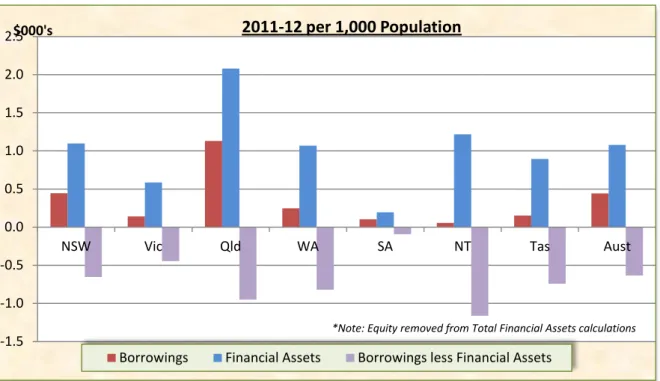
Figure 4 indicates that councils collectively are generating more interest income than they are incurring interest expenses. Given that interest rates on borrowings must on average be higher than interest rates on lendings, it follows that councils collectively must have significantly more lendings than they do borrowings. Figure 7 below shows the stock of borrowings and financial assets and the net difference between these two amounts for the local government sector in each jurisdiction as at 30 June 2012 expressed per thousand of population.
12
Data used to compile Graph 6 has been sourced from ABS balance sheet (i.e. Table 3) data for each jurisdiction. GFS financial assets include equity investments by entities. These amounts have been removed from the calculation of net financial liabilities in Graph 6. -60% -40% -20% 0% 20% 40% 60% 2002-03 2003-04 2004-05 2005-06 2006-07 2007-08 2008-09 2009-10 2010-11 2011-12
Net Financial Liabilities / Total GFS Revenue
NSW Vic Qld WA SA NT Tas Aust
11
Figure 7: Local government sector stock of borrowings, financial assets and net borrowings per ‘000 population
Source: ABS 5512 General Government Local and ABS 206084 (Sep 2012)13
Key observations:
In all jurisdictions borrowings are less than financial assets.
The stock of borrowings and financial assets and the net difference between these two amounts expressed relative to population varies significantly between jurisdictions.
It is intriguing that councils on average have more lendings than borrowings particularly given that many councils perceive they are unable to adequately finance warranted asset renewal works and interest rates on lendings are less than on borrowings.
Part of the answer could be that the performance of the sector on average can mask the
circumstances of individual councils. It is no doubt true that there are some councils with modest levels of lendings and significant borrowings, and other councils have significant holdings of financial assets and very low levels of borrowing. However the author believes that there are likely to be more councils that have significant levels of borrowings that also have similar or greater levels of lendings.14 This could be because of one or more of the following:
Councils have traditionally had a poor understanding of sound treasury management practices.15
Councils prefer to borrow for specific projects and at the same time build financial asset holdings for specific future purposes.
Councils perceive it to be prudent and responsible to build holdings of financial assets.
13
Data used to compile Graph 7 has been sourced from ABS balance sheet data for each jurisdiction (i.e. Table 3). GFS financial assets include equity investments by entities. These amounts have been removed from the calculation of financial assets in Graph 7.
14 The author, through his regular conduct on behalf of IPWEA of long-term financial planning training courses for local governments and
other work, has had the opportunity to study the balance sheets of a reasonable sample of local governments in all jurisdictions.
15
See Section 4 for a definition and discussion of treasury management. -1.5 -1.0 -0.5 0.0 0.5 1.0 1.5 2.0 2.5
NSW Vic Qld WA SA NT Tas Aust
$000's
2011-12 per 1,000 Population
Borrowings Financial Assets Borrowings less Financial Assets
12
Interest earnings are an important ongoing income source for some councils. They are often reluctant to forfeit these earnings by spending their holdings of financial assets.
The practices described above are encouraged by guidelines or required by instructions issued by advisory and regulatory bodies.
At the end of each year councils have on average substantial carry-over works for which monies have been generated but not yet expended.
The above issues are explored more fully in subsequent sections of this paper.
There has been considerable focus over the past decade on local governments’ asset management responsibilities. In many jurisdictions councils are now encouraged to monitor annual spending on asset renewal relative to annual rates of asset consumption. Figure 8 below shows the annual level of spending on physical asset acquisition relative to depreciation for the local government sector in each jurisdiction over time.
Figure 8: Local government sector purchases of physical assets as percentage of depreciation
Source: ABS 5512 General Government Local Key observations:
In almost all jurisdictions the level of annual spending on physical asset acquisition has consistently and significantly exceeded the rate of consumption of existing assets; that is the real value of the base of physical assets is growing over time.
In most jurisdictions there has been an increase over time in the level of spending on physical asset acquisition relative to the rate of consumption of existing assets.
It needs to be noted that data upon which Graph 8 is based includes outlays for asset renewal, for new assets and for the upgrading of existing assets to higher levels of service. Figure 8 would be more meaningful if it was able to compare outlays on renewal of assets only with annual depreciation levels. Australian Bureau of Statistics (ABS) data does not break down spending on physical asset acquisition. Consequently it does not show spending on additional assets (including upgrading of existing assets) to provide higher service levels compared with spending on
0% 50% 100% 150% 200% 250% 2002-03 2003-04 2004-05 2005-06 2006-07 2007-08 2008-09 2009-10 2010-11 2011-12
Purchases of New Non-financial Assets / Depreciation
13
replacement or renewal of existing assets to maintain similar service levels. It is likely that a large share of capital spending on infrastructure is associated with new additional or upgraded assets (possibly 50% or more). Nevertheless if a council is acquiring new additional or upgraded assets rather than renewing older assets it presumably believes that such decisions best enhance the overall welfare of their communities (subject to the comment immediately below). In some cases investment in additional assets rather than in renewal of existing assets may be beyond a council’s power to control. For example:
Demands associated with development growth may have necessitated outlays on new infrastructure.
Some new additional or upgraded asset acquisitions would have been funded by councils from capital revenues that would have been provided to councils specifically for these purposes. From the results of a range of metrics the graphs presented above clearly illustrate that in all jurisdictions local governments on average (i.e. at least at a sector-wide level) have:
Surprisingly low levels of debt relative to their levels of income and considering the nature of their service responsibilities.
The costs associated with holding debt are clearly not on average a significant factor in any financial pressures councils may be facing.
It is particularly striking that on average local governments have more money invested in lendings than they have debt. It is likely therefore that for many individual councils, lendings exceed borrowings. It seems odd that this should be the case for a sphere of government that is very dependent on physical (i.e. non-financial) assets for service delivery and which often claims not to have the capacity to address identified asset renewal needs.
14
4
Local government debt management theory
This section provides a general overview of the principles relevant to management of debt in the context of the general operating environment of Australian local governments. Some of the concepts and situations described here have been simplified for purposes of brevity and to best meet the needs of a general audience. Operating circumstances vary between councils and legislation varies between jurisdictions. Councils should not rely on the proposals suggested in this section without consideration of their specific circumstances.
4.1
What is treasury management?
This paper frequently uses the term ‘treasury management’. Treasury management refers to the ways in which borrowings are raised and cash and investments are managed. Treasury management practices can have a
significant effect on an entity’s net interest costs and interest rate risk exposure.
A council’s treasury
management strategy should aim to keep debt levels as low at any point in time as its annual budget and long-term financial plan and associated cash flow projections allow. 16
4.2
Debt management practices need to reflect operating circumstances
As highlighted in Section 2, raising debt does not generate income. Additional debt does not allow a council to acquire things it could not otherwise afford. Debt is a financing option, not a funding one. It simply enables the borrower to accommodate timing mismatches between spending and income. If an entity’s long-run income projections are less than its projected outlays, then raising more debt won’t solve the problem. The additional interest expenses incurred will only make matters worse.17
The above is true for all entities whether they be individuals, businesses or governments. The appropriate extent of use of debt, and how debt should best be structured, will vary between entities depending on their operating environments and capacity to manage risk.
It might be appropriate for some first home buyers to borrow at fixed interest rates as they may have little capacity to accommodate a potential increase in interest rates. It might make sense for retirees living on modest incomes, or farmers whose future incomes are uncertain, to strive to minimise debt levels. It might be justifiable for a business to ensure it always has enough cash (current financial assets) to meet liabilities that will fall due in the near future (current liabilities). If it doesn’t have money available and can’t subsequently generate borrowings to meet liabilities when they fall due then its ongoing survival may be threatened.
16
A model treasury management policy developed by the South Australian Local Government Association for consideration for adoption by SA councils is included as an appendix to LGA Financial Sustainability Information Paper 15 (Treasury Management).
17
Unless of course the raising of the borrowing enabled the financing of a strategy (e.g. purchase of an asset) that will lead to higher levels of future income or lower levels of future expenses.
“A council’s treasury management strategy should aim to
keep debt levels as low at any point in time as its annual
budget and long-term financial plan and associated cash
flow projections allow”
15
In several important respects, local governments differ from the individuals/entities in the examples above. In most cases local governments have a high degree of certainty regarding their future income projections (far more so than other spheres of government in Australia) and they have taxing powers that (generally) give them the capacity to raise more money if they need to.18 These factors
tend to suggest that the extent of use of debt and the way borrowings are best structured by councils may not necessarily be the same as what is appropriate for many other classes of entity. There is no specific amount of debt that is right for a council. Whether it has too much debt, or whether it can afford more, depends on:
its community’s needs for services
the council’s existing and projected future level of operating costs relative to revenue and
the council’s willingness and capacity to raise additional revenue if required.
A soundly based long-term financial plan can help a council to make decisions about affordable and appropriate levels of debt. A council with high debt levels may be more financially sustainable than one with low levels of debt. The reality is that some well-managed councils will need more debt than others at particular times. To pay for its infrastructure requirements a council with a peak in
development activity and expenditure needs associated with rapid growth is likely to need to borrow more than a mature council with little growth, just as a first home buyer is likely to need to borrow more than someone who purchased their home many years ago.
Generally, a council with an operating deficit has a correspondingly reduced capacity to raise additional debt (since interest costs will add to its operating deficit and therefore further jeopardise financial sustainability). However, additional debt may be justifiable where the council is committed to reducing other expenses or is willing and able to progressively increase its revenues over time.
4.3
Margin between borrowing and lending interest rates
At any given time interest rates charged on borrowings must necessarily be higher than the rates that can be earned on a lending with similar terms and levels of risk. If the average difference was, say 1.5% per annum, then a council which was planning to borrow, but had cash and investments of at least equivalent value, would be better off (by 1.5% per annum of the outstanding balance of the borrowing) if it utilised its own financial assets to avoid or defer such a borrowing.
In theory a council that had no debt and no outstanding immediate asset renewal needs could still justifiably have large holdings of financial assets. In practice though, this scenario is likely to be the exception for most councils in most periods.19
18 This is of course less so in the case of councils where ‘own source’ revenue represents only a small share of ongoing operating revenue.
Also, NSW councils need to obtain approval from the NSW Independent Pricing and Regulatory Tribunal to increase rates beyond the annual rate pegging specified increase.
19
A council could for example be holding financial assets because it is legally required to do so. Councils in some jurisdictions are required to hold developer contributions in the form of financial assets until the funds are outlaid on infrastructure consistent with the purpose the monies were received. A council may also have material carry-over commitments from one period to the next, but if this occurred on an ongoing basis it is likely to imply that its budget planning/project management processes warrant reviewing. Also a council could be consistently generating more revenue than it is incurring expenses for each year and may therefore be accumulating
“A soundly based
long-term financial plan can
help a council to make
decisions about
affordable and
appropriate levels of
debt”
16
4.4
When to borrow and liquidity needs
The uncertainty associated with revenue projections in the business world means that lenders, shareholders and boards of management place considerable emphasis on the financial liquidity (available cash) of private firms. A commonly utilised financial indicator in the private sector is the ‘current ratio’ (the ratio of current assets to current liabilities). Such concepts and ratios are generally likely to be of little if any relevance in local government contexts given that most councils have highly reliable income streams. This is particularly so when:
legislation does not constrain the raising of additional borrowings or decisions by councils to raise higher levels of annual revenue and
councils have ready access to a wide range of borrowing providers and/or competitively priced borrowing products.
If a council can raise more revenue and increase borrowings when and if it needs to, then its liquidity needs are likely to be very different to those of an entity that does not have such certainty. In these circumstances it would make little sense for a council to maintain high levels of liquidity if available funds could instead be used to cost-effectively reduce liabilities (even temporarily). A council faced with this scenario would be better off if it had negligible cash and investments at most times and raised additional funds, through borrowings, only when required to do so due to cash flow needs. It could readily achieve this by having in place arrangements that would enable it to draw down available approved borrowings at short notice and repay all or part of the outstanding balance as soon as circumstances permitted.
A rational person would pay off credit card debt in full if possible (and thereby avoid interest charges) rather than only make the required minimum monthly payment and keep money in the bank (either for a rainy day or for a specific future purpose). Councils should operate in the same manner. There is no point in councils borrowing money in situations where they already have sufficient cash and liquid investments available to meet immediately foreseeable needs.
In general, it is nearly always more cost effective for a council to meet expenditure needs by first using any surplus cash and investments currently available (even if these are surplus only for a short term) before undertaking a new borrowing. This is the case even if using existing funds only defers the need to borrow for a short period of time. Councils should only borrow when they have insufficient cash and liquid investments to carry out approved activities and services and pay for them at the required time.
4.5
Interest rate risk exposure
Future interest rate movements up or down (particularly over the medium and longer-term) are always uncertain and a council’s exposure to interest rate risks cannot be eliminated. However, interest rate risk can be, and should be, managed.
A council is exposed to interest rate risk whenever it borrows, or lends money, regardless of whether the interest rates are fixed or variable.
additional financial asset holdings. If this were so, however, it would invite questions regarding charging levels relative to service levels. Finally a council may have charging levels in balance with service-level long-run costs but be experiencing a trough in annual asset renewal needs. This is possible but in most instances is unlikely to endure over a long period. In fact, most councils claim that they have asset renewal backlogs.
17
Locking into a long-term fixed interest rate borrowing, for example, effectively means that a council is taking a gamble that variable interest rates over the period of the borrowing will be higher than the fixed rate negotiated. If a council takes out a fixed interest rate loan and interest rates on average fall over the duration of the loan, then the council will be worse off than it would have been in if it had taken out a variable interest rate loan. Such a council might not have been intending to gamble on interest rate movements, or it may not realise that it is doing so, but choosing a fixed interest rate borrowing does not obviate risk. It removes only one risk – the risk from higher average variable interest rates for the term of the loan.
It is common for councils to raise long-term borrowings with fixed interest rates. It is also common for lendings to be taken out over shorter terms, irrespective of whether the interest rates are variable or fixed. In these circumstances a council would be adversely affected if interest rates fell. It would not benefit from a fall in the cost of its borrowings and it would suffer from a fall in the interest earned on its lendings. Of course interest rates could rise, and if so the council would realise a gain, but in either case it would be exposed to more interest rate risk than if it had no lendings and a correspondingly smaller level of borrowings. Exposure to interest rate risk can therefore be reduced by using available monies to repay
borrowings where this is possible.
Even when lendings are used to reduce outstanding borrowings, interest rate risk can be further reduced by having a mix of both fixed and variable interest rate borrowings. In this way a council can reduce its risk exposure to interest rate movements up or down. However, having a higher
percentage of variable rate borrowings has the potential to be more cost-effective, and many councils may consider it worthwhile to take this additional risk (see 4.6 below). In setting its mix of fixed and variable interest rate borrowings a council therefore needs to weigh up factors such as cost effectiveness, risk management criteria and flexibility.
4.6
Fixed versus variable interest rate borrowings
Interest rates may be fixed for the full term of a borrowing or they may be reviewed in the light of market conditions at set points during this term. Interest rates on variable rate borrowings can vary continually. On average over time, fixed interest rate borrowings are usually slightly more expensive than variable rate ones because of the certainty they offer the borrower. Fixed interest rates effectively reflect the market’s expectations of likely variable interest rates over the borrowing period plus a margin for the interest rate risk uncertainty borne by the lender.
Fixed interest rate borrowings do not normally allow early repayment of the outstanding principal without invoking penalties. For example, if market interest rates have fallen since the borrowing was raised then the lender will wish to be compensated for the margin above current market rates that it would have otherwise earned during the remaining period of the borrowing on the outstanding balance. If interest rates have risen since the borrowing was raised then there is unlikely to be any benefit in early repayment.
Variable interest rate borrowings often allow early repayment of the outstanding balance (in full or in part) and the subsequent redrawing of any amount repaid in excess of the permissible maximum allowable outstanding balance. Given that there is usually a significant margin between borrowing
“interest rate risk can be,
and should be, managed”
18
and lending rates, it follows that councils can realise savings by structuring their portfolios of
borrowings so that cash inflows that are surplus to short-term needs can be used in the first instance to reduce the level of outstanding borrowings that would otherwise be necessary. This means repaying borrowings wherever, and as soon as, surplus (even short-term) cash flows allow. This is more readily and effectively achievable with variable interest rate borrowings.
Many long-term borrowing products provide for interest rates to be regularly reset (for example every 3 to 6 months) and they also allow (but do not require) a proportion of the outstanding principal to be repaid at these times. Such products would appear to be particularly suitable for councils wishing to gain an exposure to variable interest rate borrowings.
Councils can generate savings by using monies that would otherwise have been invested to instead reduce outstanding borrowings. The amount of these savings is likely to be far more than enough to offset the interest rate risks associated with having a large proportion of a council’s debt portfolios at variable interest rates (including by long-term borrowings where the interest rate is reset at short intervals).
4.7
Lendings
Interest rates offered on medium/longer term investments are often slightly higher than for short-term investments, but the difference is not usually significant compared with the difference
between borrowing rates and investment rates. For this reason it is important that a council ensures that funds are not locked up in long-term lendings when they could potentially be used to cost-effectively defer the need to raise a new borrowing, or to reduce the level of a council’s existing borrowings.
“In setting its mix of fixed and variable interest rate
borrowings a council therefore needs to weigh up factors
such as cost effectiveness, risk management criteria and
flexibility”
19
5
Legislative frameworks
The obligations and processes councils must follow when proposing to raise a borrowing vary between jurisdictions. The reports by both the Productivity Commission and Ernst & Young include information highlighting the differing conditions associated with borrowing by local governments in different jurisdictions.
In jurisdictions other than South Australia, Victoria and Western Australia, councils require (or can be required to seek) the approval of the responsible minister in order to borrow monies.20
Many years ago, there were restrictions imposed by the Australian Loan Council on the amount, term, type and source of public sector borrowings. These constraints no longer exist. The Australian Loan Council still exists and, in practice, consists of Commonwealth, state and territory treasurers. It is understood that data on the estimated net borrowing requirement of local government sectors each year is assembled by state and territory treasuries and included in overall data for each jurisdiction submitted to the Australian Loan Council. These arrangements operate on a voluntary basis and emphasise transparency of public sector financing, rather than imposing borrowing limits on jurisdictions. The arrangements are designed mainly to inform financial markets of the probable use of public sector borrowings in the ensuing year.
Typically in jurisdictions where ministerial approval to borrow is required, borrowings can only be raised to finance the acquisition of assets, the nature of which must be specified. The exception is Queensland where councils are allowed to borrow for purposes of raising necessary working capital. The sources from where councils may access borrowings vary between jurisdictions:
In New South Wales and Victoria local governments do not have access to borrowings through a state guaranteed centralised financing authority.
In other jurisdictions local governments have access to borrowings through a state guaranteed financing authority and can also access funds from other lenders (Qld, SA, NT, Tasmania and WA).
Only in Tasmania is there a specific limit on borrowings. Technically in Tasmania the limit is applied indirectly by limiting the level of repayments. However guidance material on borrowing limits also exists in most jurisdictions.21 For example:
New South Wales councils are required to report debt servicing and liquidity ratios and they are published in the Division of Local Government’s annual local government ‘comparative
information’ publication.22 Technically the ‘liquidity ratio’ applied is titled the ‘unrestricted
current ratio’ and is defined as ‘current assets less all current external restrictions expressed as a ratio of current liabilities less current specific purpose liabilities’. A ratio of 1.5 or better is recommended. The debt servicing ratio is defined as net debt servicing costs (including debt
20 There are no restrictions on council borrowings applied in NSW at present, although legislation allows the responsible minister to
impose such restrictions. In Western Australia the treasurer may give a direction in writing to a local government with respect to the exercise its borrowing power, either generally or in relation to a particular proposed borrowing. In the Northern Territory councils may, without ministerial approval, borrow up to either $50,000 or $200,000 depending on their size.
21
Tasmanian councils’ aggregate borrowings are limited to an amount such that repayments (principal and interest) do not exceed 30% of general revenue (net of specific purpose grants).
22
See for example NSW Division of Local Government 2012. The Division of Local Government has advised that whether councils will in future be required to report on their debt servicing ratios is currently under review.
20
redemptions and sinking fund transfers) as a percentage of income from continuing operations. The Division of Local Government suggests that a ratio of more than 20% could be a concern but acknowledges that councils with high growth may warrant a higher ratio.
In Victoria the Victorian Auditor-General’s Office (VAGO) publishes councils’ performances against various financial indicator statistics. It considers councils to be exposed to high risk if they have liquidity ratios of less than 1.0, or indebtedness ratios of more than 60%.23
In Queensland, councils are encouraged to maintain net financial liabilities ratios not greater than 60%.24
In South Australia, the South Australian Local Government Association has issued guidelines recommending that councils set net financial liabilities ratio limits of between 0% and 100% but stresses that a well-managed council with specific needs associated with, for example
significant growth or the need to finance infrastructure with revenue streams (e.g. water supply and wastewater services), could potentially comfortably manage with a higher ceiling.25
In Western Australia councils are encouraged to maintain a debt service coverage ratio of greater than 2.0. However, the preferred standard is a ratio of greater than 5.0.26
In Tasmania the Auditor-General has established a benchmark net financial liabilities ratio for local governments of between 0% and 50%.27
In the Northern Territory the responsible minister has issued guidelines that require councils to have a policy with regard to borrowing before any borrowing takes place.
23. VAGO (Victorian Auditor General Office) defines ‘liquidity ratio’ as current assets relative to current liabilities’ and ‘indebtedness ratio’
as non-current liabilities as a percentage of own source revenue.
24
Queensland Department of Local Government, Community Recovery and Resilience.
25 Local Government Association of South Australia, Financial Sustainability Information Paper 9. 26
Western Australia’s Department of Local Government defines the ‘debt service cover ratio’ as the annual operating surplus before interest and depreciation divided by annual debt service payments (both principal and interest). In addition the Western Australian Treasury Corporation guidelines recommend a debt service ratio of less than 10% and a net debt (gross debt less cash assets) to operating revenue ratio of less than 60%.
27
21
6
Local government debt management practices
6.1
Why don’t councils make greater use of debt?
It is probably difficult for business owners, homebuyers and anyone else who has ever needed to use debt, to understand why local governments make so little use of debt. Is it perhaps because councils haven’t highlighted sufficiently the asset intensive nature of their service level responsibilities, the lumpiness of their annual capital expenditure needs, the predictability of their income streams and
the risks of inter-generationally inequitable rating and charging from not making extensive use of debt?
Perhaps prior to the introduction of accrual accounting and the development of asset management and long-term financial plans, councils themselves did not fully appreciate the above factors and the likely need therefore to make effective use of debt? Even now when these factors should be more clearly apparent many councils are reluctant to make greater use of debt and in fact strive to minimise debt levels.
PricewaterhouseCoopers (p.83) talk about an ‘aversion to using debt’ in local government and suggest this is ‘due to the lack of knowledge and understanding regarding commercially acceptable levels and applications of debt’. Ernst & Young (p.32) describe the ‘fear of debt’ as a key barrier to optimal use of debt financing in local government. It suggests that under-utilisation of debt is likely to result in an under-investment in local infrastructure. The New South Wales Treasury Corporation in its recent assessment of the financial sustainability of the New South Wales local government sector concluded that ‘Debt is underutilised and there are opportunities for it to be structured in a more cost effective manner’ (p.63).
It would be prudent for an individual or business that is uncertain of their future expenditure needs or income levels to be very cautious about raising additional borrowings. These days most councils should not be in that position but understandably, even with better information, it does take time for attitudes to change.
Another related and arguably more
important reason why councils have not traditionally made greater use of debt is that they have explicitly or implicitly been discouraged from so doing by technical and political advice, or they have been constrained by formal legislative obligations. There is now a requirement or strong encouragement in all jurisdictions for councils to base financial decision-making on accrual accounting information and to have regard to medium to longer term financial projections that are based on service level preferences and asset renewal needs. This should progressively help councils to better understand their capacity to carry more debt.
“many councils are reluctant to make greater use of debt
and in fact strive to minimise debt levels”
“Another … reason why councils have not traditionally
made greater use of debt is that they have explicitly or
implicitly been discouraged from so doing”
22
Nevertheless, if councils’ attitudes and practices regarding the use of debt are to change technical requirements and guidance material in many jurisdictions will also need to be revised. Often this material is inconsistent with the theory discussed in Section 4 and instead still reflects the widely accepted approach of the former era of one-year planning horizons and financial decision-making based on cash accounting information.
For example some jurisdictions still:
require or encourage:
- councils to raise separate borrowings for particular and specific capital works projects and that such borrowings be:
long-term for long-lived assets
structured on a credit-foncier basis
at fixed interest rates for the term of the borrowing
- a focus on liquidity, a requirement that is more relevant in commercial business environments that face much greater uncertainty regarding future revenue flows and ready access to borrowings. As such, some jurisdictions therefore encourage excessive holdings of lendings, with resulting higher net interest costs and interest rate risk exposures for councils
- councils to put aside monies to meet future anticipated liabilities or expenditure proposals even though these same councils may have outstanding borrowings and the councils could reduce interest expenses and interest rate risks by changing their practices.
place limits on or judge the acceptability of debt levels on a financial indicator called the ‘debt servicing ratio’. This ratio was commonly used as a benchmark to assess local government debt levels in many jurisdictions in the cash accounting era. It measures either annual interest or annual interest and principal repayments as a percentage of either rate revenue or total operating revenue. It is far less meaningful in the context of councils’ operating environments than the ‘net financial liabilities ratio’. When applied using annual interest and principal
repayments as the numerator (as is more common) the debt servicing ratio undermines a focus on accrual accounting information.28 Furthermore its calculated result when the numerator is
based on both interest and principal repayments is highly dependent on the duration of the borrowings and their required pattern of repayment. For example, a council can reduce its ratio by electing to take out its borrowings over a longer term.
Controls and guidance materials that are currently in place in the various jurisdictions have presumably been established with the intention of reducing the risk exposure of councils from excessive or inappropriate use of debt. However, inappropriate controls and guidance adds to councils’ costs and creates or leaves them exposed to other risks. For example some existing guidance and requirements encourage councils to:
focus on some aspects of their activity rather than on overall performance
maintain a short-term cash accounting focus rather than concentrating on their medium to longer term underlying operating result (and therefore their ongoing financial sustainability)
28
Under accrual accounting principal repayments have no impact on the income statement. They are not an expense. They simply reduce the value of assets (cash) and liabilities (borrowings) as recorded in the balance sheet.
23
prefer asset renewal backlogs to accumulate rather than raise borrowings if this would be necessary to address these needs
inappropriately chase high rates of return (with an associated increase in risk) for their substantial holdings of lendings rather than use this money to pay down debt.
Key illustrative examples of borrowing practices that are inappropriate but common in local government are the raising of individual borrowings for individual specific purposes and the taking out of borrowings on a credit foncier basis.29 These practices are discussed below.
6.2
Borrowing for specific purposes
Many councils have traditionally engaged in single-purpose borrowing to finance a particular project or activity, regardless of their current holdings of lendings or their future cash flow projections.
There is only ever one reason why an entity should borrow money – and that is because it needs the cash!30
Even when councils have undertaken borrowings to finance specific assets, it may be more fruitful for them to think of those borrowings as simply part of the mix of sources from which their total stock of assets were financed. This will enable them to manage all outstanding borrowings in a holistic way and it will assist councils to simply focus on minimising interest costs. It is misleading to link the cost of borrowings to the acquisition of some assets and not to others. Such an approach in is arbitrary and illusory and serves no worthwhile purpose. In fact, it is distracting. Councils need to manage their total expenses, their total assets and their total liabilities.
The above is true irrespective of whether some assets have an associated income stream or not. This includes situations in which councils wish to reflect the costs of necessary borrowings against
income from acquired assets. All asset acquisitions financed by a council have an opportunity cost of capital regardless of whether acquisition was financed from existing financial assets (in this case there will be a loss of interest income) or by borrowings. Where it is important for pricing and charging purposes, or when it is necessary to otherwise know the ‘full’ cost of a service provided by an asset, a standard notional cost of capital should be recognised. Whether a borrowing is raised and how it is structured is always a treasury management decision and only a treasury management decision. The asset acquisition decision needs to include consideration of affordability matters but not how any financing needs are best accommodated. The investment (that is, the asset acquisition) decision and the financing decision are separate and independent.
6.3
The use of credit foncier borrowings
In the cash accounting era it was commonly accepted practice for councils to raise borrowings for specific purposes and credit foncier borrowings were widely considered to be the most appropriate form of borrowing on the grounds of intergenerational equity. Councils were encouraged to raise borrowings with long duration repayment periods for long-lived assets and shorter-term borrowings for assets with shorter expected useful lives.
29
Credit foncier loans generally are for long terms and require regular set repayments over the term of the borrowing. Repayments include both interest and principal repayment components. A large proportion of early repayments represent interest expenses but over time, as the outstanding balance of the borrowing decreases, principal repayments make up a progressively higher proportion of each repayment.
30 More particularly the entity has a timing imbalance between the necessary or preferred affordable expenditure outlays and the income
that will become available to pay for it, and the entity is prepared to accept the costs and risks of raising a borrowing to bridge this timing gap.