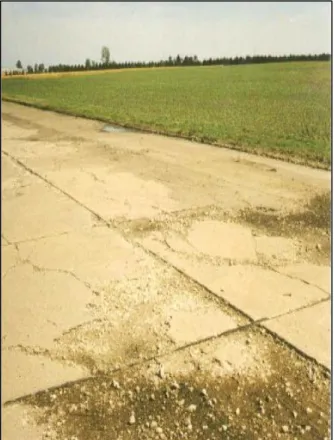
Electro-optical sensor evaluation of airfield pavement
146
0
0
Full text
Figure


+7


Outline
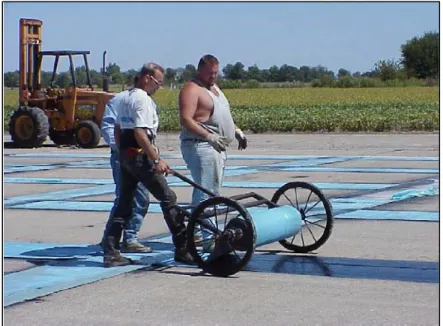
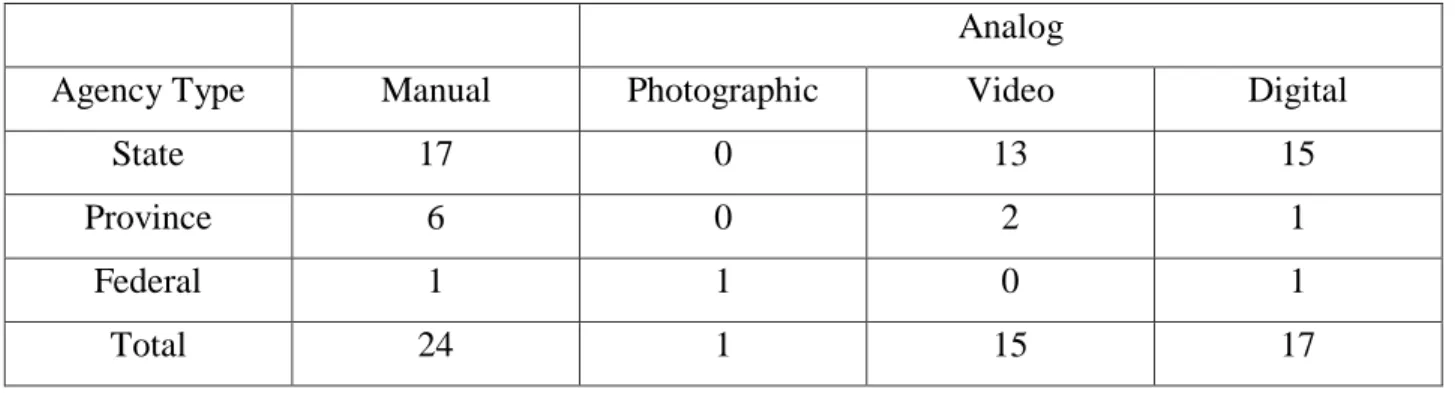
Automated Pavement Distress Collection Methods
Imaging Evaluation and Development
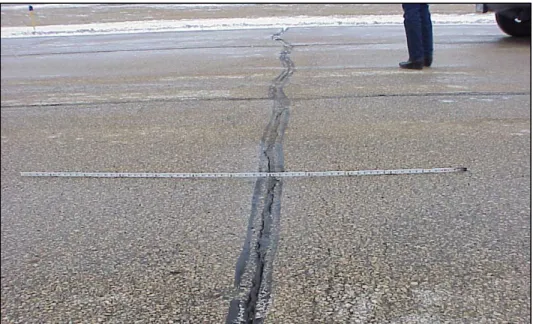
Crack Simulation Testing
Image Processing Analysis and Use of Historical Data using ImageJ
Pavement Condition Index Image Comparison
Crack Approximation
Comparison of Longitudinal and Transverse Cracks
Summary, Conclusion, and Recommendations
Related documents