econ
stor
Der Open-Access-Publikationsserver der ZBW – Leibniz-Informationszentrum Wirtschaft
The Open Access Publication Server of the ZBW – Leibniz Information Centre for Economics
Nutzungsbedingungen:
Die ZBW räumt Ihnen als Nutzerin/Nutzer das unentgeltliche, räumlich unbeschränkte und zeitlich auf die Dauer des Schutzrechts beschränkte einfache Recht ein, das ausgewählte Werk im Rahmen der unter
→ http://www.econstor.eu/dspace/Nutzungsbedingungen nachzulesenden vollständigen Nutzungsbedingungen zu vervielfältigen, mit denen die Nutzerin/der Nutzer sich durch die erste Nutzung einverstanden erklärt.
Terms of use:
The ZBW grants you, the user, the non-exclusive right to use the selected work free of charge, territorially unrestricted and within the time limit of the term of the property rights according to the terms specified at
→ http://www.econstor.eu/dspace/Nutzungsbedingungen By the first use of the selected work the user agrees and declares to comply with these terms of use.
Ardaiz, Oscar; Chacin, Pablo; Chao, Isaac; Freitag, Felix; Navarro, Leandro; Joita, Liviu; Rana, Omer F.; Streitberger, Werner; Hudert, Sebastian; Eymann, Torsten
Working Paper
Proof-of-Concept Application - Annual
Report Year 3
Bayreuth reports on information systems management, No. 27 Provided in cooperation with:
Universität Bayreuth
Suggested citation: Ardaiz, Oscar; Chacin, Pablo; Chao, Isaac; Freitag, Felix; Navarro, Leandro; Joita, Liviu; Rana, Omer F.; Streitberger, Werner; Hudert, Sebastian; Eymann, Torsten (2007) : Proof-of-Concept Application - Annual Report Year 3, Bayreuth reports on information systems management, No. 27, urn:nbn:de:bvb:703-opus-3725 , http://hdl.handle.net/10419/52637
Bayreuther Arbeitspapiere zur Wirtschaftsinformatik
Information SystemsManagement
Bayreuth Reports on Information Systems Management
2007
Oscar Ardaiz, Pablo Chacin, Isaac Chao, Felix Freitag, LeandroNavarro (Universidad Polytecnica de Catalunya), Liviu Joita, Omer F. Rana (Cardiff University), Werner Streitberger, Sebastian Hudert, Torsten Eymann (University of Bayreuth)
Proof-of-Concept Application - Annual Report Year 3
vorläufiger Ergebnisse, die i. d. R. noch für spätere Veröffentlichungen überarbeitet werden. Die Autoren sind deshalb für kritische Hinweise dankbar.
which will usually be revised for subsequent publications. Critical comments would be appreciated by the authors.
Alle Rechte vorbehalten. Insbesondere die der Übersetzung, des Nachdruckes, des Vortrags, der Entnahme von Abbildungen und Tabellen – auch bei nur auszugsweiser Verwertung.
All rights reserved. No part of this report may be reproduced by any means, or translated.
Authors: Information Systems and Management Working Paper Series
Edited by:
Prof. Dr. Torsten Eymann
Managing Assistant and Contact:
Raimund Matros Universität Bayreuth
Lehrstuhl für Wirtschaftsinformatik (BWL VII) Prof. Dr. Torsten Eymann
Universitätsstrasse 30 95447 Bayreuth Germany
Email: raimund.matros@uni-bayreuth.de ISSN
Oscar Ardaiz, Pablo Chacin, Isaac Chao, Felix Freitag, LeandroNavarro (Universidad Polytecnica de Catalunya), Liviu Joita, Omer F. Rana (Cardiff University), Werner Streitberger, Sebastian Hudert, Torsten Eymann (University of Bayreuth)
IST-FP6-003769 CATNETS
D3.3
Annual Report on WP3 (T0+36)
Contractual Date of Delivery to the CEC: 31 August 2007Actual Date of Delivery to the CEC: 30 September 2007
Author(s): Oscar Ardaiz, Pablo Chacin, Isaac Chao,
Felix Freitag, Liviu Joita, Leandro Navarro, Omer F. Rana, Werner Streitberger
Work package: WP3
Est. person months: 9.5
Security: public
Nature: final
Version: 1.0
Total number of pages: 53
Abstract:
This deliverable describes the work undertaken in Work Package 3 of the CATNETS project, which involves the following tasks:
(1) Development of performance measuring components for experiments. The task is mainly concern to defining the necessary components for the generation of the metrics, as well as capturing these values;
(2) Development of a distributed application to execute on economic-enhanced Grid/P2P platform and middleware integration. The task is related to the development of the prototype, including architecture, layers, modules, services, deployment, tests and capture of metrics, which are further analysed in WP4.
This document is part of a research project partially funded by the IST Programme of the Commission of the European Communities as project number IST-FP6-003769. The partners in this project are: LS Wirtschaftsinformatik (BWL VII) / University of Bayreuth (coordinator, Germany), Arquitectura de Computadors / Universitat Politecnica de Catalunya (Spain), Information Management and Systems / University of Karlsruhe (TH) (Germany), Dipartimento di Economia / Università delle merche Ancona (Italy), School of Computer Science and the Welsh eScience Centre / University of Cardiff (United Kingdom), Automated Reasoning Systems Division / ITC-irst Trento (Italy), Chair of Business Administration and Information Systems - E-Business and E-Government / University of Mannheim (Germany). University of Bayreuth LS Wirtschaftsinformatik (BWLVII) 95440 Bayreuth Germany Tel: +49 921 55-2807, Fax: +49 921 55-2816 Contact person: Torsten Eymann
E-mail: catnets@uni-bayreuth.de
Universitat Politecnica de Catalunya
Arquitectura de Computadors Jordi Girona, 1-3
08034 Barcelona Spain
Tel: +34 93 4016882, Fax: +34 93 4017055 Contact person: Felix Freitag
E-mail: felix@ac.upc.es
University of Karlsruhe
Institute for Information Management and Systems
Englerstr. 14 76131 Karlsruhe Germany
Tel: +49 721 608 8370, Fax: +49 721 608 8399 Contact person: Christof Weinhardt
E-mail: weinhardt@iism.uni-karlsruhe.de
Università delle merche Ancona
Dipartimento di Economia Piazzale Martelli 8
60121 Ancona Italy
Tel: 39-071- 220.7088 , Fax: +39-071- 220.7102 Contact person: Mauro Gallegati
E-mail: gallegati@dea.unian.it
University of Cardiff
School of Computer Science and the Welsh eScience Centre
Cardiff University, Wales Cardiff CF24 3AA, UK United Kingdom
Tel: +44 (0)2920 875542, Fax: +44 (0)2920 874598
Contact person: Omer F. Rana E-mail: o.f.rana@cs.cardiff.ac.uk
ITC-irst Trento
Automated Reasoning Systems Division Via Sommarive, 18
38050 Povo – Trento Italy
Tel: +39 0461 314 314, Fax: +39 0461 302 040 Contact person: Floriano Zini
E-mail: zini@itc.it
University of Mannheim
Chair of Business Administration and Information Systems
- E-Business and E-Government - L9, 1-2
68131 Mannheim Germany
Tel: +49 621 181 3321, Fax: +49 621 181 3310 Contactperson: Daniel Veit
Version Date Author Changes
01 16/05/2007 LJ First draft, Table of Content 02 23/06/2007 LJ Chapters 1, 3, 4 - first draft 03 06/07/2007 IC Chapter 2, 4 - first draft
04 13/07/2007 IC More content added to chapters 2 and 4 05 18/07/2007 SH Content added to chapters 2 and 4
06 27/07/2007 LJ Content added to chapter 7, revision to chapters 1, 3, and 4 07 30/07/2007 LJ Chapter 5 and 6 added
08 07/08/2007 LJ Revision to chapters 1, 3, 4, 5, 6 and 7 09 20/08/2007 IC More content added to chapters 2 and 4 10 23/08/2007 IC Revision of chapters 2, 3, 4, 5
11 28/08/2007 LJ Revision, proof reading 12 28/09/2007 WS Final draft editing 13 28/09/2007 LJ Revision chapter 4
14 01/10/2007 IC Revision algorithm ZIP agents sec. 2.3.2 + alignment WP4 15 04/10/2007 WS Incorporating revisions of chapter 6
1 Introduction ... 6
2 Catallactic Middleware ... 7
2.1 Catallactic Resource Allocation Model ... 7
2.2 Catallactic Middleware Infrastructure ... 8
2.3 Grid Market Middleware and its implementation ... 9
2.3.1 Contract Net simple offer/demand agents ... 9
2.3.2 Zero Intelligence Plus agents ... 10
2.3.3 Catallactic agents ... 12
3 Distributed application to execute on economic-enhanced Grid/P2P platform and middleware integration ... 14
3.1 Application Layer Components ... 15
3.1.1 Scenario Generator ... 17
3.1.2 CATNETS Service Provider Advertisement Service ... 18
3.2 Middleware Layer Components ... 19
4 Prototype performance measuring components for experiments ... 21
4.1 Application Scenarios & Use Cases... 21
4.2 Performance measuring components for experiments ... 21
4.3 Performance Results ... 24
5 Relation to other WPs ... 26
5.1 WP1 ... 26
5.2 WP2 ... 27
5.3 WP4 ... 27
6 Economical model for eNVS ... 28
6.1 Hypothesis ... 28
6.2 Scenarios ... 28
6.3 Algorithm for decision making regarding the hypothesis ... 29
6.4 Hypothesis testing ... 30
6.5 General observations about CATNETS in regard to the hypothesis and the main question presented above ... 31
6.6 Conclusions and further directions ... 34
7 Conclusions of WP3 ... 35
7.1 Prototypes using Catallactic-based markets ... 35
References ... 36
How to deploy the GMM ... 49
Deploy from scratch ... 49
Deploy after config changes / GMM jar update ... 50
How to run the experiments ... 50
Experiment configuration ... 50
Running Experiments ... 51
How to collect metrics ... 51
Raw Metrics available ... 51
1 Introduction
This deliverable describes the work undertaken in Work Package 3 (WP3) of the CATNETS project, which involves the following tasks:
x T3.3 Performance measuring components for experiments. The task is mainly concern to defining the necessary components for the generation of the metrics, as well as capturing these values.
x T3.4 Distributed application to execute on economic-enhanced Grid/P2P platform and middleware integration. The task is related to the development of the prototype, including architecture, layers, modules, services, deployment, tests and capture of metrics, which are further analysed in WP4.
The document is divided in seven parts:
x The introduction into the Application Layer Network;
x Catallactic resource allocation model and middleware architecture;
x Distributed application to execute on economic-enhanced Grid/P2P platform and middleware integration;
x Prototype performance measuring components for experiments; x Relation to other work packages;
x A case study of the CATNETS applicability for an experimental National Visualization Service in UK, and conclusions.
2 Catallactic Middleware
The Grid Market Middleware (GMM) design, implementation and early evaluation have been thoroughly described in previous deliverables. Development in core GMM components (agent hosting, group communication, metric collection) has been frozen since Year 2, once requirements have been met. For this last year, effort has been switched to two main tasks: firstly, specifying and implementing a dedicated resource model amenable to detailed experimentation with the prototype in a resource constrained environment; secondly, testing as many economic protocols as possible. So far we have implemented three different economic algorithms in the same GMM substrate. We have demonstrated with this the modularity of the tool referred as Grid Market Middleware toolkit.
High-Performance Grid Computing (HPGC) combines the advances in research and technologies in high speed networks, software, distributed computing and parallel processing to deliver high-performance, large-scale and cost-effective computational, storage and communication capabilities to a wide range of applications. Typically the resources are used in Grids to provide processing capabilities for massive batch job scheduling. In this context, the resources are consumed in a dedicated mode. Each processor runs one batch job at a time, and concurrent processing of several jobs in one processor is not considered. This contrasts with transactional applications. With transactional applications there are different issues to be considered, such as: accessing databases or maintaining the transactional integrity of the request. Resources are not dedicated, and small concurrent computations for specific tasks might be performed continuously on the resources. We considered into the experimental phase of the prototype running in the cluster only the HPGC scenario with full dedicated resources.
2.1 Catallactic Resource Allocation Model
The dedicated resource model translates for the market concerns in a limited offer by the BasicServices (BSs). Once the BS has sold its resource to a ComplexService (CS), it cannot accept more bids from other CSs’ Call for Proposals (CFPs) until the moment when the client of the awarded CS ends the execution of the sold service (i.e. the Data Mining service in our prototype scenario) in the resource. This peculiarity is what makes novel and interesting this scenario with respect to other previous research on decentralized economic algorithms based on simple learning agents in ideal markets [Preist, 1998], [Despotovic, 2004].
The dedicated resource model is modelled in this precise way for the GMM deployment in clusters:
1) Each BS is deployed in one node. The CPU of this node is its resource. Then the second market is useless here, we consider that the BS always has this precise resource and no other resource available.
2) Once a CS buys a BS, the CS (which could be seen, as a logical element, the application proxy which executes the service with the end point reference (EPR) passed by the BS) executes the service (i.e. Data Mining service) on the resource and no other CS can bargain for it. When execution is over, the resource can come back to the market. The BSs are aware of execution termination by means of a lock that the CS deletes on the resource when execution ends.
2.2 Catallactic Middleware Infrastructure
There has been an increase of interest in Service Oriented Grids (SOGs) recently within the Grid community towards services that are often considered as a natural progression from component based software development, and as a mean to integrate different component development frameworks. A service in this context may be defined as a behaviour that is provided by a component to be used by any other component. A service stresses interoperability and may be dynamically discovered and used [Foster, 2002]. Utility computing assumes service instances are created on the fly and automatically bound as applications that are configured dynamically. The service viewpoint abstracts the infrastructure level of an application. It enables the efficient usage of Grid resources and facilitates utility computing, especially when redundant services can be used to achieve fault tolerance. As for configurability, a SOG system is configured on-demand and flexibly, which means different components are bound to each other late in the composition process. Thus, the configuration can change dynamically as needed and without loss of correctness.
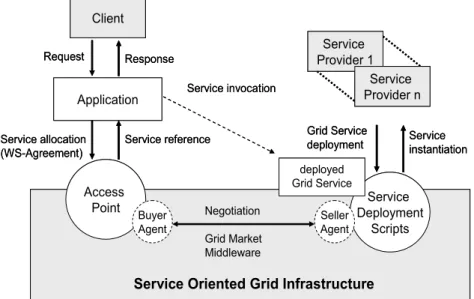
In a SOG infrastructure, the GMM is exposed to be accessed by applications trough a convenient access point, a Web Service which can be deployed in any application server and integrated as a service in an existing SOG. Figure 2.1 describes the main steps in the interaction trough the access point. When a client issues a request, the application determines which Grid services are required to fulfil it. These Grid services represent either software services (e.g. a data processing algorithm) or computational resources. The application translates these requirements into a standardized Service Level Agreement (SLA) document based on WS-Agreement [WS-Agreement, 2007]. The application invokes the access point and passes the corresponding SLA request. This is in turn parsed and processed at the access point, which instantiates the GMM with the required economic agents to fulfil the client request.
The GMM searches among the available service providers, which have registered their particular service specifications, like contractual conditions, policies and QoS levels. When a suitable service provider is found, the application requirements are negotiated within the middleware by agents who act on behalf of the service providers as sellers and on behalf of the applications as buyers. Once an agreement is reached between the trading agents, a Grid service instance is created for the application and a reference is returned to the application/client, which can invoke it.
The server-side infrastructure is deployed by a set of scripts which allow for the bootstrapping of BSs in available resources. The scripts perform the automatic deployment and configuration of the BSs, which are then ready to be contacted by CSs. Services offered by BSs for clients executions are also deployed and exposed in Apache Tomcat application servers. Complemented by the access point, this comprises a complete infrastructure for economic-based SOGs.
Application
Service Oriented Grid Infrastructure
Service Deployment Scripts Service Provider 1 Request Service allocation (WS-Agreement) Grid Service deployment Client Service reference Service Provider n Response Access Point Negotiation Grid Market Middleware Buyer Agent Seller Agent Service invocation Service instantiation deployed Grid Service Application
Service Oriented Grid Infrastructure
Service Deployment Scripts Service Provider 1 Request Service allocation (WS-Agreement) Grid Service deployment Client Service reference Service Provider n Response Access Point Negotiation Grid Market Middleware Buyer Agent Seller Agent Service invocation Service instantiation deployed Grid Service
Figure 2.1 - Service Oriented Grid (SOG) infrastructure.
2.3 Grid Market Middleware and its implementation
The GMM allow currently for plugging of various decentralized economic algorithms. We have demonstrated this with three implementations: the Catallactic agents implementation discussed in WP1 and the alternative algorithms such as: Contract-Net protocol with simple offer/demand, and Zero Intelligence Plus (ZIP) agents in a continuous double auction.
2.3.1 Contract Net simple offer/demand agents
In this version of the GMM, we have plugged in as economic agents an implementation of the Contract-Net protocol standardized by FIPA [FIPA, 2007], as shown in Figure 2.2. The Contract-Net protocol has been developed to specify problem-solving communication and control for nodes in a distributed problem solver. Task distribution is affected by a negotiation process, a discussion carried on between nodes with tasks to be executed and nodes that may be able to execute those tasks. This protocol has been applied to many domains in multi-agent systems [Paurobally, 2004]. An example of application of the protocol to Grid resource allocation can be found in [Chao, 2004].
The Contract-Net protocol starts with a task announcement phase by the initiator (the buyer), which can be answered by one or more participants (the sellers). This announcement is carried out by a groupcast of a call for proposals (CFP). After concluding this period, the initiator selects from the set of collected proposals the best one, informing the winner. On top of this protocol we apply a simple offer/demand-based economic algorithm: the sellers will answer the CPFs which meet its current selling price. If the CFP does not meet its requirements, the seller will lower its expectations and it will decrease the selling price. As for the buyers, if a seller rejects the CFP, then it will lower its expectation by increasing the offer in the next CFP. Both the buyers and the sellers will increase their expectations in case of receiving offers/bids which meet their expectations. The price updating is done at fixed small price steps.
2.3.2 Zero Intelligence Plus agents
In this version we consider a simplified Grid market with only one homogeneous Data Mining service being traded. The execution time of the service can be varied during the experiments. The auction mechanism is a continuous double auction in which the agents follow a modified ZIP strategy based on [Preist, 1998].
In the context of the GMM, the buyer agents are called ComplexServices (CSs) and the seller agents BasicServices (BSs). CSs aggregate BSs from the market. As BSs and CSs get involved in trading, the price will evolve by offer and demand, with dependence on the limited CS budget and the limited resources which can be sold by the BS. Once the BS has sold its resource to a CS, it cannot accept more bids from other CSs’ CFPs until the moment when the client of the awarded CS ends the execution of the sold Data Mining service in the resource.
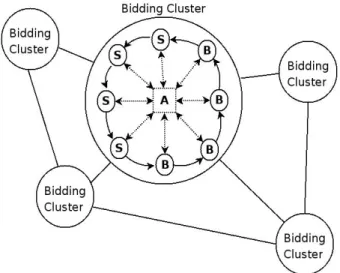
For the realization of the decentralized continuous double auction we divide the traders in subgroups, called clusters (see Figure 2.3) which are trading independently. This allows to cope with the scalability of large networks. Moreover this approach enables the agents to be well-informed of shouts from other agents, which in decentralized auctions is a general problem [Despotovic, 2004]. To avoid this groups are only trading isolated, agents have to join and leave the clusters. The selection of individual agents to move to another cluster depends on their trading success. This method allows reaching one global equilibrium price P0 for all clusters situated the distributed market place. As the feasibility of a global P0 is already shown in [Ogston, 2002], we will concentrate our prototype analysis focusing in one bidding cluster.
Figure 2.3 - Bidding clusters
Each cluster deploys an own central continuous double auction. The agents are coordinated in synchronous manner and are acting in bidding rounds. Therefore a delegated auctioneer controls the matching of the bids and offers, where the highest bid corresponds to the lowest offer. No matching of a trade will be executed, if no offers are lower than the highest bid exists.
The bidding algorithm is based on extended ZIP agents. This allows reaching the equilibrium price P0, at which the maximum resources will be exchanged, with simple agents. Therefore they have to know the minimum price of the shouted offers, by sellers Smin and the maximum price of the shouted bids by buyers Bmax. The agents base the bidding algorithm to calculate the new price P(t+1) on these two values. The price update in the basic service follows a gradient algorithm: if the current price is above the maximum offered price of all bids, the basic service tries to lower its price to become competitive. If the price is below, it “tests” the market by raising the price, looking for higher profits.
In the following algorithm, PriceChange is a parameter that defines the price change rate. The algorithm bases on a momentum considering the weight of previous price changes and on the learning rate describing the rapidity of adoption to the current target price.
Algorithm1: Bidding algorithm of the BS (seller).
Input: random1 > 0 and < 0.2
Input:random2 > 0 and < 0.2 and not random1;
if Smin > Bmax then
PT = Smin - ( random1 * P(t) + random2);
else
PT = Bmax + ( random1 * P(t) + random2);
endif
priceChange = * priceChange + (1-) * * (PT-P(t)); P(t+1) = maximum (P(T)+priceChange, Pmin) ;
Algorithm 2: Bidding algorithm of the CS (buyer).
Input: random1 > 0 and < 0.2
Input:random2 > 0 and < 0.2 and not random1;
if Smin > Bmax then
else
PT = Smin - ( random1 * P(t) + random2);
endif
priceChange = * priceChange + (1-) * * (PT-P(t)); P(t+1) = minimum (P(T)+priceChange, budget) ;
2.3.3 Catallactic agents
The catallactic agents are more complex than both simple Contract-Net agents and ZIP agents from previous sections. In fact, catallactic agents apply and iterate Contract Net protocol with sophisticated strategies for the bargaining (the catallactic strategy described thoroughly in WP1) and applying an extra evolutionary learning step (conform to the learning algorithm from WP1). These sophistications target both a better control of agents’ goals through the strategy, and improve adaptability through evolutionary learning.
Figure 2.4 depicts the whole process of the middleware implementation. The ApplicationProxyAgent firstly creates a demand message and sends this to all the ComplexServiceAgents (CSA) in the market (groupcast). After the discovery timeout occurred the ApplicationProxyAgent chooses one of the CSA that answered to that demand message for processing it on the actual CATNETS market (acknowledgment of the demand for the one chosen CSA). After this first step the CSA task to handle the particular demand is identified. This agent subsequently creates a Call-for-Proposals (CfP) message according to the demand received (considering the types and numbers of needed BasicServices for this ComplexService). After creating the CfP message, this is sent to the Service Market (groupcast to all BasicServicAgents). Again, the sending agent waits for a distinct amount of time, the discovery timeout, and then chooses the best offer of all received answers to this CfP (proposals from BasicServiceAgents). Subsequently, the CSA starts a one-to-one negotiation with the chosen BasicServiceAgent (BSA). After successfully finishing this negotiation the BSA creates a CfP message for the Resource Market according to the agreement just reached with the CSA. Again after reaching the discovery timeout for the Resource Market the BSA starts a one-on-one negotiation with the Resource Agent having posted the best proposal after the CfP.
3 Distributed application to execute on
economic-enhanced Grid/P2P platform and middleware
integration
Different examples of application scenarios can be constructed and could benefit from using the Grid Market Middleware (GMM) in combination with centralized auctions or decentralized bilateral bargaining approaches over Grid computing infrastructure. This leads to an advantageous flexibility by allowing different application-specific requirements and needs of services and resources to be addressed.
One application scenario could require a highly specialized service (e.g., a medical simulation service, visualization service or query service). Another application requires a specific data mining service or mathematical service. The data mining service is more or less standardized and there are several suppliers offering this service. Different types of auction algorithms could be used by the supplier, such as MACE [Schnizler, 2006] or a double auction. The medical simulation service, however, does not have many suppliers. As such, the liquidity of the market trading such services may be low. In such cases, English auctions may be useful.
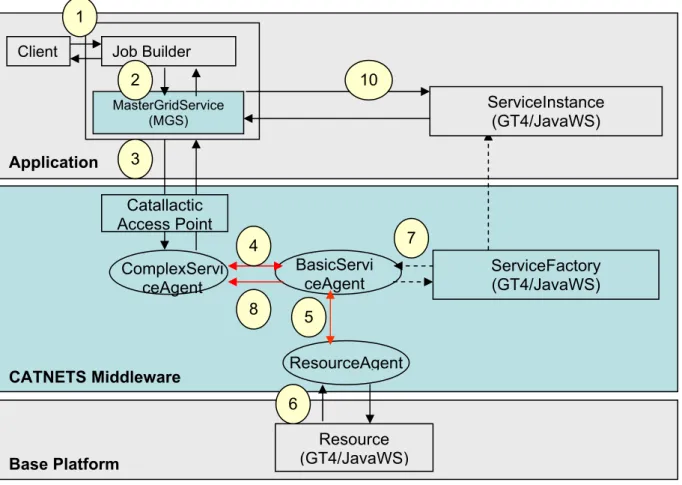
Figure 3.1 details the logical components of a distributed catallactic enabled prototype along the three layers: the application layer, the catallactic middleware layer and the base platform layer – in the use case of one service invocation [WP3-Year2, 2006].
Figure 3.1 – Catallactic enabled prototype – logical layers and components
Client Job Builder
MasterGridService (MGS) ServiceFactory (GT4/JavaWS) ComplexServi ceAgent Application CATNETS Middleware Resource (GT4/JavaWS) BasicServi ceAgent ResourceAgent Base Platform ServiceInstance (GT4/JavaWS) 1 2 3 4 5 6 7 8 10 Catallactic Access Point
At the application layer, there are two main logical modules: (1) the job builder module, which interprets the user’s request, and (2) the Master Grid Service (MGS), the module named in Catnets that requests services on behalf of the user. The application requests are made via an interface, named Catallactic Access Point (CAP), this is an important module that must be provided to issue the requests for services to the middleware, and use the references to service instances provided in response. At the middleware layer, a set of agents provide the capability to negotiate for services and resources. The Complex Service agent acts on behalf of the application and initiates the negotiation. Basic Service and Resource agents manage the negotiation for services and resources respectively. A Service Factory is provided to instantiate the service on the hosting platform selected during the negotiation process. Finally, at the Base Platform layer, a Resource is created to manage the allocation of resources to the service. This resource represents the “state” of the basic service from the perspective of the middleware (however this does not mean the service is stateful from the perspective of the application). The flow of information among the logical components can be summarized as follows: a Client issues a request to the application (1), which builds a data mining job and requests the execution of this job to the MGS (2). The MGS contacts a CAP asking for a WS-Agreement template for such a service. The MGS fills in the template and sends back an AO (3). The Complex Service Agent initiates the Catallactic mechanism to find appropriate Basic Services and Resources. The Complex Service Agent uses the discovery mechanisms implemented in the middleware to locate Basic Service Agents providing the J48 Service. When a number of Basic Service Agents are discovered, it starts negotiations with one of them (4). In turn such Basic Service Agent must discover and negotiate with a Resource Agent for resources (5). Negotiations are implemented by the Economic Framework Layer, where different protocols can be used depending on the agent's strategy. When an agreement with a Basic Service Agent is reached, the Resource Agent instantiate a Resource to keep track of the allocated resources and returns to the Basic Service Agent a handle for this resource (6). Consequently Basic Service Agents use the service Factory to instantiate the data mining service on the selected GT4 container (7). Basic Service Agent returns to the Complex Service Agent the End Point Reference (EPR) to this data mining service instance (8), forwarded to the MSG (9), which uses it to invoke the service (10). The CAP therefore provides an interface between an application wishing to discover suitable services, and the underlying resources that host those services.
The following sub-sections contain a description of two layer components of the proof-of-concept prototype: the Application layer and the Middleware layer, as well as the integration and deployment process as one entity distributed application.
3.1 Application Layer Components
Figure 3.2 shows a detailed graphical view of components and repositories of an application prototype that accesses the Catallactic middleware, the components and the modules of interaction between application and middleware, as well as the workflow among the components. The repositories could be any type of database (MS SQL, MySQL, Oracle, etc) or files systems. In our implementation, the repositories are based on MySQL 5.0. The Catallactic Access Point Web Service (CAP_WS) is a wrapper in the format of a Web Service which provides the location of a CAP closer to the user location. There are different ways of “enforcing” or “finding” the user location, such as: user’s digital certificate, in which the location is specified as a parameter in the certificate, “ping” time between the user and multiple available CAPs, etc.
Application settings, repositories, and details about two scenarios designed, developed, implemented and deployed are presented in [WP3-Year2, 2006] -- these involve the use of a Query Service and a Data Mining Service.
Figure 3.2 – Application prototype components
The workflow process, in a generalised application that connects to a Catallactic GMM, could be summarised as:
1 – A user enters the request criterion.
2 – A type of Job Loader / Builder component service interprets the user’s request and converts it into a service request.
3 – A generic service, interpreted by Master Grid Service in the above diagram, requires an application specific logic, such as: start a workflow of services to fulfil the user request, or obtain a budget. Any other parameters could be customised and added to this module.
4 – The Catallactic Access Point lists services available on the market (as complex or basic services) and establishes the necessary agreements.
Job Loader/Builder Service INPUT -- Parameters: <AppInstanceName> <Location> <No.Instances> <Delay> Loader_DB MGS 2 3 1Launch Prototype 2Select the job
1
3Retrieve the job 4Launch the job
5Select the closest CAP 6Retrieve the closest CAP
CAP_URLs_DB CAP_WS CAP Barcelona MGS_Agreement_DB CAP_AgreementTemplates_DB CAP_AgreementTemplates_DB Catallactic Middleware 4 7c 7b 7a 8 6 8 7 5 9
7a, b, c – Exchange agreements; Submit the job 8Retrieve the results
9Pass the results 10Display the results
OUTPUT -- Results
10
APPLICATION
CAP (Cardiff)
3.1.1 Scenario Generator
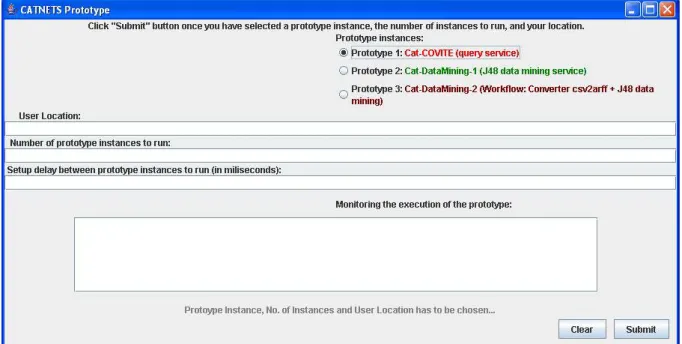
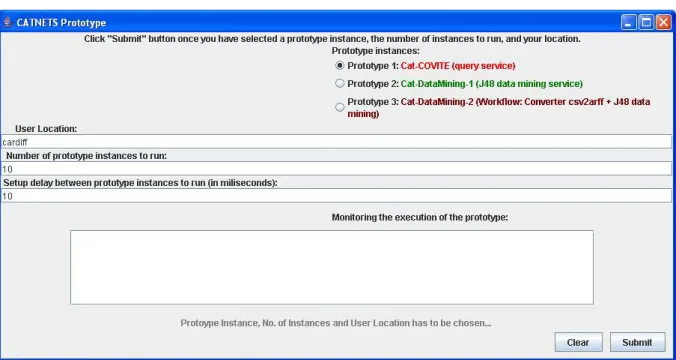
The generation of a scenario at the prototype can be done manually, using a GUI which allows the user to specify the initial parameters the prototype needs to start with. Figure 3.3 presents the GUI. The GUI provide an interface for the prototype to set up the scenario that application will run for testing the capabilities of Catallaxy, as well as to perform tests and extract the results which will be compare with the simulator results in WP4.
Figure 3.3 – CATNETS prototype
The use of the GUI is straightforward: the user specifies which application prototype instance to start by choosing among the buttons from the Prototype Instances layer. The implementation provides three different types of instances:
x firstly, Cat-COVITE prototype, which is based on the COVITE prototype [COVITE]. x secondly, the Cat-DataMining-1 prototype, in which one service request for and
invocation of a J48 data mining service is made.
x thirdly, the Cat-DataMining-2 prototype, in which a workflow of services could be requested to GMM via the CAP. This option is available only in a centralized case, in which the services that compose the workflow are allocated statically by the CAP.
In order to run the tests, Figure 3.4 provides an example of the prototype GUI with parameters. The prototype instance to run is Cat-COVITE, the user location is: cardiff – this will be used to asses the closest CAP that the application will invoke in order to request the necessary services from the markets (GMM). Also, the market instance is connected to the CAP. The “number of prototype instances to run” and the “delay between prototype instances to run” are two parameters needed to run tests, collect the metrics obtained in the prototype and compare the results with the simulator that runs under similar conditions.
Figure 3.4 – Example of application prototype GUI with parameters
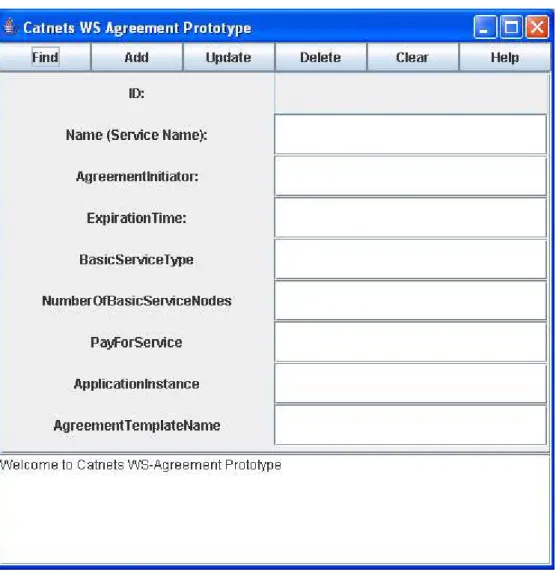
3.1.2 CATNETS Service Provider Advertisement Service
The following tool is part of the CATNETS prototype and allows service providers to advertise their services on the GMM market. This is the service needed by the application user.
Figure 3.5 presents the GUI interface of this tool. The following are the functionalities of the tool:
- FIND button helps to locate an agreement (search using Name (Service Name) field). - ADD button helps to create a new agreement template -- storing the attributes in the
'AgreementTemplates' table and advertise the template in the 'agreementemplate' table of cap_agreementtemplates_db database from the CAP repository. - UPDATE button helps to update the attributes of the agreement template (first use FIND button to locate the agreement you want to update), as well as the advertised agreement template.
- DELETE button helps to delete an agreement template record (first use FIND to locate the agreement you want to delete), in both tables: AgreementTemplates - that stores the template attributes, and in the agreementtemplate -- that stores the advertised agreement template
- CLEAR button to empty the fields.
The following parameters are needed:
- Name (Service Name) – the name of service advertised by the service provider, so that application users can search for. The following Service Names are already available within the CATNETS prototype (as services available on GMM): QueryService,
J48DataMiningService, ConverterCsvToArff-J48DataMiningService, ConverterCsvToArff_Service, ContourService
- ExpirationTime – defines the time until the service advertised in valid to. The “ExpirationTime” attribute has to be entered ONLY in this format: 'YYYY-MM-DD' - BasicService Type – the name of the basic service that is made up the service available. - PayForService – the maxim price (budget) the application user is willing to pay for the
service from the market. The service provider can also fill in this parameter, meaning that the service is available for at least the price specified by this parameter, as minimum. - ApplicationInstance and AgreementTemplateName are two parameters needed by the
CATNETS prototype. In order to run the prototypes, the following names have to be used in the “ApplicationInstance”: J48DataMining_WS, covite, converterCsv2Arff_WS-J48DataMining_WS, converterCsv2Arff_WS, cat-ContourService.
Figure 3.6 – CATNETS Service Advertisement prototype
3.2 Middleware Layer Components
The dedicated resources model operates in the following manner in the context of the experimental setup for the Data-Mining prototype.
We setup controlled experiments by deploying several instances of the GMM in a Linux server farm. Each machine has a 2 CPU Intel Xeon at 2.80 GHz and 2 GB of memory. The nodes in the farm are connected by an internal Ethernet network at 100Mps. The topology is a
mesh; all nodes are interconnected to each other. CFPs are transmitted via groupcast to all the nodes in the destination groups (in our scenario CFPS are groupcasted from CSs to BSs).
We deploy the GMM in a number of nodes. Some nodes host a BS each and the Data Mining Web Service, while other nodes host the CSs, access points and clients. The Web Services are exposed in Tomcat servers. Access for execution of these Web Services on the resource node is what is traded between BSs and CSs. The experiments consist in launching 2 clients concurrently, which use each one of the CS as broker. Each client makes a number requests to the CS in intervals of a few seconds. Whenever a CS wins a bid with a BS, it invokes the Data Mining Service in the selected node, and the resource in the corresponding node gets locked for the duration of the service execution. We measure the selling prices of the BSs and observe the proportion of successful CFPs issued by the CSs.
4 Prototype performance measuring components for
experiments
4.1 Application Scenarios & Use Cases
Application scenarios and uses cases have been presented in WP3-year 2 deliverable. This section presents the use case used for CATNETS tests made using the J48 Data Mining example. The scenarios are fully described in WP4-year3 deliverable.
The use case implemented within the CATNETS prototype has the following flow: an application user wants a complex service of type “S” made up of just one basic service “S1”, in which case the application requests the Catallactic GMM to find this specific complex service. This case does not require co-allocation of services. The application gets the service instance back from the GMM or nothing, in which case the interaction between the application and the GMM is terminated, and a new request has to be issued by the application.
In a workflow scenario, a client wants a complex service of type “S” (made up of just one basic service “S1”). The MGS asks CAP what complex services of type “S” are currently available. The CAP subsequently sends a list of possible types of complex services to the MGS -- one of these is “S1”. If there is no “S1”, the process terminates, requiring the client to make a new request.
In another version of this scenario, an MGS asks for a service of type “S”. By using the middleware complex service agent, a basic service that implements “S” is found (referred to as “S1”). If “S1” is available on multiple resources (R), one R that can host “S1” is returned as an end point reference – using the middleware. It may be assumed that different instances of “S1” on different resources have a different price.
Two proof-of-concept application prototype instances, based on the above scenarios, have been implemented:
x In CAT-COVITE, there is only one S (Query Complex Service), made up of a query basic service (S1). There is only one type of resource (a database hosted on a particular machine). Hence the choice is based on selecting one instance of S1 and one instance of R (all of which do the same thing).
x In Cat-DataMining, there is a complex service S (Data Mining Complex Service), made up of a Basic Service S1 (J48 data mining classifier basic service). The type of resource R is defined by the bundle of {CPU, memory, latency}. The choice is based on selecting one instance of S1 and one instance of bundle R.
4.2 Performance measuring components for experiments
This section deals with the metrics collected at the agent layer of the middleware. First the process of executing a demand on the CATNETS market will shortly be sketched to set the context of the metric collection, for a more detailed discussion of this process see section 2.3.3 in this WP3 and the Deliverables for WP1. Afterwards the metrics collected will be presented along with the actual situation within the process when they are gathered.
Some metrics are semantically meaningful for all agents involved some only make sense for a subset of the involved agent types (ApplicationProxyAgents, CSA, BSA, ResourceAgents). All metrics collected will now shortly be described along with the individual points in the overall process when they are collected and the agent types collecting them.
Metrics collected in the Catallactic agents: x Negotiation Request Metric
x Negotiation Start Metric x Negotiation End Metric x Strategy Metric
Each of these metrics represents a bundle of raw data that is semantically grouped. A more detailed description follows below.
Negotiation_Request metrics consist of the following data:
x Timestamp Æ timestamp stating when this particular metric was collected/written
x Writing Agent Æ Agent that was collecting/writing this metric x NegotiationID Æ Identifier of the negotiation this metric is related to
This metric is always written when a new request for negotiation is initiated. This differs from ApplicationProxyAgents to all other agent types. The ApplicationProxyAgent writes this metric when sending the demand message to the CSAs. The CSAs and BSAs write it when sending a CfP to either the Service Market (CSA) or the Resource Market (BSA).
Negotiation Start metrics consist of the following data:
x Timestamp Æ timestamp stating when this particular metric was collected/written x Writing Agent Æ Agent that was collecting/writing this metric
x “start” Æ flag stating that this metric is a negotiation start metric x NegotiationID Æ Identifier of the negotiation this metric is related to
This metric is written after the discovery timeout is reached and a one-to-one negotiation is started (if at least one potential negotiation partner answered the CfP). Since the groupcast sent from the ApplicationProxyAgents to the CSAs does not result in a one-to-one negotiation between the ApplicationProxyAgent and the CSA – the chosen CSA just starts a CfP on the Service Market – this only CSA and BSA write the negotiation start metric.
Negotiation End metrics consist of the following data:
x Agent 1 Æ Agent sending the accept/reject message
x Agent 2 Æ Agent receiving the accept/reject message; agent writing this metric x “end” Æ flag stating that this metric is a negotiation end metric
x NegotiationID Æ Identifier of the negotiation this metric is related to x “failure” or “success” Æ flag stating the result of the negotiation
The negotiation end metric is written whenever an accept or reject message (stating the end of a one-to-one negotiation) is received. This metric is written by the receiving agent. Since in a one-to-one negotiation each of the both involved agents can end the negotiation (i.e. sending an accept or reject message), all agents of the CATNETS market (CSA, BSA and ResourceAgents) can write this metric.
The Strategy metrics consist of the following data:
x Agent Æ writing agent
x “seller” or “buyer” Æ flag indicating the role of the particular agent in this negotiation
x Acquisitiveness Æ concession probability x Price Step Æ price step probability
x Price Next Æ price jump between two negotiations x Satisfaction Æ probability to continue negotiation x weightMemory Æ weight of old negotiation results x average Profit Æ agent’s fitness
x generation Æ crossover counter x currentMessageID Æ message id
x currentMessagePrice Æ price at which the negotiation was ended x currentAverage Æ estimated market price
x currentLowerLimit Æ lower price range limit x currentUpperLimit Æ upper price range limit
The strategy metric is always written when a negotiation was ended successfully (accept message was sent). However this metric is written by both agents involved in this negotiation in order to log both strategy values. For clarity reasons only the important data used for calculating the overall metrics for the CATNETS market are indicated by additional
information here. For a more detailed overview of all strategy values used for implementing the agents’ intelligence see WP1.
Based on this information the agent-related metrics can be calculated (see next section for a summary of all metrics used within CATNETS and WP4 for further information about the computation of higher level metrics).
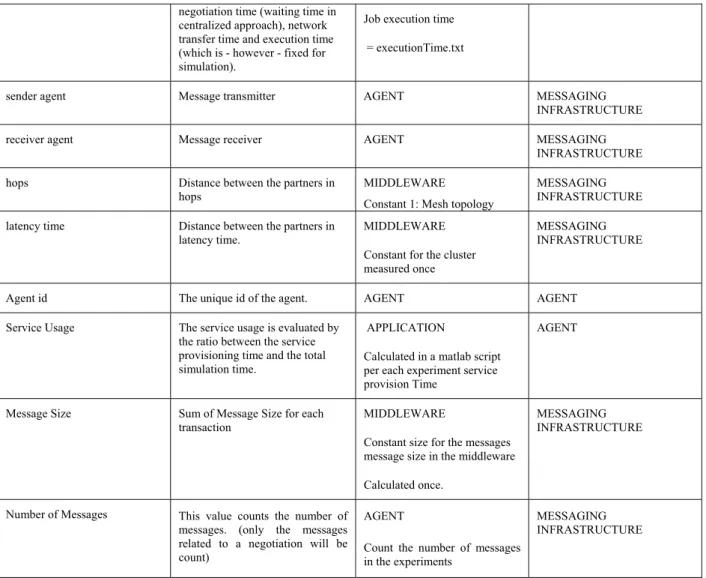
4.3 Performance Results
Table 4.1 provides a global view of the metrics measured with the CATNETS prototype and the alignment with the metrics measured within the simulator.
We refer to WP4 year 3, section 3.8 for the experimental results and evaluation for the all three decentralized economic algorithms implemented in the prototype and its evaluation.
Metric Description Prototype Layer Simulator Layer
start timestamp. Experiment start time APPLICATION (NOT NEEDED)
Simulator end timestamp Experiment stop time APPLICATION (NOT
NEEDED)
Simulator Timestamp Time elapsed from the beginning
of simulation and experiment (Simulation time
reference/Realtime for prototype).
MIDDLEWARE AGENT Number of Demand Requests This metric counts the number of
launched discovery processes until this contract is achieved.
APPLICATION AGENT Number of Negotiation
Requests
This metric counts the number of launched negotiation processes until this contract is achieved
AGENT AGENT Number of Demand Accepts This metrics counts the number of
accepted demands before a transaction occurs
APPLICATION AGENT Number of Negotiation Accepts This metrics counts the number of
accepted negotiations before a transaction occurs
AGENT AGENT Agent Satisfaction Calculated from 3 variables:
Final price of the negotiation Reservation price for the buyer maximum price he is willing to pay; for the seller minimum sell price
AGENT AGENT
Discovery Time This metric is used to measure the time to find a given set of possible negotiation partners.
AGENT AGENT Negotiation/Waiting time The measurement of the
negotiation time starts after service discovery has completed, and ends before service usage or service provisioning. For centralized approach, this also comprises the allocation time
AGENT AGENT
Service Provisioning Time The evaluation framework defines the service provisioning time as the service usage time of one transaction (This metric is only taken into account for the prototype, as provision time cannot be fixed. ).
APPLICATION This metric represents the ServiceProvisiongTime, in one transaction (not in one experiment). Stored in metrics_prototype repository. Normally it should happen thatService Provisioning = Service Allocation Time + Job Execution Time
Messaging Infrastructure
Service Allocation Time Negotiating + discovery time MIDDLEWARE negotiation Time.txt + discovery(constant time)
Messaging Infrastructure Job Execution Time The job execution time is defined
as a sum of discovery time,
negotiation time (waiting time in centralized approach), network transfer time and execution time (which is - however - fixed for simulation).
Job execution time = executionTime.txt
sender agent Message transmitter AGENT MESSAGING INFRASTRUCTURE receiver agent Message receiver AGENT MESSAGING
INFRASTRUCTURE hops Distance between the partners in
hops
MIDDLEWARE Constant 1: Mesh topology
MESSAGING INFRASTRUCTURE latency time Distance between the partners in
latency time.
MIDDLEWARE Constant for the cluster measured once
MESSAGING INFRASTRUCTURE Agent id The unique id of the agent. AGENT AGENT
Service Usage The service usage is evaluated by the ratio between the service provisioning time and the total simulation time.
APPLICATION
Calculated in a matlab script per each experiment service provision Time
AGENT Message Size Sum of Message Size for each
transaction
MIDDLEWARE
Constant size for the messages message size in the middleware Calculated once.
MESSAGING INFRASTRUCTURE Number of Messages This value counts the number of
messages. (only the messages related to a negotiation will be count)
AGENT
Count the number of messages in the experiments
MESSAGING INFRASTRUCTURE
Table 4.1 – Metrics alignment at prototype and middleware
5 Relation to other WPs
WP3 deals about the prototype, typically the practical implementation of all the concepts and tools from the rest of WPs. As such, WP3 has strong ties with the rest of WPs. From WP1 it takes the decentralized market design. The catallactic algorithms implemented in the GMM in WP3 follow the specifications from WP1. The scenarios for testing WP3 components have been aligned with those of the simulator from WP2 (cf. section 4.5 in WP3). Finally, all the results extracted from prototype experiments are evaluated using the analysis tools developed in WP4.
5.1 WP1
The objective of WP1 is the conceptual design of market mechanisms for the CATNETS scenario. This includes the design of auctions (denoted as central case) and a decentralized bargaining strategy (denoted as Catallactic case). The catallactic case is implemented as a resource allocation mechanism in the prototype. The results of the implementation of both centralized and decentralized mechanisms in simulator and the decentralized mechanism in
the prototype will demonstrate the applicability and feasibility of the strategies used in the markets.
5.2 WP2
The prototype demonstrate the feasibility of and ALN application based on Catallactic service/resource allocation - the decentralized case, while the simulator implements both centralized and decentralized cases, which permits to run large scale scenarios for extensive comparison of system performance. There are scenarios defined in order to run the experiments of which the results are compared and presented in WP4.
5.3 WP4
The work of WP3 provides as a result parts of the performance measuring infrastructure for the CATNETS prototype used in the measurements made within WP4. The view in WP3 is on implementation related aspects of the prototype for performance measurements, while in WP4 the focus is on the evaluation of the developed prototype in a wider sense, including its feasibility, aspects of generalization, standards used, performance in experiments, and identified limitations, leading as a result to a statement on implementing Catallactic-based resource allocation in application layer networks.
6 Economical model for eNVS
eNVS is a proposed experimental National Visualization Service (eNVS) for the UK e-Science programme [VizNET-LOUGH-0001-060811] .
6.1 Hypothesis
Our working hypothesis is that at present CATNETS has the expressive power to model and inform the establishment of a proposed eNVS. We can examine different case studies to explore this hypothesis under CATNETS.
Main question
How the CATNETS mechanism can be used for creating a price model, which can be applied for eNVS?
6.2 Scenarios
We consider two proposed eNVS scenarios, presented below, and map them to the CATNETS scenarios:
x batch mode
This scenario is about “LOCALITY”, and requires a linear visualization pipeline where all the resources are present at the same location and it can be mapped to the first scenario from CATNETS -- Single Service. The batch mode scenario is presented in Figure 6.1. Symbols “A”, “B” and “C” in Figures 6.1 and 6.2 represent services involved in a workflow.
Figure 6.1 - Batch mode of process execution
x interactive mode
This scenario, presented in Figure 6.2, is about “PERSISTENCY”, and requires distributed resources, which could be based at different locations. It also requires co-allocation of resources; therefore the service will only start if all resources have been reserved in advance. The resources will be released after all the jobs have been completed. After the service is completed, the user may need to re-use some or all of the resources, which leads to several possible feedback actions to occur in this process. This scenario can be mapped to the second scenario from CATNETS – Multiple Service.
Figure 6.2 - Interactive mode of process execution
A B C
One main gap in the existing CATNETS approach has been identified after mapping our visualization scenarios to the application scenarios developed in CATNETS; namely, that the CATNETS service is not interactive during the job execution, therefore it cannot provide currently the required interactivity for some visualization services, e.g. the need to restart the service or to change parameters dynamically. Such capability is essential to support interactive visualization applications, as exemplified through the general area of “computational steering”. In such an approach, visualization is separated geographically from a machine running the analysis or simulation. Any change in simulation parameters causes data to be transferred over the network to the user to be visualized. Such interaction between a visualization and simulation engines cannot be undertaken effectively using a batch mode execution.
6.3 Algorithm for decision making regarding the hypothesis
CATNETS model BEGIN
Define limits of CATNETS, expressive ability and decide how
this can be extended/achieved. Does CATNETS
have the present capability to extend
into the proposed eNVS model?
Yes
Run simulations to show how a range of eNVS services and resources could work and be sustained (say 5 centers plus mix of resources
in batch or interactive mode)
No
Build the required extensions to CATNETS
Refine market metrics with iso latency etc. after the above goal has been achieved
Test results
END
6.4 Hypothesis testing
For the purpose of testing the hypothesis, an example of visualization Web Services, such as Marching Cubes services and the Contour Filter service, developed by G. Shu and N. Avis [Shu07] need to be run on the CATNETS framework and the results visualized. It is very important to determine the difference between these results and the results from the Data Mining example, which is a case study provided in CATNETS.
Shu and Avis [Shu07] present a novel workflow-based approach to the design and implementation of distributed visualization systems in a Grid computing environment. The approach evolves the traditional dataflow visualization system into an environment in which visualization Web Services can be linked with local visualization tools to form a pipeline using workflow technology. A specific aim of our design is to provide a distributed visualization toolkit to fulfil a user’s request for any particular visualization techniques/algorithms, allowing users to select the most appropriate resources, and compose the visualization pipeline.
Each visualization algorithm available in the Visualization Toolkit (VTK)1 was developed into a Web Service. For example, the Web Service “MarchingCubes” is for the algorithm “Marching Cubes”. As Web Services, visualization services are wrapped using WSDL (Web Service Description Language) and SOAP (Simple Object Access Protocol) interfaces and messaging. These visualization services serve to filter data, provided by source, into geometry. For example, the service “ContourFilter” processes data by means of a contour algorithm. It takes as input any dataset and generates on output isosurfaces and/or isolines. These visualization services are developed using ij-VTK, which is a Java wrapper for VTK. Taking the service “ContourFilter”, mentioned above, for instance, it uses vtkPolyDataWriter to write output of vtkContourFilter, which is polygon data, into a binary data file in VTK format, and sends the file as a SOAP message to the client-side application. On the other hand, the client-side application will use vtkPolyDataReader to read the binary polygonal data file in VTK format.
Below is a case study presented as a proof-of-concept demonstrator. The case study shows how the various visualization tools in the Triana workflow system can be used in conjunction with the visualization Web Services to form a visualization workflow. Figure 6.4 illustrates the composition tools provided for the visualizing workspace. On the left hand side, the user is provided with a collection of pre-defined folders containing tools grouped according to function. The tools in the DataInput folder, for example, perform tasks inputting local dataset and remote dataset. On the right hand side, the user is provided with workspace for composing workflows by dragging and dropping the units/tools from the toolboxes. Each tool or unit represents a service with a pre-defined input/output interface. The connection between tools is made by dragging a cable from the output node (right-hand side) of the sending task to the input node (left-hand side) of the receiving task. Once a workflow has been created it can be executed. A Web Service is imported to the workspace by providing its WSDL interface. If the interface is provided, Triana creates a tool for each operation provided by the service. These tools are used to invoke the service operations and are similar to the pre-defined tools but have a different colour in the workspace. The toolbox, which provides additional support for creating a workflow and using the developed visualization Web Services, is in the Visualization folder. A variety of visualization Web Services, such as MarchingCubes, ImageFilter, which are deployed on a Windows platform and registered, at
this moment, in our private UDDI and have been imported into Triana, are shown in the WebServices folder.
The data used in the case study is obtained from [Schroeder03]. It deals with Computed Tomography (CT) data. This study contains 93 such slices, each of which is taken perpendicular to the spine approximately through the middle of the ears, spaced 1.5 mm apart. Each slice has 2562, 0.8 mm pixels with 12 bits of gray level. We build a workflow with two branches, one branch for using algorithm “ContourFilter” to filter data, and the other “MarchingCubes”. Two branches work in parallel in order that we can judge the different rendered results from different algorithms as soon as possible. The workflow first inputs the data set from remote machine by means of tool “RemoteDataSet”, then reads the data set and converts it into the VTK format. In the end, the workflow filters the data set using Web Service “ContourFilter” and “MarchingCubes” respectively and renders them. The test shows that “MarchingCubes” is faster than “ContourFilter”, but the resulting images are almost the same.
Figure 6.4 - A case study for workflow-based distributed visualization
6.5 General observations about CATNETS in regard to the
hypothesis and the main question presented above
CATNETS provides some support for initiating an interactive service, because the user can interact with the services while they run. Initially, the process of negotiation for the resource is an interactive process, where the customer and the resource provider negotiate in interactive mode about the time, the price and the location of the required resources. Once the resource has been allocated to a certain user, the user can start his job in a batch mode, but he can still
interact with the service while the job is running, getting up-to-date information about the state of the job, the estimated time left etc.
The main question is: How much to charge for the service? To be able to answer this question, we need to determine the process parameters, business rules and to calculate the cost of the service based on this data. We will also need to model the business processes in the middle layer of CATNETS, as well as the ones in the Application layer. There is a need for a business model of the Application layer, so we can calculate the cost of the service.
The main parameters of the services in CATNETS are:
1. Number of requests (number of instances you run the application) 2. The delay between each request
3. Budget – as a fixed parameter (should be calculated as a cost) 4. Resource parameter
5. Time (needs to be calculated – how long the user is taking the resource for) 6. The initial cost of the resource
7. Location parameter showing where the resource is located (using MySQL repository on one machine, CAP (Catallactic Access Point) on another machine)
8. Price offered by the application layer – it is fixed currently
There is a request on demand – if a user requires a resource, he sends a request and receives an offer back with the price and the location of the resource. If he agrees to use the resource for this service, he sends his URI back and can start his job. If the user does not accept, he simply does not send anything back.
There is also an archive of metrics, agreement template, agreement offer, module MGS (Master Grid Service) running on the service. The metrics are: service provisioning time (the total time of the process), job execution time and ID of the experiment. Another useful parameter is the Number of basic service nodes.
In Figure 6.5 a possible scenario is presented, when a user requests a service, which can be performed at different locations on distributed resources. The figure shows example services A, B and C, which could represent the Data Input, Contour Filter and Rendering Services within Figure 6.4, respectively. These services have been arranged using quality of service (QoS) criteria, such as a notion of iso-latency, which corresponds to the time to receive a response once a request has been sent to any one of these services. These services have been grouped according to some defined QoS thresholds and as such the price for each service can theoretically depend on QoS metrics.
Figure 6.6 represents the intersection between the batch and the interactive services, united by the CATNETS approach. The J48 data mining example is shown as a batch processing application. This reflects the UK’s National Grid Service (NGS) operation [NGS]. The proposed eNVS is an adjunct to the NGS that must support both batch and interactive services. Therefore, we need to test the market in both ways – for batch and interactive mode – and to estimate which one is more economically efficient from the provider’s point of view.
CATNETS
Figure 6.5. Groupings of services based on QoS criteria
Figure 6.6 - The intersection between Batch and Interactive services
The price estimation in CATNETS depends on the resource price. However, there is a lower bound to this price, this threshold must never be exceeded. This is valid for the batch mode market. The interactive mode has not been incorporated in the existing CATNETS model.
It is possible to view the second scenario (Figure 6.2) as two concurrent CATNETS markets – batch and interactive. CATNETS has the concept of the resource bundle already, which can be refined and used in the case of interactive mode.
C A A B C A B C A B BATCH NGS INTERACTIVE eNVS J48 data mining example
If we consider the second scenario as a portfolio of services, we need to consider Price Risk Management. Another possible solution for the interactive mode could be to use Decentralized Catallactic approach, where the user requests two or three times the time slot, which he would have requested for the batch mode and he does not care about location, time, resource etc.
We have to use the CATNETS scheduler to price these two models – batch and interactive. There is no need to change the scheduler for this purpose.
We can model the services in two different ways and explore the market twice as a batch or interactive service. For this purpose, the Time should be added to the current model as a parameter.
It is also important to be able to determine the number of service instances to support in these two markets (batch and interactive). Market intervention approaches (for instance, promoting interactive services ahead of batch mode services) will be explored to better understand this problem.
6.6 Conclusions and further directions
There are three main things to be done:
1. We need to define a time parameter in the resource.
2. What request you make through CAP (Catallactic Access Point) to SLA (Service Level Agreement) request? – need to change the SLA for the interactive mode.
3. How to price both of these models (batch and interactive) based on the scheduler?
We will conduct further simulation results with a view to informing the incorporation of the CATNETS model into a future eNVS. The outcomes of these studies will be reported by means of presentations, reports and talks. Another expected outcome is a publication in a journal or conference.
7 Conclusions of WP3
7.1 Prototypes using Catallactic-based markets
The implementation of two prototypes with a Catallactic based mechanism, as well as a generalisation of application with the GMM, detailed in WP3 year 2 deliverable and enhanced with more details within this deliverable, have raised interesting conclusions outlined below: x COVITE prototype [COVITE, 2007], [Joita, 2004] supports the creation of Virtual
Organisations (VOs) via a centralised system. All resources and services are allocated by a central authority at the creation of the VO. A decentralized solution, as Cat-COVITE prototype presented above, in which services and resources are to be allocated in peak/busy times to application users / processes is an straightforward way to deal in such demanding situations, while there is no other possibility of adding more resources or the availability of services are limited.
x A second solution, as Cat-Data Mining prototype, has been proposed and developed. The main problem data mining services are addressing is of data that is typically too inconsistent and difficult to understand into such forms that are more compact, useful and understandable. This can be achieved via specific data-mining methods for pattern discovery and extraction. This process can be structured into a discovery pipeline/workflow, involving access, integration and analysis of data from disparate sources, and to use data patterns and models generated through intermediate stages. The GMM addresses the need of such data mining services to be found just-in-time and used by the application services.
x The Catallactic markets expect to provide members of VOs a fair price for services needed by the users’ application.
x The Catallactic markets also expect to provide a fair welfare distribution among the participants, such as users’ application, and service and resource providers.
x The Catallactic mechanism expects to help systems in discovering and selecting resources and services on demand and just in time, as application processes can make use of third parties services or can demand more and more resources.
x Relevant prototype metrics are proposed and a composite index - social utility factor, is being calculated as a single index, so that comparison and evaluation of different scenarios, as well as between prototypes and simulators can be realised. The process of extracting and analysing the results are shown in Deliverable WP4.