Essays on Institutional Investors
Yang Chen
Submitted in partial fulfillment of the Requirements for the degree of
Doctor of Philosophy under the Executive Committee of the Graduate School of Arts and Sciences
COLUMBIA UNIVERSITY 2013
© 2013 Yang Chen All rights reserved
Essays on Institutional Investors Yang Chen
This dissertation analyzes the role of institutional investors in capital markets. The first essay studies what affect mutual fund decisions on hiring and firing sub-advisors and the ex-post effects. We show that deterioration in mutual fund performance or increase in outflows predicts a higher propensity of a fund to change its sub-advisors. However, mutual funds continue to underperform by about 1% in the 18-months after a change in sub-advisor, even after controlling for fund category, past returns and past flows. The continuing underperformance of mutual funds can be attributed to decreasing returns for sub-advisors in deploying their ability as suggested in Berk and Green (2004). The second essay provides empirical analysis on hedge fund exposures to overpriced real estate assets. Consistent with models in which delegated portfolio managers may want to invest in overpriced assets, I find that hedge funds were holding real estate stocks instead of selling short during the period of overpricing (2003Q1-2007Q2). The third essay finds that investor composition affect fund managers’ portfolio choices. Specifically, I show that retail-oriented hedge funds invested more in overpriced real estate assets than institution-oriented hedge funds.
List of Charts, Graphs, Illustrations ... iv
Acknowledgements ... vi
Dedication ... viii
Essay 1. Hiring and Firing Mutual Fund Sub-Advisors ...1
I. Introduction ...2
II. Background ...5
III. Data ...8
A. Data Collection Process ...8
B. Overview of Data...12
IV. Hypotheses ...14
V. Empirical Evidence ...16
A. Hypothesis 1: the effect of performance and flows ...16
B. Hypothesis 2: Decreasing Return of Sub-Advisors ...27
VI. Conclusion ...34
Essay 2. Hedge Fund Equity Holdings in the Real Estate Boom and Bust ....36
I. Introduction ...37
A. Collection of the Data ...42
B. Summary Statistics ...45
IV. Evidence on Overpricing ...46
A. Controversial Views ...47
B. Evidence from REITs ...48
V. Empirical Evidence ...53
A. Overview ...53
B. Return Regressions ...55
C. Time Pattern of Exposures ...60
VI. Conclusion ...62
Essay 3. Investor Composition and Hedge Fund Portfolio Allocation ...63
I. Introduction ...64
II. Hypothesis ...68
III. Data Collection ...70
IV. Empirical Evidence ...72
A. Overview ...72
B. Regression ...73
C. Technology Sample ...77
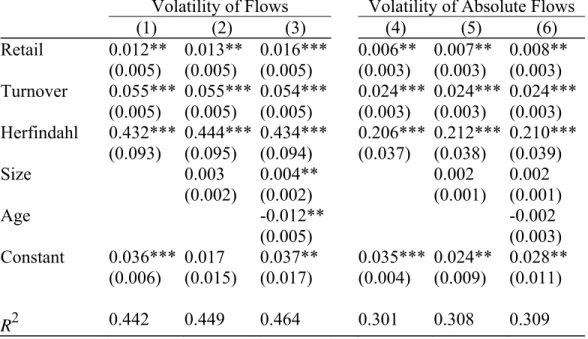
B. Flow Volatility ...83
VI. Conclusion ...85
Figures and Tables ...87
I. Figures ...87 A. Essay 1 ...87 B. Essay 2 ...93 C. Essay 3 ...97 II. Tables ...99 A. Essay 1 ...99 B. Essay 2 ...121 C. Essay 3 ...125 References ...129
Essay 1: Hiring and Firing Mutual Fund Sub-advisors
List of Figures
Sub-Advisor Change Timeline
Effects of Past Performance on Sub-advisor Change: A Semiparametric Analysis Sub-Advisor Average Excess Return by Time around Hiring
Sub-Advisor Average Excess Return by Time around Firing
Mutual Fund Average Excess Return by Time around Sub-Advisor Change List of Tables
Variable Definitions and Summary Statistics Overview of Sub-advisor Changes
Percentage of Mutual Funds with Sub-Advisor Change: Double Sorted by Past Performance and Flow
Effects of Fund Prior Performance on Sub-advisor Change Effects of Prior Flows on Sub-advisor Change
Effects of Interaction of Past Performance and Flow on Sub-advisor Change Investor Unawareness of Sub-Advisor Change
Sub-Advisor Cumulative Excess Return around Hiring and Firing Events Effects of Size on Sub-advisor Performance
Effects of Size on Sub-advisor Performance: Equity Sub-advisor Only Mutual Fund Performance and Expense Ratio around Sub-Advisor Change Mutual Fund Performance and Expense Ratio around Sub-Advisor Change: Double Sorted Benchmarks
Essay 2: Hedge Fund Equity Holdings in the Real Estate Boom and Bust
List of Figures
Returns on REITs and S&P 500 Indexes
EV/EBITDA Ratio of REITs and NYSE Stocks
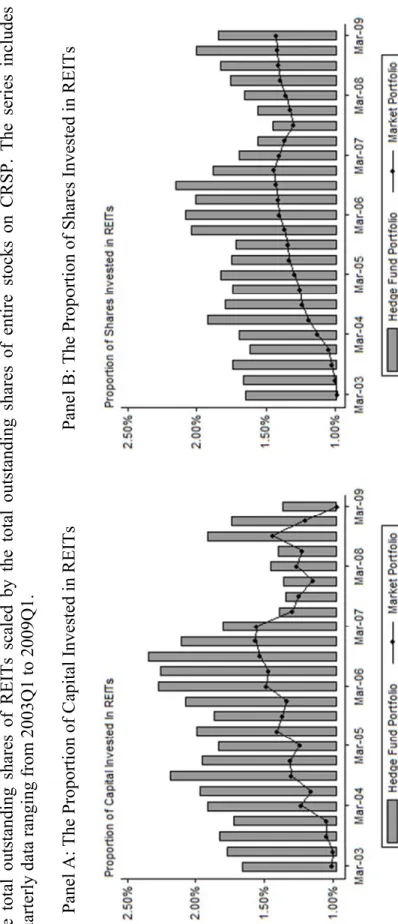
Aggregate Weight of REITs in Hedge Fund Portfolio and Market Portfolio Exposure of Hedge Funds to the Real Estate Sector: Smoothed Kalman Filter Estimates
Essay 3: Investor Composition and Hedge Fund Portfolio Allocation
List of Figures
Percentiles of Weights: Retail-Oriented Funds v.s. Institution-Oriented Funds Returns on Nasdaq by Price/Sales Quintile, 1998-2002
List of Tables
Effects of Investor Composition on Investment Effects of Investor Composition: Technology Sample
Effects of Investor Composition on Flow-Performance Sensitivity Effects of Investor Composition on Flow Volatility
I could not have completed this dissertation without the help from many people along the way. I am indebted to all these people who provided their support throughout my years at Columbia University and because of whom my graduate experience has been one that I will cherish forever.
First of all, I would like to express my deepest gratitude to Professor Wei Jiang, my sponsor and advisor, for her incisive guidance, supervision and encouragement. She taught me to observe, to think, and to improve. She set a great example for me to learn how to be professional, proactive and polite. I would also like to thank her for introducing me to the field of mutual funds and hedge funds and kindly sharing the hedge fund list with me. Her patience and support helped me overcome many crisis situations and finish this dissertation. I have been extremely lucky to have her as my advisor. I hope that one day I would become as good a mentor as she has been to me.
I am also very grateful to Professors Gur Huberman, Robert Hodrick, Paul Tetlock, and Fabrizio Ferri, who together make up my dissertation committee, for their constructive comments and suggestions, all of which have greatly helped improve the content and quality of this dissertation. Their deep thoughts and
putting it in better form.
I am indebted to Prof. Charles Jones, who guided me to the Ph.D. program and opened a brand new door to me.
My sincerest gratitude goes to Kevin Ng of Strategic Insight, who devoted his valuable time to share with me industry knowledge and provide helpful comments. I also thank Strategic Insight for the provision of data.
Many friends have helped me stay sane through these difficult years. Their support and care helped me overcome setbacks and stay focused on my graduate study. I greatly value their friendship and I deeply appreciate their belief in me.
Most importantly, none of this would have been possible without the love and patience of my family. My immediate family, to whom this dissertation is dedicated to, has been a constant source of love, concern, support and strength all these years. I would like to express my heart-felt gratitude to my family. My extended family has aided and encouraged me throughout this endeavor.
This dissertation is dedicated to the following people:
My husband, Dennis, who has been accompanying me going through the tide waves of life and encouraging me to pursue my professional career.
My son, Regis, who has grown into a happy little young man despite that his mother spent so much time away from him working on this dissertation.
Hiring and Firing Mutual Fund Sub-Advisors
Yang Chen
Columbia Business School Hongbo Zhou Strategic Insight Abstract
Using a comprehensive database of mutual funds and monthly sub-advisor information from 2006 to 2012, we document several interesting empirical regularities of mutual funds and their sub-advisors around the event of an active sub-advisor change. First, deterioration in mutual fund performance or increase in outflows predicts a higher propensity of a fund to change its sub-advisors. Second, mutual funds chase past performance of sub-advisors. Third, mutual funds continue to underperform by about 1% in the 18-months after a change in sub-advisor, even after controlling for fund category, past returns and past flows. We show that the continuing underperformance of mutual funds can be attributed to decreasing returns for sub-advisors in deploying their ability as suggested in Berk and Green (2004).
We thank Fabrizio Ferri, Vyacheslav Fos, Laurie Hodrick, Robert Hodrick, Gur Huberman, Wei Jiang, Kevin Ng and Paul Tetlock for very helpful comments and discussions. We also thank Kenneth Beitler, Kevin Ng and Chris Yeomans for sharing industry knowledge with us. The views presented in this paper are those of the authors and do not necessarily reflect those of Columbia Business School and Strategic Insight. All errors are our own.
I.
Introduction
Certain mutual funds outsource their investment management function to an outside firm. These funds are generally known as sub-advised funds and their investment managers are referred as advisors. The market share of sub-advised assets was quite stable over the past decade although mutual fund industry experienced extraordinary growth. In December 2001, sub-advised mutual fund assets (including underlying variable annuities) were $835 billion, representing 11% of assets in mutual fund industry1. As of December 2011, sub-advised assets were $1,489 Billion, or about 12% of the industry.
Why do certain mutual funds enter into outsourcing contracts with sub-advisors? Del Guercio, Reuter and Tkac (2007) suggest that these contracts must be beneficial to both parties. They argue that one of the benefits for mutual funds comes from cost efficiencies. When mutual funds want to expand their line of products in which they do not have expertise, the cost could be lower if they hire a sub-advisor who is already in place providing these products. The costs might be also lower for some mutual funds if they have geographic limitations to retain in-house talented portfolio managers. The other benefit is that mutual funds can increase demand for their services if sub-advisors provide high quality products and well recognized brand names. For sub-advisors, an obvious benefit is that
1 2012 Sub-advisory Study, Strategic Insight. The numbers are consistent with the report published by the Investment Company Institute http://www.idc.org/pdf/idc_10_subadvisors.pdf.
they get paid by providing sub-advisory services. A less obvious benefit is that mutual funds and sub-advisors may well be non-competitors if they differ in distribution channels. Sub-advisors may get access to a large pool of investors that they previously couldn’t.
Despite these theories, there is empirical evidence that suggests the non-optimality of these outsourcing contracts. For instance, Chen, Hong and Kubik (2011) show that outsourced mutual funds underperform funds that ran internally by between 50 and 72 basis points a year. They attribute this phenomenon to contractual externalities due to firm boundaries, i.e., outsourced funds face steeper sensitivity of fund closures to past performance or excess risk taking, thus they take less risk in response.
In this paper, we study mutual funds and their sub-advisors around the event of a sub-advisor change and try to address the following specific questions. First, what affects the hiring and firing decisions of a mutual fund regarding its sub-advisors? Second, how does mutual fund performance change after a sub-advisor change? Third, what causes the change in mutual fund performance?
Answering these questions is important for the following reasons. First, sub-advisors are motivated to expand their businesses given capacity. On one hand, knowing what criteria mutual funds apply to filter advisors is helpful for
sub-
advisors to expand their size; on the other hand, is it true that the bigger the size of sub-advisors the better?
Second, mutual funds are interested in knowing whether their decisions of hiring and firing sub-advisors are effective. Our study serves this need by providing empirical evidence on the ex-post effect of sub-advisor change on mutual funds and their investors. This would potentially help them making more sound hiring and firing decisions regarding sub-advisors.
Third, investors have been questioning who deliver mutual fund performance. They tend to attribute most of fund performance to portfolio managers rather than funds. Benefited from the fact that managers and funds are separated by construction in our paper, we are able to evaluate whether mutual funds add value by removing bad managers and picking better ones.
We hypothesize that in addition to past performance, there is also an inverse relation between mutual fund past flows and the propensity of changing a sub-advisor. We also hypothesize that there are decreasing returns for sub-advisors in deploying their ability, which causes the continuing underperformance of mutual funds who change sub-advisors.
This paper contributes to the literature as follows. First, flow-performance sensitivity has gained much attention in the literature. Different from previous
literature that mainly study the impact of flows from retail investors on investment managers such as hedge funds and mutual funds, we analyze this question from a different and quite new angle, i.e., the impact of flows from institutional investors (mutual funds) on the performance of sub-advisors. We find that consistent with Berk and Green (2004), mutual funds chase sub-advisor performance and make rational use of information about sub-advisors’ histories in doing so. To the best of our knowledge, our paper is the first to test Berk and Green (2004) using institutional flows. Second, our paper shows that there are decreasing returns to scale for sub-advisors, which explains the non-persistent performances in sub-advisors and mutual funds. Third, our analysis also distinguishes from the existing literature that focuses on the relationship of sub-advisor departure and mutual fund performance and flow (e.g., Kostovetsky and Warner (2011)).
II.
Background
A mutual fund, as defined in Tufano and Sevick (1997), is a legal entity with no employees to which investors allocate their portfolio decision rights. The fund, in turn, delegates all aspects of fund operation, including portfolio management, to an advisor. While it is true that the fund notionally “hires” the advisor, in practice it is the advisor who typically creates the fund in the first place. While the
advisor may keep the portfolio decision rights to itself, it may also choose to allocate portfolio decision rights to an independent third party (i.e., sub-advisor).
In a typical outsourcing agreement, a mutual fund usually retains the marketing and distribution fees while the sub-advisor obtains the management fees. Chen, Hong and Kubik (2006) document that “Like for any of its funds, the family of an outsourced fund, through a board of directors, keeps track of its performance and monitors fund activities such as the fund’s risk-taking behavior relative to its peers. The advisor retains the ability to replace the sub-advisor or close down the fund, while the sub-advisor can manage outsourced funds for other advisors as well as funds they market themselves (in-house funds).” Big names of mutual fund companies include Vanguard, John Hancock, Fidelity, etc.; and large sub-advisors include Wellington, Pimco, AllianceBernstein, etc.
Generally, investment companies (“funds”) are required to file Form 497 (definitive materials) to the U.S. Securities and Exchange Commission (SEC) and report the names of their sub-advisors as well as sub-advisor changes, in accordance with Rule 497 of the Securities Exchange Act of 1933. However, according to Rule 15a-5 under the Investment Company Act of 1940, an investment company is permitted to hire and discharge sub-advisors without a
shareholder vote in most cases. As a result, mutual fund investors are usually not aware of the existence of a sub-advisor or its change2.
The departure of a sub-advisor is usually involuntary and often due to underperformance. Friction cost for mutual funds in moving portfolio may take 2%-5% of TNA (Proszek (2002), Bollen (2004) and Werner (2001)). As a result, in performance-based termination, funds would only be willing to incur the costs if their performances are expected to improve. For instance, in a recent filing to the SEC, AdvisorShares, an investment advisor announced a change in the sub-advisor for the Mars Hill Global Relative Value ETF. Noah Hamman, the CEO of AdvisorShares commented the following: “This change will bring an expert in global asset management to a product that has fallen short in performance relative to its peers. After reviewing the performance with the current sub-advisor, it was concluded that a change was in the best interest of shareholders.”3
While performance is an important factor in determining a sub-advisor change, hiring and firing a sub-advisor usually involves both quantitative and qualitative
2 We show that investors are unaware of sub-advisor changes in Table 6 of this paper. 3 For more detail, please refer to:
http://www.benzinga.com/pressreleases/11/11/n2141826/advisorshares-announces-change-in-sub-advisor-to-the-mars-hill-global-r
factors. According to a report by Strategic Insight4, quantitative factors include: performance, tracking record; qualitative factors include: investment process, knowledge and skills, history, the assets of the firm overall, and within the strategy that needs to be outsourced, whether the firms are already near capacity for particular investment categories, how different managers work together, if the fund is multi-subadvised, prior experience with the fund, brand, reciprocal distribution, marketing and sales support, etc.
III.
Data
A. Data Collection Process
We acquire a proprietary dataset from Strategic Insight, which includes monthly sub-advisor information for U.S. mutual funds from December 2006 to September 2012. The dataset covers 3622 unique mutual funds that are ever sub-advised during this period and 1112 unique sub-advisors. Since dead funds are not removed from the records after liquidation, our proprietary dataset is free of survivorship bias. Specifically, the dataset includes for each mutual fund in each month end, its sub-advisor names and their respective mandate assets with the fund. The dataset also includes a tag which indicates whether a sub-advisor is affiliated with the fund on a monthly basis (by affiliation we mean that the fund
4 “Windows Into the Mutual Fund Industry: February 2006”, Strategic Insight.
http://www.sionline.com/Security/login.aspx?ReturnUrl=%2fresearch%2fsubscriber_windows%2f 520.pdf
owns the sub-advisor or the fund and the sub-advisor have a common owner). This dataset allows us to identify 1871 active sub-advisor changes involving 1219 unique mutual funds and 842 unique sub-advisors during the period. Note that active sub-advisor changes refer to the situations when a fund fires, hires, or hires and fires at least one sub-advisor and excludes passive changes including liquidation, merger and new funds.
The proprietary dataset is then supplemented with monthly mutual fund information obtained from the Center for Research in Security Prices (CRSP), available through WRDS. CRSP provides mutual fund information at the share class level5. Given that our analysis is at the fund level, we aggregate share classes into a mutual fund by their CRSP Portfolio Number. Then, fund size is calculated as the sum of assets under management of all its share classes. We define fund age as the number of years since the inception of the most tenured share class within that fund. Fund return is calculated as the value weighted return of all its share classes.
We manually match the funds from our proprietary dataset with CRSP Mutual Funds database by name. We are able to match 3,214 mutual funds. However, there are 408 mutual funds that exist in our proprietary dataset but are not covered by CRSP Mutual Funds database. The main reason is that CRSP does not cover
5 The labels are slightly different in CRSP. In CRSP, share class is labeled as fund and mutual fund is labeled as portfolio.
closed-end funds, such as Aberdeen Emerging Markets Telecommunications and Infrastructure Fund (live since 1992) and 40/86 Series Balanced (dead fund). The other reason is that although we can find a match in these two datasets, all other relevant information over the fund’s history is missing on CRSP. An example is AZL AIM Basic Value Fund. We exclude such funds. Conversations with CRSP representatives suggest that such missing records seem to be random. In all, we believe our merged database remains free of survivorship bias.
The most salient feature of the combined dataset is that it allows us to analyze sub-advisor level performance change, rather than limited to fund level. Specifically, since we observe monthly mandate assets for each pair of fund and sub-advisor, we are able to estimate monthly performance of a sub-advisor as the value weighted average of performance of mutual funds that it sub-advises. Here we assume that fund performance gives a proper estimation on how each sub-advisor is doing with the fund. This assumption definitely holds for single-subadvised funds and their sub-advisors. But for multi-single-subadvised funds, our assumption may cloud the analysis if there is a remarkable difference in sub-advisor performances in the same fund and such difference is systematic. To address this issue, we further test our hypothesis by using the sample of sub-advisors served as the single mandate for a fund and compare the results with that of full sample.
Certainly, readers may raise two additional concerns about our estimation. First, some sub-advisors may well have in-house businesses and our estimation of these sub-advisor performances does not reflect their non-subadvisory businesses. This is not a problem because we are interested in knowing the sensitivity of advisor performance to fund inflows and withdrawals. It is exactly the sub-advisory business that we want to evaluate. Second, what about a sub-advisor that serves funds with different styles (e.g., large growth and small blend) at the same time? Given that one of our measurements for mutual fund performance is its excess return relative to its Lipper Category, the performance of such sub-advisor will then be compared to a hypothetical sub-advisor who has the same portfolio allocation and delivers “average” returns.
A point worth noting is the definition of “date zero” (sub-advisor change date) used in this paper. For this, we provide a timeline of sub-advisor change in Figure 1. Throughout the paper, “date zero” is the effective date of sub-advisor change on file, or more accurately, the month end of effective date since we conduct all the analyses on a monthly basis. It is true that a decision date (on which a firing decision is made) or a “considering” date is more relevant, if the question is “how past poor performance is causing a firing decision”. However, this date is unobservable. We may assume that in common cases, this date is about two months before the effective date. The effective date is more relevant, if the
question is “how institutional flows are affecting sub-advisor performance”. This is because asset transition usually takes place around the effective date.
B. Overview of Data
The definitions and summary statistics of the main variables are reported in Table 1. The average age of mutual fund in our sample is 7.8 years. The average fund sub-advisor change (expected probability of mutual fund sub-advisor change) is 1.06%. Following the standard practice in mutual fund literature, we measure the monthly mutual fund flow as the current month net flow of a fund as percentage of last month’s total net assets managed by the fund. The monthly average flow of mutual funds during the 6 months prior to a sub-advisor change is 1.01% and the median number is -0.23%. The average monthly mutual fund return in excess of its Lipper category 6 months prior to a subadvisor change is -0.03% and the median number is -0.01%. The size of mutual funds in our sample is positively skewed: the average number is $932.7 million and the median number is $189.4 million.
Table 2 provides an overview of sub-advisor changes. Panel A shows that the merged dataset includes 1812 changes in sub-advisor from December 2006 to September 2012, among which 1534 are active. The total assets of sub-advisor changes exceed $1232 billion, among which $1129 billion are associated with
active changes. Since passive changes are irrelevant for the purpose of our analysis, we will focus on active changes only in the rest of the paper.
Panel B of Table 2 presents the number of active sub-advisor changes in each year-performance category as a percentage of the number of sub-advised funds in that category. For instance, among sub-advised funds with negative past one year excess return relative to category in 2007, the number of active changes accounts for 13.7%. Notice that the numbers in 2006 and 2012 are much smaller than other years, because for 2006 we only have observations in December, and for 2012, we only have data from January to September.
Two patterns are noteworthy. First, the numbers in the left column are larger than the numbers in the right column. This suggests that funds with one-year poor performance (relative to category) tend to have more sub-advisor changes in the subsequent year. Second, the numbers in the right column are more or less stable while the numbers in the left column are not; indicating that besides underperformance, other reasons could also explain sub-advisor changes.
Panel C of Table 2 compares the composition of funds that have active sub-advisor changes and funds that are sub-advised. We classify funds by their structure, sub-advisor change type and size respectively. For instance, among funds that have active sub-advisor changes, 75.3% (24.7%) are multi-managed (single-managed) funds, while among funds that are sub-advised, 70.3% (29.7%)
are multi-managed (single-managed). An important message from this panel is that funds that have active sub-advisor changes are not biased towards a particular type of sub-advised funds.
IV.
Hypotheses
Hypothesis 1: There is an inverse relation between fund past performance and the propensity of a mutual fund changing its sub-advisor, controlling for past flows. The inverse relationship should also hold between fund past outflows and the propensity of a mutual fund changing its sub-advisor, controlling for past performance.
Our hypothesis is in the spirit of Khorana (1996), who documents that the probability of managerial change and the past performance of the fund is negatively correlated given internal and external monitoring. Intuitively, this relationship is due to the monitoring effects of board of directors. Fund outflows could be another factor for board of directors to monitor. Thus, when mutual fund performance is worsening, or when mutual funds experience more outflows, the probability that the board of directors changes mutual fund sub-advisors should increase.
Hypothesis 2: There are decreasing returns for sub-advisors in deploying their superior ability.
This hypothesis follows the seminal paper of Berk and Green (2004), which suggests that “there is differential ability to generate high average returns across managers, but due to decreasing returns for managers in deploying their superior ability, new money flows to the fund to the point at which expected excess returns going forward are competitive (page 1271)”. Since mutual funds make their hiring and firing decisions based on sub-advisor past information, inefficiency may arise when the size of a sub-advisor exceeds it optimal level.
We develop three implications based on this hypothesis:
1. A Sub-advisor newly hired by a mutual fund (presumably because it performed relatively well before the hiring) gets more assets and delivers less attractive returns afterwards.
2. A Sub-advisor newly fired by a mutual fund (presumably because it performed relatively poor before the firing) gets less assets and delivers better returns afterwards.
3. A mutual fund with a sub-advisor change continues to underperform its peers.
V.
Empirical Evidence
A. Hypothesis 1: the effect of performance and flows
A.1. Overview
Our first hypothesis is that, when there is deterioration in fund performance or a decrease in fund flows, the probability of changing mutual fund sub-advisor increases, due to the monitoring effects of mutual fund board of directors. The hypothesis implies that as fund performance or fund flow decreases, the percentage of funds that have sub-advisor changes should increase accordingly.
In this section, we show that the percentage of funds with sub-advisor change decreases in mutual fund performance and fund flows. We start by calculating past 12 month excess return relative to category (RetExCat[-12,-1]) and past 12 month flow (Flow[-12,-1]) for each fund in each month during the sample period. Then we sort them into five quintiles respectively, with 1 being the bottom quintile and 5 being the top quintile. For each pair of return and flow quintile, we calculate the number of funds that have sub-advisor changes as a percentage of the total number of funds in each month. Table 3 presents the percentage of mutual funds with sub-advisor change averaged across all the months for each pair of return and flow quintile. The 5-1 differences in the numbers are tested and presented in the table as well.
Table 3 shows that when past 12 month flow quintile of mutual funds is controlled, the percentage of mutual funds changing sub-advisors decreases as past 12 month return quintile increases. For instance, for mutual funds in the bottom flow quintile (funds that experience most outflows), 1.66% have sub-advisor changes if they are in the bottom performance quintile and only 0.86% have sub-advisor changes if they are in the top performance quintile. The 5-1 differences are significant at less than 5% level for all flow quintiles. When past 12 month return quintile is controlled, the percentage of mutual funds with sub-advisor changes decreases in flow quintile. But the 5-1 differences are only significant when returns are in the 1st, 2nd and 4th quintiles. The evidence suggests that when mutual fund past performance is mediocre or very good compared to its category, the likelihood of a fund changing its sub-advisor does not seem to vary much with whether the fund experience inflows or outflows.
A.2. Semiparametric Analysis
In this subsection, we show that the relation between the probability of changing a sub-advisor and fund past performance is somewhat linear. We use a semiparametric approach, in which the relation between the probability of a sub-advisor change and performance is not restricted to be linear, to provide a diagnostic analysis of the change-to-performance sensitivity. This analysis is
important as the relation between change and performance might be nonlinear, similar to the widely documented nonlinearity in flow-performance sensitivity.
Figure 2 shows the results of the semiparametric analysis. In the figure, the vertical axis is the probability of a mutual fund changing a sub-advisor in month t ( , 1 ) and the horizontal axis is the fund’s past return performance, measured by the monthly excess return relative to benchmark averaged over months t-6 to t-1 ( , , ).
Figure 2 plots the change-to-performance sensitivity as estimated by the following equations:
, 1| ,
exp ,
1 exp , (1)
, , , , , (2)
Note that in Equation (2) we have a semiparametric specification and Control is a vector of control variables that include fund size (Size, in log million dollars), fund age (Age, years since inception, in logs) and past flows ( , , ). The estimation of Equation (2) applies the method introduced by Robinson (1988) and used by Chevalier and Ellison (1997), Chen, Goldstein and Jiang (2010) in the study of flow-performance sensitivity.
The solid line in Figure 2 represents the plot of , 1| , and the corresponding dotted lines represent the 90% confidence intervals. Figure 2 shows that there is a quite good linear relationship between the probability of changing a sub-advisor and past performance. Meanwhile, even for funds that outperform their peers by 2% per month, the probability of changing a sub-advisor is somewhere between 0.60% and 0.72%, indicating that (under)performance is not the only factor that affects sub-advisor change. In the next subsection, we move to a regression analysis that allows us to conduct proper tests of statistical significance.
A.3. Regression Analysis
A.3.1. Effect of Performance
For a summary estimate of the effect of mutual fund past performance on changes in sub-advisors, we conduct the following probit regression at the fund-month level and report the results in Table 4:
Pr Change, α β RetExCat, , γ Poor, ,
In Equation (3), Change equals one if there is a sub-advisor change in mutual fund, and zero otherwise. , , is the monthly average excess return relative to category of the mutual fund during 1, 2 period. , , equals one if , , is negative and zero otherwise. The coefficient of
, , captures the difference in the probability of changing a sub-advisor, when mutual fund past performance changes from slightly positive to slightly negative. The interaction term of , , and , , enters the model to test whether poorly performed funds have a different sensitivity of sub-advisor change to performance. Control variables (Control) include fund past flows (Flow[t-k-5,t-k]), an indicator of whether past flows are negative (Out[t-k-5,t-k]), the interaction of the two, as well as size of the fund in log million dollars (Size) and fund age in log years (Age). We also include time dummies in the regression to control for the variation over time in sub-advisor changes. Hence, if there is a special time that mutual funds tend to change their sub-advisors together, it will be captured by the time dummies. To compute the standard errors, we assume that the residuals are independent across different funds, but allow for correlation over time within a fund.
The evidence confirms our hypothesis: there is an inverse relation between fund performance in the past 2 years and the probability of changing a sub-advisor. Moreover, the sensitivity of sub-advisor change to performance exhibits
quite good linearity, i.e., the change-to-performance sensitivities are quite similar in the positive performance region (RetExCat>0) and negative performance region (RetExCat<0).
Given that we estimate the effect in a probit regression, one needs to calculate the marginal effect of an explanatory variable on Pr(Y=1). For instance, to measure how one standard deviation decrease in RetExCat[-6,-1] (excess return during the previous 6 months) from its mean affects the likelihood of sub-advisor change, we can first compute Pr(Y=1)=Φ(Xβ) with all independent variables evaluated at their means. Then we re-compute Pr(Y=1)=Φ(X*β), with RetExCat[-6,-1] evaluated at its mean minus standard deviation, and all other variables evaluated at their means. The difference in the two probabilities is the impact of a standard deviation decrease in RetExCat[-6,-1] from its mean when all other independent variables are held at their means.
The regression coefficients imply that, when RetExCat[-6,-1] decreases by one standard deviation from its mean of -0.03% to -0.81%, the probability of triggering a sub-advisor change increases by 33% (from 0.98% to 1.30%). This result is consistent with the evidence in Table 3.
Another interesting finding is the effect of fund size (Size) on the probability of changing a sub-advisor. Presumably, fund size could have effects that offset each other on the probability of sub-advisor change: on one hand, a large fund
might be more structured and maintains a long-term relationship with its sub-advisor; therefore, it is less likely to change its sub-advisor. On the other hand, a large fund might be more aggressive in sub-advisor changes because it has more resources.
The regression estimate suggests that, when fund size increases one standard deviation from its mean, the probability of changing a sub-advisor increases by 13% (from 1.05% to 1.19%) and is significant. The result indicates that generally speaking, a large fund tends to be more aggressive in changing a sub-advisor.
A.3.2. Effect of Flows
Following the previous section, we controll for fund past performances and estimate of the effect of mutual fund past flows on changes in sub-advisors. We use the following probit regression at the fund -month level and report the results in Table 5:
Pr Change, α β Flow, , γ Out, ,
δ Flow, , ∙ Out, , Control, ε, (4)
In this equation, , , is the monthly average flow to the mutual fund during [t1,t2] period and that , , is an indicator of fund outflows, which equals one if , , is negative and zero otherwise. Control variables
(Control) include fund past performance (RetExCat[t-k-5, t-k]), an indicator of whether the past performance is negative (Poor[t-k-5, t-k]), the interaction term, as well as fund size (Size) and fund age (Age). We also include time dummies in the regression to control for the variation over time in sub-advisor changes. To compute the standard errors, we assume that the residuals are independent across different funds, but allow for correlation over time within a fund.
Table 5 suggests that there is an inverse relation between fund past 6 month flow when flow is negative and the probability of changing a sub-advisor (-1.66 to -1.82). In other words, sub-advisors are more likely to be replaced if there is increasing outflows in the mutual fund. This can be attributed to the monitoring effect of board of directors in mutual funds. For example, if board of directors finds that the asset class or investment strategy that the sub-advisor specializes in starts to lose attractiveness among investors, it will tend to replace the sub-advisor. When flow is positive, the inverse relation is not significant. This indicates that the sensitivity of sub-advisor change to fund flow is convex. However, the inverse relation is insignificant when we consider longer term fund flows. Since the estimates for control variables are similar to those reported in Table 4, we do not report them here for the sake of space.
We now quantify the marginal effect of fund past 6 month flow on the probability of changing a sub-advisor. We find that when fund flow decreases by
one standard deviation from its mean of 1.01% to -5.31%, the probability of changing a sub-advisor increases by 14% (from 0.94% to 1.07%). Recall that the probability of sub-advisor change increases by 33% when performance decrease by one standard deviation from its mean, this result shows that the effect of flow on sub-advisor change is relatively smaller compared to the effect of performance.
A.3.3. Effect of Interaction of Performance and Flows
It could be possible that when performance and flows interact with each other, the effect on sub-advisor change becomes different and thus clouds our analysis on the effect of performance or flows on sub-advisor change. We estimate the following model and test this possibility in Table 6.
Pr Change, α β RetExCat, , γ Flow, ,
δ RetExCat, , ∙ Flow, , Control, ε, (5)
In all estimations, the coefficients on the interaction term of past excess returns and flows are insignificant. The results suggest that the effect of past performance on sub-advisor change does not change in past flows. By the same token, the effect of past flows on sub-advisor change does not change in past performance. The table also confirms our previous finding that past fund performance negatively predicts sub-advisor change.
A.4. Investor Unawareness
In this section, we test investor awareness of sub-advisor changes. Since a mutual fund can hire or fire sub-advisors without a shareholder vote in most cases, the common view is that investors are unaware of sub-advisor changes. If this holds, fund flows should not respond to changes in sub-advisor. We test this prediction in the following regression at the fund-month level and present the results in Table 7:
Flow, α βChange, γControl, ε, (6)
In the equation, , is mutual fund flow, , is a dummy variable that equals one if there is a sub-advisor change in the fund and zero otherwise. We use contemporaneous observations of the two variables because when sub-advisor changes take place, such information is immediately disclosed and is available to be viewed on the SEC website.
Control variables (Control) include average fund flow during the past 1 to 6 months 6,-1]), average fund flow during the past 7 to 12 months (Flow[-12,-7]), average excess return during the past 1 to 6 months (RetExCat[-6,-1]), average excess return during the past 7 to 12 months (RetExCat[-12,-7]), fund size in log million dollars (Size), fund age in log years (Age) and fund expense ratio (ExpRatio). We control for fund past flows and returns as well as age
because these variables are associated with sub-advisor changes, as shown in the previous section. We also control for fund expense ratio because presumably, an increase in expense ratio predicts a decrease in fund flows. We include time dummies in the regression to control for the variation over time in flows. To compute the standard errors, we assume that the residuals are independent across different funds, but allow for correlation over time within a fund.
Table 7 presents the results for all funds (equity funds, fixed income funds and mix, etc.) and for equity funds only. With all observations being included, Column (1) and (4) show that the sensitivity of flow to change in sub-advisor, captured by the coefficient of Change, is insignificant. This indicates that fund flows do not seem to respond to sub-advisor changes.
We now distinguish two possible rationales consistent with the previous findings. One potential rationale is that investors are unaware of a sub-advisor change; the other is that investors are actually aware of a sub-advisor change but simply decide not to respond to it. We argue that should investors be aware of a sub-advisor change, they are unlikely not to respond to it if the fund has been underperforming for a relatively long term. In other words, if investors do not to react to a sub-advisor change when fund past performance is poor, it’s very likely that they are unaware of the change.
To test this, we estimate the regression coefficients using a sub-sample of negative average excess returns during the past 6 months (RetExCat[-6,-1]<0), and a sub-sample of negative average excess returns during the past two consecutive half years (RetExCat[-6,-1]<0 & RetExCat[-12,-7]<0)). In Table 7, the results in Column (2), (3), (5) and (6) (obtained for the sub-samples of negative past performance) are very similar to those in Column (1) and (4) (obtained for the whole samples). This shows that even investors of poorly performed funds do not respond to a sub-advisor change, indicating that investor are probably unaware of it.
B. Hypothesis 2: Decreasing Return of Sub-Advisors
So far, we analyze the factors that affect the probability of having an active sub-advisor change for mutual funds. Are these changes effective ex-post? Berk and Green (2004) suggest that there are decreasing returns for managers in deploying their superior ability. If this hypothesis holds for sub-advisors, mutual funds may well remain to underperform their peers. We test the hypothesis and its implications in this section.
B.1. Overview
If there are decreasing returns for sub-advisors in deploying their superior ability, new money flows to a sub-advisor to the point at which expected excess return going forward is competitive. Since mutual funds make rational use of
sub-
advisor past information, they hire sub-advisors that are past winners and fire those that are past losers. Inefficiency may arise when the size of a sub-advisor exceeds it optimal capacity.
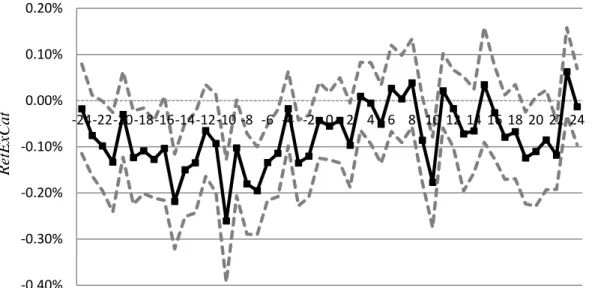
Figure 3 presents the monthly average excess return of sub-advisors relative to their perspective categories around the hiring. Consistent with Prediction 1, the figure shows that sub-advisor excess return tends to decrease after it is hired by a mutual fund.
Figure 4 presents the monthly average excess return of sub-advisors relative to their perspective categories around the firing. The figure shows that before a sub-advisor is fired, its monthly excess return is negative and significant. The performance of the sub-advisor, however, improves after the firing. The evidence is consistent with Prediction 2.
Table 8 quantifies sub-advisor cumulative excess return around the hiring and firing events. Column (1) shows that when sub-advisor category is controlled, a newly hired sub-advisor significantly underperforms its category by 0.98% in the following 18 months after being hired. Before the hiring decision is made, the performance of the sub-advisor is comparative to its peers. Column (3) shows that a newly fired sub-advisor performed relatively well compared to its Lipper category in the following 18 months after being fired. This newly fired sub-advisor, however, significantly underperforms its peers by 2.00% before the firing
decision is made. Column (2) and (4) show that, when sub-advisor category, past performance and flows are all controlled, a sub-advisor significantly underperforms its peers by 0.45% in the following 18 months after being hired, a sub-advisor performs relatively well with its peers in the following 18 months after being fired. We argue that the improvement in performance of fired sub-advisor is unlikely driven by mean reversion because Column (4) essentially serves as a placebo test.
B.2. Regression Analysis
In this section, we directly test Hypothesis 2: there are decreasing returns for sub-advisors in deploying their superior abilities. For each sub-advisor, we calculate two measures to capture its size: the mandate assets in million dollars (Assets), and the mandate number of funds (Counts).
We test the hypothesis in the following model:
RetExCat, α βSize, Control, ε, (7)
In the equation, control variables (Control) include sub-advisor return in excess of the category in the end of last month (RetExCat(-1)), the value weighted Affiliation score a sub-advisor gets from all of its mandated mutual funds (Affiliation), the value weighted Index score a sub-advisor gets from all of its mandated mutual funds (Index), the value weighted FOF score a sub-advisor gets
from all of its mandated mutual funds (FOF), and the value weighted Equity score a sub-advisor gets from all of its mandated mutual funds (Equity). These variables (except for RetExCat(-1)) are sub-advisor characteristics that could potentially affect performance. All estimations include sub-advisor fixed effects. Standard errors adjust for heteroskedasticity. In Column (1) and (3), we include sub-advisor fixed effects to control for the unobserved heterogeneity across sub-advisors. In Column (2) and (4), we include both sub-advisor fixed effects and time effects so that we control for both the unobserved heterogeneity across sub-advisors as well as unexpected variation or special events (such as financial crisis) that may affect returns.
Our main prediction is that the sign of β should be negative. Table 9 presents results that are consistent with this prediction using two size measures, mandated assets and mandated counts respectively. Column (1) shows that, for a given sub-advisor, as its mandated assets increase across time by $2.7 million (so that the natural logarithm of the advisor assets increases by $1 million), the sub-advisor excess return relative to its category decreases by 0.84% per year (-0.07%*12), controlling for other characteristics. The estimation is significant at less than 1% level. Column (3) shows that, for a given sub-advisor, as its mandated counts increases by 2.7 units (so that the natural logarithm of the sub-advisor counts increases by 1 unit), the sub-sub-advisor excess return relative to its
category decreases by 1.00% per year (-0.083%*12) and is significant at less than 1% level. In all estimations, sub-advisor past performance positively predicts its current performance and the coefficients are significant at less than 1% level. This is consistent with empirical findings in the mutual fund literature (see e.g., Chen, Goldstein and Jiang (2010)).
Table 10 replicates analyses from Table 9 on subsamples of equity advisors. The effect of size on advisor performance is stronger for equity sub-advisors. Specifically, for a given sub-advisor, as its mandated assets increase across time by $2.7 million, the sub-advisor excess return relative to its category decreases by 1.08% per year (-0.09%*12), controlling for other characteristics. The estimation is significant at less than 1% level. As its mandated counts increases by 2.7 units, the sub-advisor excess return relative to its category decreases by 1.44% per year (-0.12%*12) and is again significant at less than 1% level.
B.3. Implication on Mutual Fund Performance
So far we analyze decreasing returns for sub-advisors in deploying their ability. The results show that for a given sub-advisor, its excess return decreases in its mandate assets or counts. How does this phenomenon affect the performance of mutual funds? This section addresses this issue.
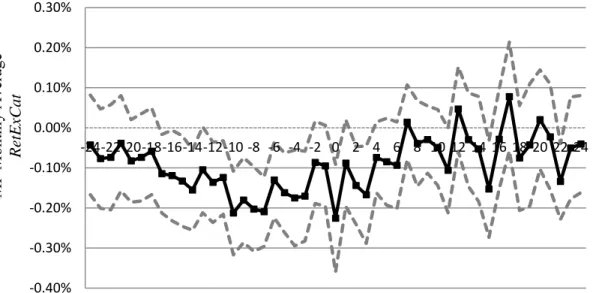
Figure 5 Panel A plots mutual fund average excess return by time around an active sub-advisor change. The figure shows that mutual fund excess return relatively to its category seems to slightly increase after an active sub-advisor change. We test the significance in Table 11 and 12.
Table 11 presents the cumulative average return and the cumulative average expense ratio of mutual funds with a sub-advisor change (targets) in excess of the benchmarks, around the effective change date denoted as “date zero”. We calculate three benchmarks. Benchmark 1 in Column (1) and (4) is all funds in the same Lipper category as the target on “date zero”. Benchmark 2 in Column (2) and (5) is all sub-advised funds in the same Lipper category as the target on “date zero”. Benchmark 3 in Column (3) and (6) is all funds in the same Lipper category and in the same past return quintile as the target on “date zero”. For a detailed explanation of the calculation, please see Table 11. All standard errors adjust for cross-correlation and auto-correlation.
The most interesting finding in Table 11 is that mutual funds continue to significantly underperform their benchmarks by 0.60% to 0.93% in the 18-months after a sub-advisor change, depending on the benchmark measure. In particular, even when we control for last year's fund return and the fund category, mutual funds continue to significantly underperform by 0.93% in the following 18 months. This finding is consistent with our previous finding that after being hired
by a mutual fund, sub-advisor performance decreases. The table also shows that before a sub-advisor change, mutual funds significantly underperform their benchmarks by 0.58% to 2.07%, depending on the benchmark measure. This result is not surprising since mutual funds that change their sub-advisors are likely to be poorly performing ones, as suggested in Table 3 and 4. Meanwhile, Column (4) to (6) suggest that mutual funds with sub-advisor change have higher expense ratio compared to their benchmarks and the magnitude is quite persistent over time.
Now we try to test whether the continued underperformance of mutual funds experiencing a sub-advisor change results from continued outflows from clients. Results in Coval and Stafford (2007) suggest that large outflows can cause poor fund performance because funds are forced to sell their stocks to meet client redemptions, putting downward pressure on prices. Evidence in Tables 3 and 5 suggests that outflows predict sub-advisor changes, but it's also likely that outflows continue even after the sub-advisor is changed because outflows are persistent. If so, the later outflows could help explain the underperformance after a sub-advisor change. We test this by controlling for past flow quintiles, in addition to fund category and past return quintiles.
In Table 12, Column (1) control for fund past 12 month flows, in addition to fund category and past 12 month returns. Column (2) control for fund past 6
month flows, in addition to fund category and past 6 month returns. Column (3) control for fund past 1 month flows, in addition to fund category and past 1 month returns. All standard errors adjust for cross-correlation and auto-correlation.
The table shows that sub-advised mutual funds continue to significantly underperform by about 0.8% to 1.0% in the 18-months after a change in sub-advisor, even when we control for last year’s fund flows, fund returns and fund category. Thus, we believe that the continuing underperformance of mutual funds with sub-advisor change is unlikely to be resulted from continuing outflows from clients. Rather, it is reasonable for us to believe that the underperformance of mutual funds can be attributed to decreasing returns for sub-advisors in deploying their ability. The table also suggests that for mutual funds with sub-advisor changes, their performance is not improved in the 18 months following the change, compared to the performance in the 18 months before the change. These funds, however, have 0.28% (0.14%*2) higher expense ratios per year, compared to their benchmarks.
VI.
Conclusion
This paper provides an empirical analysis of mutual funds and their sub-advisors around the event of a sub-advisor change. We test two hypotheses. First, there is an inverse relation between mutual fund past performance and the probability of changing a sub-advisor. There is also an inverse relation between
mutual fund past outflows and the probability of changing a sub-advisor. This is because of the monitoring effects of mutual fund board of directors. Second, there are decreasing returns for sub-advisors in deploying their ability. We present evidence that is consistent with these views.
The contribution of our paper is threefold. First, our paper sheds new light on the factors that affect mutual fund decisions in sub-advisor change. We find that in addition to fund performance, fund outflows and fund size affect the propensity of mutual funds changing their sub-advisors. Second, our paper is the first in the literature to provide evidence on decreasing returns for money managers in deploying their ability in the context of sub-advisors. While previous literature provides analysis from the perspective of mutual funds and hedge funds, data used in our paper allows us to address this issue from the perspective of advisors. We show that after being hired by a mutual fund, the size of the sub-advisor increases and its subsequent performance decreases. Third, our paper shows that although mutual funds make rational decisions in changing a advisor, their performance is not improved due to decreasing returns for sub-advisors in deploying their ability.
Hedge Fund Equity Holdings in the Real Estate Boom and Bust
Abstract
This paper provides empirical evidence on the exposure of hedge funds to overpriced real estate assets. First, I show that the Real Estate Investment Trusts (REITs) were overpriced from 2003Q1 to 2007Q2. Second, using a comprehensive sample of 434 hedge funds, I find that these funds were holding RETIs instead of selling short during the overpriced period, consistent with models in which delegated portfolio managers may want to invest in overpriced assets.
I’m very grateful to Prof. Robert Hodrick, Gur Huberman, Wei Jiang and Paul Tetlock for their tremendous support and help along the way. I thank Prof. Wei Jiang for sharing her data with me. I would also like to thank Bingxu Chen, Kent Daniel, Vyacheslav Fos, Sergiy Gorovyy, Charles Jones, Tomasz Piskorski, Tano Santos, Weixing Wu, Hongbo Zhou, and seminar participants at Columbia Business School for their helpful comments and discussions. All errors are my own. Email: ychen14@gsb.columbia.edu.
I.
Introduction
Hedge fund managers are sometimes faced with a dilemma: whether to invest in overpriced assets or not. Holding overpriced assets could be disastrous if prices start to fall. At the same time, selling short could result in losses if managers are forced to close out positions if prices keep rising. Avoiding the market could also be risky if fund managers’ returns are not competitive. For instance, John Paulson, the hedge fund manager who started to trade against the housing market in mid-2006, endured one of the most difficult periods in his life in the latter half of 2006 as housing prices continued to rise. Yet he managed to fend off skepticism and hostility from investors and meet their redemptions. He finally made $15 billion for his firm in 20076.
How managers make choices when faced with this dilemma is not well studied since data on hedge funds is difficult to obtain. This paper investigates their behavior. Specifically, I ask whether hedge funds were holding or short selling overpriced real estate stocks.
Before addressing these questions, a critical question is whether and when the real estate sector was overpriced. Although there were differing views in academia and in the public media before the financial crisis, this paper provides evidence on real estate overpricing using information before the market collapsed.
6 More details are available in “
Following Ofek and Richardson (2002), I find that, at the peak, the Real Estate Investment Trust (REIT) sector that consisted of 268 stocks, was priced as if the average future earnings growth rate across all these entities would exceed the growth rates experienced by some of the fastest growing individual firms in the past, and meanwhile, the required rate of return would be zero for the next five years. Other valuations also suggest that REITs were overpriced beginning in 2003.
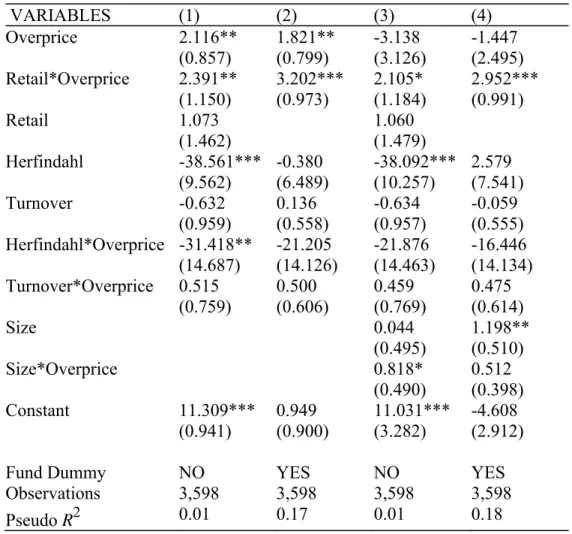
Having documented the overpricing in real estate, I analyze hedge fund reactions using a comprehensive sample of 434 hedge funds. The data cover the period 2003Q1 to 2009Q1 and are compiled from various sources. Specifically, I start by estimating the exposure of hedge funds to REITs based on the long positions reported in their 13F filings. I find that the proportion of hedge funds’ overall stock holdings devoted to REITs was higher than the corresponding weight of REITs in the market portfolio during the overpricing period from 2003Q1 to 2007Q2.
To test how potential short positions affect this analysis, I regress returns on various aggregate hedge fund indexes on the market return and the real estate excess return. I find that for most aggregate hedge fund returns, loadings on the real estate sector were not significant. The insignificance indicates that hedge funds’ net exposures to REITs were comparable to the market portfolio.
Moreover, dynamic analysis that allows for time-varying regression coefficients also supports this result. To conclude, hedge funds were holding real estate stocks rather than selling short during the overpricing period.
The above empirical finding is consistent with two main insights in the literature on limits of arbitrage. First, professional investors may be reluctant to trade aggressively against mispricing. In DeLong, Shleifer, Summers and Waldman (1990a), an arbitrageur with a short time horizon will limit her willingness to trade against mispricing because of “noise trader risk”, which is the risk of a further change in the opinion of noise traders away from its mean. Abreu and Brunnermeier (2002) show that a rational trader may delay an arbitrage trade because of synchronization risk, which is the uncertainty about the timing of other arbitrageurs’ actions, and her desire to minimize holding costs. Shleifer and Vishny (1997) argue that delegated portfolio managers can become most constrained when they have the best opportunities (i.e., when mispricing widens). The fear of forced redemption would stop them from trading aggressively to eradicate mispricing. Consistent with this view, Sirri and Tufano (1998), Chevalier and Ellison (1997), and Chen, Goldstein and Jiang (2010) find that mutual funds experience outflows when their performance is poor. Others document similar flow-performance sensitivity for hedge funds: Goetzmann,
Ingersoll, and Ross (2003); Agarwal, Daniel, and Naik (2004); Baquero and Verbeek (2005); Ding, Getmansky, Liang, and Wermers (2009).
Second, under certain circumstances, rational investors may find it optimal to invest in overpriced assets. In DeLong, Shleifer, Summers and Waldman (1990b), rational investors will buy overpriced assets and raise prices. This is because positive feedback investors, who buy when prices rise and sell when prices fall, are expected to react to today’s price rise by buying, which will raise prices even further. In Abreu and Brunnermeier (2003), arbitrageurs will invest in overpriced assets if they believe their peers are unlikely to trade against them yet. Arbitrageurs will sell those assets only when their subjective probability that the bubble will burst is sufficiently high. In all, my findings are consistent with these theoretical results.
The empirical finding in this paper is also consistent with Brunnermeier and Nagel (2004). In their seminal paper, the authors find that hedge funds were heavily invested in technology stocks from 1998 to 2000 and gained from this strategy. Furthermore, they find that different exposures to the technology segment during the overpricing period coincided with quite different flow patterns, which indicates that hedge fund investment strategies and fund flows are closely related.
The rest of the paper is organized as follows. In Section II, I outline the hypothesis and discuss the underlying premise. Section III describes the data collection process and presents the summary statistics. In Section IV, I define the overpriced sector and provide evidence on overpricing. In Section V, I test my hypothesis. Finally, Section VI concludes.
II.
Hypothesis
Hedge funds are holding overpriced assets before the market collapses.
Shleifer and Vishny (1997) suggest that trading against mispricing is risky because mispricing may deepen in the short run, even though there is no long run fundamental risk in the trade. Since fund flows are sensitive to past performance, the fear of forced redemption would stop delegated portfolio managers from trading aggressively to eradicate mispricing.
Furthermore, managers may have incentive to invest in overpriced assets if they believe they can predict other investors’ behavior. DeLong, Shleifer, Summers and Waldman (1990b) show that in anticipation of the demand from positive feedback investors who chase the price trend, rational investors will buy today and drive prices up because positive feedback investors are expected to buy tomorrow and raise future prices even further. In Abreu and Brunnermeier (2003), arbitrageurs will invest in the overpriced assets if their subjective probability that
their peers will trade against overpricing is low. They will only sell or short the overpriced assets when their subjective probability that the bubble will burst is sufficiently high. In both models, rational investors believe that they can get out of the market before it collapses.
In this section, I present the hypothesis that is analyzed in this paper. To conduct my study, I compile several data sources since virtually no single dataset is eligible to test the hypothesis. In the next section, I discuss the data collection process and present the summary statistics.
III.
Data Description
In subsection 1, I discuss the data collection process and describe how each dataset serves my analysis. In subsection 2, I provide an overview of hedge fund stock holdings.
A. Collection of the Data
My first dataset is comprised of monthly stock prices, shares outstanding, and share codes that are obtained from CRSP. The sample ranges from January 1998 to March 2009 so that both the technology overpricing and the real estate overpricing, and their consequent collapsing periods are covered. I then link this dataset to stock accounting information such as earnings and debts from
COMPUSTAT (Both CRSP and COMPUSTAT are available through WRDS). I use this combined dataset to provide evidence on overpricing.
The second dataset includes quarterly institutional holdings from 1998Q1 to 2009Q1 from the Thomson Reuters Ownership Database (formerly known as the CDA/Spectrum database). The holdings are based on institutional 13F filings with the U.S. Securities and Exchange Commission (SEC) and are available through WRDS. Prior to the Dodd-Frank Act7, a 1978 amendment to the Securities and Exchange Act of 1934 required all institutional investment managers that exercise investment discretion over $100 million or more in securities to file Form 13F to the SEC. Such securities include common stock, put/call option, class A shares, and certain convertible debentures. However, the Thomson Reuters Ownership Database only reports institutional stock holdings. Holdings are reported quarterly with a maximum of 45-day delay, where all common-stock positions greater than 10,000 shares or $200,000 must be disclosed. I merge this dataset with the third one to study hedge fund investment strategies.
The third dataset consists of a list of hedge funds8.Although the term “hedge fund” is not statutorily defined, it refers generally to any pooled investment
7 On July 21, 2010, the Dodd-Frank Act requires that advisers to hedge funds and other private funds with assets under managing of more than $150 million register with the SEC. This change in criterion does not affect my analysis since my sample period ends in 2009.
vehicle that is privately organized, administered by professional money managers, and not widely available to the public9. In practice, Agarwal, Fos and Jiang (2010) classify an institution that files a 13F as a hedge fund company if it satisfies one of the following: “ (i) It matches the name of one or multiple funds from the Union Hedge Fund Database which includes CISDM, Eureka, HFR, MSCI, and TASS. (ii) It is listed by industry publications (Hedge Fund Group (HFG), Barron’s, Alpha Magazine, and Institutional Investors) as one of the top hedge funds. (iii) The company’s own website claims itself as a hedge fund management company or lists hedge fund management as a major line of business. (iv) The company is featured by news articles in Factiva as a hedge fund manager/sponsor. (v) Some 13F filer names are those of individuals, for example, Soros Fund Management.” The list consists of relatively “pure-play” hedge funds, since full-service banks that engage in hedge fund business (such as Goldman Sachs Asset Management and UBS Dillon Read), fund management companies that enter both the mutual fund (or sub-advisors of mutual fund) and hedge fund business are excluded from the list. The reason for exclusion is that 13F holdings of these full service companies may not be informative of their hedge fund business.
The last database consists of a variety of monthly hedge fund indices available from the Hedge Fund Research (HFR). Each index reflects the aggregate
9 A list of discussions on the definition of “hedge fund” is available at: http://www.sec.gov/spotlight/hedgefunds/hedge-vaughn.htm
historical performance of a group of hedge funds with the same investment style. These indices are net of fees and rebalanced quarterly. For a hedge fund to be included in the index, a minimum asset size of $50 million and 24-month track record are required. I back out hedge fund net investments in the real estate sector from these indices.
B. Summary Statistics
Definitions of the main variables are reported in Table 1. [Insert Table 1]
Table 2 presents the summary statistics of hedge funds quarterly holdings in the sample of real estate overpricing. Column (3) suggests that the fast growth in the number of managers with a valid 13F filing from 2003Q1 to 2007Q1 coincides with the stock market boom. Column (5) shows that the median number of stocks per manager is around 90, indicating that hedge fund holdings were concentrated to a certain extent. In the paper, I use the total stock holdings of the fund as a proxy for hedge fund size. Column (7) and Column (8) show that the sizes of hedge funds in my sample are positively skewed, i.e., a few hedge funds are much larger than the majority of funds. Column (13) reveals that the aggregate size of all the hedge funds in my sample increased sharply until 2007 and slumped to 374 billion dollars as of 2009Q1, when the stock market reached the trough.