88
Spatio-temporal changes in density and distribution of burrow-nesting seabird
colonies after rat eradication
Rachel Buxton
1,4,5*, Graeme Taylor
2, Christopher Jones
3, Philip O’B Lyver
3, Henrik Moller
4,
Alison Cree
1and David Towns
21Department of Zoology, University of Otago, PO Box 56, Dunedin, New Zealand 9054
2Science and Capability Group, Department of Conservation, Private Bag 68908, Newton, Auckland 1145, New Zealand 3Landcare Research, PO Box 69040, Lincoln 7640, New Zealand
4Centre for Sustainability: Agriculture, Food, Energy, Environment, University of Otago, PO Box 56, Dunedin, 9054,
New Zealand
5Present address: Department of Fish, Wildlife, and Conservation, Colorado State University, Fort Collins, CO 80523, USA
*Author for correspondence (Email: [email protected])
Published online: 15 September 2015
Abstract: The size and distribution of colonies of burrow-nesting petrels is thought to be limited partly by the availability of suitable breeding habitat and partly by predation. Historically, the availability of safe nesting habitat was restricted in New Zealand, due to the introduction of rats by humans. More recently, however, habitat has been restored by rat eradication. Petrel colony growth is mediated by both positive and negative density dependence, although it is unclear if, or how, density dependence will affect patterns in post-eradication colony recovery. Here, using burrow density as a proxy for relative abundance, we tested whether petrel colonies increase in density or area after rat eradication by sampling along a chronosequence of (1) five islands from which rats were eliminated 1 to 26 years ago, (2) two islands that never had rats, and (3) an island with rats still present, while controlling for habitat availability. We also measured a time series of burrow densities in plots on each island to compare temporal changes after rat eradication. Using Bayesian hierarchical modelling, after controlling for nesting habitat, we found that mean burrow density increased with time since rat eradication. Burrows remained clustered (i.e. spatially structured), but became more randomly distributed on islands with more time since eradication. Point density mapping indicated that colony extent increased with time since rat eradication, with colonies filling over 70% of surveyed areas on islands by 25 years after eradication. Increases in burrow density and colony area, but maintenance of clustered distribution, suggest both positive and negative density dependence may operate during colony expansion. Understanding patterns in petrel colony recovery is important, not only due to the indispensable role of petrels as island ecosystem engineers, reflecting the recovery of ecosystem functioning, but also to help guide post-eradication monitoring strategies.
Keywords: density dependence; eradication; ideal despotic Allee model; Procellariiformes; recovery; restoration; rodents
Introduction
Across the globe, the introduction of predators by humans has been implicated in the extinction, extirpation, or severe population reduction of numerous island species (Atkinson 1989; Towns et al. 2006). The most widespread of invading predators are rodents, which have invaded 90% of island groups (Jones et al. 2008). Colonial, burrow-nesting petrels (order: Procellariiformes) are particularly vulnerable to rodent introduction because of their easily accessed nests and lack of appropriate anti-predator behavioural adaptations (Moors & Atkinson 1984). Because petrels act as ecosystem engineers, providing islands with indispensable sources of nutrients and physical disturbance, the reduction of their populations has had dramatic cascading effects on island ecosystems (Croll et al. 2005; Fukami et al. 2006; Smith et al. 2011). Over the past three decades, efforts to eradicate introduced rodents and restore islands have accelerated, with over 800 islands cleared of rats and all other types of vertebrate pests (Keitt et al. 2011). Because petrels engineer island habitat, population response will likely play a disproportionately large role in the recovery of ecosystem functioning. Yet only now are factors
driving petrel colony recovery being studied (Jones 2010a; Buxton et al. 2014).
After predator eradication, the colonisation, re-distribution, and growth of an affected colony of seabirds is a complex process, with multiple ecological and anthropogenic drivers (Buxton et al. 2014). The structure of a remnant colony will depend on the type of predator, the vulnerability of different species to predation, and the spatio-temporal nature of interactions between predators and seabird prey (Jones et al. 2008; Lavers et al. 2010). As populations grow and recruitment increases, the selection of a nesting site will be both positively and negatively density-dependent (Crespin et al. 2006). Positive density dependence will initially be important, where colonial animals are more likely to settle among conspecifics owing to increased potential of finding mates, diluted predation risk, and indication of high-quality nesting habitat (Wittenberger & Hunt 1985; Danchin & Wagner 1997; Schippers et al. 2011). However, as more birds settle, inter- and intra-specific competition will eventually force new recruits into new, unoccupied habitat (Forbes & Kaiser 1994). This model of seabird colony growth is known as the ‘ideal despotic Allee model’: a hybridisation of the ‘ideal New Zealand Journal of Ecology (2016) 40(1): 88-99 © New Zealand Ecological Society.
Allee’ model, where the benefits of group living result in inverse density-dependence in small groups, and the ‘ideal despotic’ model, where dominant individuals secure good quality territories and force others into less favourable habitat (Fretwell & Lucas 1969; Fretwell 1972; Kildaw et al. 2005). The ideal despotic Allee model is thought to typify seabird colony formation and growth and could readily be used to examine colony recovery after predator removal.
The wide-reaching effects of predator introduction are well-exemplified in New Zealand, where rodents have invaded over 45% of islands ≥5 ha in the archipelago (Holdaway 1999; Towns et al. 2006) since the arrival of humans and rats in the 13th century AD (Wilmshurst et al. 2008). Fossil evidence suggests that the combined effects of disturbance, habitat alteration, and, notably, predation by introduced mammals such as rodents, have restricted once widespread burrow-nesting seabird populations to predator-free offshore islands (Jones 2000; Taylor 2000). The reduction in seabird numbers has resulted in reduced soil fertility and altered above- and below- ground ecosystem dynamics (Fukami et al. 2006). In response, New Zealand has performed more successful rodent eradications than any other country, resulting in over 30 000 ha of newly predator-free breeding space (Towns et al. 2013), and enormous opportunity for investigating how petrels respond to rodent eradication.
Although rodent eradication from islands has become extremely successful, evaluating the ecological response to such island restoration, especially for petrels, remains uncommon. Moreover, robust and consistent post-eradication monitoring programmes have yet to be designed for offshore islands in New Zealand. Developing a model of population growth in order to develop a priori predictions about recovery is one of the fundamental elements of effective monitoring (Lindenmayer & Likens 2010). Thus, here we examined the density and spatial distribution of petrel burrows on recently rat-free islands off the north-eastern coast of New Zealand’s North Island to draw inference on patterns in colony growth and recovery. We used the ideal despotic Allee model as a framework to develop predictions and interpret spatial patterns of burrows following eradication.
Since no pre-eradication data were available, we used a chronosequence approach (space-for-time substitution), where a series of islands representing a chronological sequence of
increasing time since eradication were used (Perrow & Davy 2002). We compared the density and spatial distribution of petrel burrows on eight islands that varied in the presence, absence, or times since eradication of Pacific rats (kiore, Rattus
exulans). We hypothesised that when rats are present or were
recently removed, birds will recruit into remnant colonies, making burrows clustered in distribution, burrow area limited, and burrow density low. As time passes after eradication, more birds recruit, and colonies grow; burrow density will increase and eventually colonies will expand in area and burrows will become less clustered in distribution. We counted burrow entrances along transects, measured burrow density and a suite of habitat variables in plots, and re-measured burrow density in a time series after rat eradication to address four questions. First, does burrow density or burrow clustering increase on islands with more time elapsed since rat eradication? Second, does the spatial extent of a colony increase on islands with more time since rat eradication? Third, does the relationship between burrow density, the spatial extent of burrows, and time since rat eradication change after controlling for nesting habitat availability? Fourth, are changes in burrow density along the chronosequence reflected in changes in burrow density over a time series within an island?
Methods
Study area and species
We assessed burrow density on eight islands off the north-eastern coast of New Zealand’s North Island (Fig. 1). Five islands represented 1–26 years of recovery after eradication (Table 1): Pacific rats and European rabbits (Oryctolagus
cuniculus) were eradicated from Korapuki, Kawhitu, and
Ohinau in 1986, 1991, and 2005 respectively; and Pacific rats were eradicated from Whakau (Red Mercury) and Taranga in 1992 and 2011 respectively. Mauitaha (22 ha) is still inhabited by Pacific rats, whereas two islands, Ruamaahuanui (21 ha) and Atiu (13 ha), never had mammalian predators introduced.
All islands are within 7–13 km of New Zealand’s mainland and have similar climate, geology, and vegetation structure. Climate is warm-temperate, soils are volcanic in origin and thus very friable, and dominant vegetation includes pōhutukawa
(Metrosideros excelsa), kānuka/mānuka (Kunzea ericoides/
Table 1. Eight islands off the north-eastern coast of New Zealand’s North Island surveyed for burrow-nesting seabirds using plots, transects, cluster analysis (Cluster), and plots assessed in a time series (Time series). Each island differs in the presence (‘still present’), absence (‘n/a’), or time since rat eradication.
__________________________________________________________________________________________________________________________________________________________________
Island Area of Year rats Month Transects Plots Year Cluster Time
island (ha) eradicated surveyed surveyed series
__________________________________________________________________________________________________________________________________________________________________
Mauitaha 22 still present December/October 31 68a 2011/2012 Y N
Taranga 470 2011 November/October 61 120a 2011/2012 Y N
Ohinau 32 2005 October 33 100a 2012 Y N
Kawhitu 100 1991 November 35 132a 2012 Y Y
Whakau 220 1992 October n/a 10b 1998 N N
Korapuki 18 1986 December 41 101a 2012 Y Y
Ruamaahuanui† 21 n/a November n/a 76a 2010 N Y
Atiu 13 n/a November n/a 13c 2003 N N
__________________________________________________________________________________________________________________________________________________________________ a 3-m radius circular plots
b 4-m radius circular plots c 40 m2 rectangular plots
90 New Zealand Journal of Ecology, Vol. 40, No. 1, 2016
Leptospermum scoparium), and māhoe (Melicytus ramiflorus)
(Sladden & Falla 1928; Edgar 1962; Wright 1978; McCallum et al. 1984; Taylor & Lovegrove 1997; Atkinson 2004; NIWA 2012). All islands were extensively burned and terraced by the first Polynesian settlers; thus, current vegetation reflects post-fire succession (Sladden & Falla 1928; Edgar 1962; McCallum et al. 1984). All islands have remained relatively undisturbed since the mid-19th century and are currently protected as nature reserves, primarily for the conservation of native terrestrial ecosystems (Towns et al. 2013), and with restricted public access.
Seven species of burrow-nesting seabirds in the order Procellariiformes were present on the islands: grey-faced petrel (Pterodroma macroptera gouldi), fluttering shearwater (Puffinus gavia), flesh-footed shearwater (Puffinus carneipes), little shearwater (Puffinus assimilis), common diving petrel (Pelecanoides urinatrix), sooty shearwater (Puffinus griseus), and Pycroft’s petrel (Pterodroma pycrofti). Limited available information suggests that burrows of all species tend to be sympatric, with more association between species than expected by chance (Hicks et al. 1975; Pierce 2002). Although some species have different physical nesting habitat preferences, general habitat use overlaps (Buxton 2014).
Field surveys
We used a systematic sampling approach to estimate burrow density and area, involving transects and plots on five islands: Mauitaha, Taranga, Ohinau, Kawhitu, and Korapuki (Table 1). A burrow was defined as a cavity >20 cm in length in the soil or below a rock or log, with an entrance >12 cm2 (measured
using a soil probe marked at 6 and 20 cm).
To distribute surveys evenly over the entire surface of each island, we ran search transects from coast to coast at even intervals perpendicular to an island’s long axis. The resulting distance between transects was between 10 and 40 m, depending on island size. Transect direction was determined by compass bearing. Because of the steep terrain on Taranga, transects were shorter and constrained by proximity to existing tracks.
To estimate burrow density, we surveyed between one and six 3-m-radius circular plots along each transect at randomly-assigned distances. This resulted in a total of 68–132 plots on each island (Table 1). Within each plot we counted all seabird burrows where the midline of the entrance fell within plot limits. To assess the degree of burrow clustering on the five island transects, we measured and compared the distance between the plot centre (a random point) to the nearest burrow and the distance from that burrow to the nearest neighbouring burrow. Generally, on islands with low density (Mauitaha and Taranga), only one burrow could be found within plot limits. Thus, to maintain consistency, we used measurements to only one nearest neighbouring burrow per plot on all islands.
It was not possible to search transects on Ruamaahuanui because of high burrow density and thus high risk of burrow collapse. Instead, we used similar surveys of 3-m-radius circular plots whose locations were allocated randomly as part of a previous study (Whitehead et al. 2014). Burrow density estimates on Whakau and Atiu were based on opportunistic surveys from previous studies, involving 4-m-radius circular plots and 40-m2 search transects respectively (GT unpubl.
data; Table 1).
To estimate burrow area we searched 1 m either side of transect centre lines for seabird burrows. Each burrow was marked as a waypoint using a handheld satellite navigation system (GPSMAP 60CSx Garmin, Kansas, USA). We searched between 31 and 61 transects on Mauitaha, Taranga, Ohinau, Kawhitu and Korapuki (Table 1).
Finally, to account for nesting habitat availability on each island, we recorded key nesting-habitat variables in each 3-m-radius plot: aspect, slope, elevation, topography, soil depth, soil strength, soil texture, percentage cover of boulders, stem count for each species 2.5–10 cm in diameter at breast height (dbh), canopy species and percent cover. Habitat survey methods are detailed in Buxton et al. (2015).
Historical time-series data
To compare results from the chronosequence of islands with actual measures of change in burrow density over time, we examined permanent plots with time series of burrow counts where available. Plots with annual counts of burrow density after eradication were available on two islands, Kawhitu and Korapuki, and for one island (Ruamaahuanui) that never had rats (Table 1).
On Kawhitu, petrel burrow density was assessed in 1993, 1998, and 2003 using two methods: 5-m-radius circular plots every 10–20 m along a transect and three groups of small adjacent square plots, consisting of one 400-m2 plot, assessed
in 16 increments of 25 m2. Circular plots were placed at every
marker along the main north-western track from sea level, while square plots were placed randomly in the centre of the northern part of the island.
On Korapuki and Ruamaahuanui, 20 permanent occupancy plots of 100 m2 were placed randomly over the surface of
each island. The four corners of each plot were marked with aluminium poles and each burrow was marked with a cattle tag. In 2003 and 2012 on Korapuki, burrow abundance was also assessed within 21 transects of 40 m2 (20 m long, searching
1 m either side of the centre line) deviating from the main ridgeline track.
Data analysis
To examine the relationships between burrow density and Figure 1. Location of study islands off the north-eastern coast of
the North Island, New Zealand, including those in the Hen and
clustering with time since eradication, we used a Bayesian hierarchical modelling approach. Because we were interested in burrow abundance among islands with varying availability of nesting habitat, we selected a hierarchical approach, which aligns complex data from various sources (Ellison 1996; Cressie et al. 2009). All models were fitted using OpenBUGS (Lunn et al. 2000), called from R version 2.14.2 using BRugs and R2WinBUGS (Sturtz et al. 2005; Thomas et al. 2006; R Development Core Team 2012). To ensure convergence and minimise autocorrelation between chains, we ran 40 000 iterations with a burn-in of 10 000 and a thinning rate of 20 on three chains (Gelman et al. 2004).
Burrow density and clustering
To examine the relationship between time since eradication and burrow density (i.e. burrow entrances per m2), we used
a varying intercept Bayesian hierarchical regression model. We modelled burrow density (Xjk) as:
Xjk~Normal
(
ψjk,σjk)
(1)where ψjkwas the mean predicted density of burrows in plot j
on island k, with precision σjk , and was estimated in a linear
regression of the form:
ψjk ~ αjk +βtseTSE+ ΣLl=1 βlk xlk (2)
where βtse was the rate at which burrow density increased
with the number of years after eradication, and βlk was
the effect of nesting habitat variation among islands k
and environmental covariates l. Environmental covariates included soil depth, southern and western aspect, slope, rock cover, karamū (Coprosma macrocarpa) stem count, māhoe (Melicytus ramiflorus) stem count, and total stem count, and were selected based on habitat selection models (Buxton et al. 2015). The intercept (αjk came from a prior distribution of
hyper-parameters Μα and σ2α:
αjk ~ Normal(Mα, σ2α) , (3)
Mαl ~ Normal(0,1000) , (4)
σ2
αl ~ InverseGamma(0.1, 0.1) (5)
The prior distribution of βlk was based on hyperparameters
Mβn and σ2βn, with the same structure as Eqns 3–5, while βtse
had a non-informative prior distribution (i.e. βtse ~ Normal
(0,1000)) (Gelman & Hill 2007).
We ran two separate models: one excluding environmental covariates (ΣL
l =1 βlk xlk, Eqn. 2), including density data from all
eight islands; and another including environmental covariates and only six islands with habitat data, to determine the effect of nesting habitat availability on change in burrow density after eradication. Posterior distributions were summarised by generating mean βtse values (and mean βlk for the model
including environmental covariates) with 95% credible intervals (CI). To quantify model fit, we regressed observed burrow density versus model-predicted burrow density and compared the slope (r2) with a 1:1 relationship (Piñeiro et al.
2008).
To examine the degree of burrow clustering, we compared the distances between random points and burrows and between neighbouring burrows with time since eradication on five islands (Mauitaha, Taranga, Ohinau, Kawhitu, and Korapuki). We used two models with similar structure to Eqns 1 and 2; one where ψjk was the mean predicted distance between
random points and burrows and one where ψjk was the mean
predicted distance between neighbouring burrows. If neither distance changed with relation to time since eradication, we assumed no difference in clustering. If distances between random points and burrows decreased (relative to distances between neighbouring burrows) with time since eradication, we interpreted this as a decrease in the amount of clustering.
Burrowed area
To determine the spatial extent of burrowed areas (hereafter ‘colonies’), all calculations were performed in ArcGIS for Desktop (10.1, ESRI Inc., USA). We first calculated point densities of burrows marked during transect (or, in the case of Ruamaahuanui, plot) searches. In ArcMap, ‘point density’ calculates the density of point features, in this case burrows, in a neighbourhood defined around each output raster cell (Silverman 1986). We used a neighbourhood radius size of 10 m, because most burrows still considered to be within a cluster were found at this distance (RTB unpubl. data), and a raster size of 15 × 15 m, which matched the reference frame of digital elevation models (DEM) used below. We then reclassified point densities into three classes – low (1–15 burrows), medium (16–30 burrows), and high (31+ burrows) – and converted them to polygons. The total area of each polygon, representing a colony of particular density class, was then calculated using the ‘calculate areas’ tool in ArcMap spatial statistics. The total area of colonies of each density class was corrected for survey effort and island size by dividing by survey area and island surface area. Finally, we created a raster layer of surveyed areas (along transects) with and without burrows present.
To estimate the effects of varying nesting habitat availability on colony area, we compared observed presence of a burrow in a raster (above) with burrow presence predicted from models of habitat use. If burrows were present in a large proportion of rasters where predicted probability of use was high (>50%), this suggested that birds were nesting in, and potentially filling, suitable habitat. Whereas, if burrows were absent from a large proportion of habitat where predicted probability of use was high, this suggested that birds were not occupying potentially suitable habitat (i.e. habitat availability was not necessarily a limiting factor).
To build predictive habitat models, the presence of a burrow in a raster was modelled as a binomial process:
Yjk ~ Bernouilli(φjk) (6)
where the probability of a burrow being present (φjk) in plot j on island k was estimated in a logistic regression based on the form:
logit(φjk) = αjk + ΣLl =1 βlkxlk (7)
where xlk were the environmental covariates l and βlk were
the associated parameters. We included only environmental covariates that were available as GIS layers from DEMs: slope, elevation, and categorical aspect. Aspect was transformed into a dummy variable by setting one class as a reference class with a coefficient of zero (Hardy 1993). The intercept αjk and
parameters βlk were given similar prior distribution as shown in
92 New Zealand Journal of Ecology, Vol. 40, No. 1, 2016
parameters is not clearly defined for multilevel models and is unstable, even from simulations that have converged (Zhu & Carlin 2000; Gelman & Hill 2007). AUC values vary between 0 and 1, with values ≤0.6 indicating a model performance no better than random, and values ≥0.7 considered useful; however, AUC values are also known to be unreliable in certain situations (Fielding & Bell 1997; Lobo et al. 2008). Thus we assessed model fit using a combination of the lowest DIC and highest AUC value.
To estimate where burrows would be present, we predicted the probability of presence within rasters in DEMs from Land Information New Zealand (LINZ; Columbus et al. 2011). We calculated slope, elevation, and aspect within rasters using the spatial analysis extension in ArcMap. Aspect rasters were separated into north, south, east, and west. We limited predictions to rasters with point density data (i.e. along transects).
Time-series
To examine the relationship between years and burrow density in permanent plots measured as a time series (Table 1), we used a separate Bayesian linear regression model for each island, where burrow density was modelled as:
Xj ~ Normal
(
φj, σj)
(8)where (φj) was the mean predicted density of burrows in plot j with precision σj, and was estimated in a linear regression
of the form:
φj ~ αj + ΣLl=1 βl xl (9)
On Kawhitu and Korapuki, where different plot types were used, covariates xl included the effects of year and plot type; while xl for Ruamaahuanui included year only. Both αj and βl
had non-informative prior distributions.
Results
Burrow density and clustering among islands
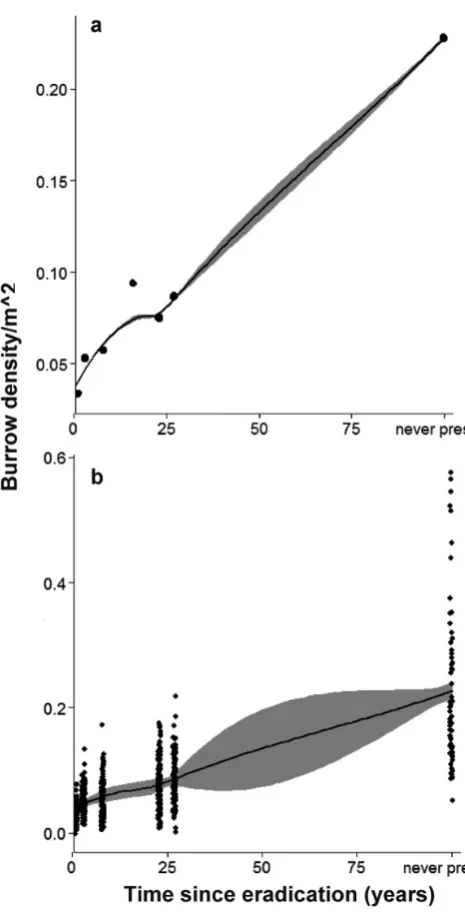
We estimated the relationship between burrow density and time since eradication by counting burrow entrances in 707 plots among eight islands (Table 1). We found that burrow density was positively related to time since eradication (mean effect size 0.003, 95% CI 0.001–0.015; Fig. 2a). However, this model had low predictive power (r2 = 0.11). To remove
the effects of variation in habitat availability between islands, we used burrow entrance data and environmental covariates from 597 plots on six islands. In this model, burrow density was still positively related to time since eradication, although the relationship was weaker (mean effect size 0.002, 95% CI 0.001–0.011, r2 = 0.42; Fig. 2b). On at least one island,
burrow density was also positively related to soil depth, slope, rock cover, southerly aspect, and the presence of māhoe and karamū (Coprosma macrocarpa) stems (Appendix S1 in Supplementary Material).
We found no evidence of change in distance between neighbouring burrows with time since eradication (95% CI overlapped zero: −1.0 to 0.1). Distance between random points and burrows decreased on islands with more time since eradication (mean effect size −2.6, 95% CI = −5.7 to −0.1). On Korapuki, an island with more than 25 years since eradication, the ratio between distances of random points to burrows and between neighbouring burrows was close to one (Fig. 3). This
indicated that burrows were less clustered (more randomly distributed) on islands with more time since eradication.
Burrow area among islands
We searched a total of 214 transects on five islands (supplemented with 76 plots on Ruamaahuanui). Using point density functions we found a total of 5 colonies on Mauitaha (Pacific rats present), 91 on Taranga (rats removed 2011), 117 on Ohinau (rats removed 2005), 451 on Kawhitu (rats removed 1991), 179 on Korapuki (rats removed 1986), and 84 on Ruamaahuanui (rats never introduced). The maximum density of colonies increased with time since eradication from 1.78 (burrows/225 m2 raster) on Mauitaha to 247.22
(burrows/225 m2 raster) on Ruamaahuanui. Total burrowed
Figure 2. Predicted burrow density (per m2) at different time
area, in proportion to survey and island area, was larger on islands with more time since eradication, from 0.007 on Mauitaha, 0.001 on Taranga, 0.06 on Ohinau, and 0.04 on Kawhitu, to 0.15 on Korapuki, and 0.37 on Ruamaahuanui (Figs 4 and 5). Finally, the proportion of area searched with at least one burrow increased with time since eradication from
Figure 4. Point density functions calculated from burrows marked along search transects (black lines) or within plots (dots) from islands
off the north-eastern coast of New Zealand’s North Island. Islands are arranged with increasing time since Pacific rat (Rattus exulans) eradication from left to right, top to bottom, where rats are still present on Mauitaha and were never introduced to Ruamaahuanui. Darker shades of greyscale indicate higher density burrow clusters. Scale bars indicate distances in metres.
0.31 on Mauitaha, 0.37 on Taranga, 0.39 on Ohinau, 0.50 on Kawhitu, and 0.71 on Korapuki, to 0.93 on Ruamaahuanui.
Predictive habitat models of burrow presence with the highest predictive power (AUC = 0.77 ± 0.02) included slope, elevation, aspect, and the interaction between slope and aspect (Appendix S2). Burrows were more likely to be found in areas with steeper slopes (Appendix S3). Islands with less time since eradication (and smaller colony area; Fig. 5) had a higher proportion of rasters with high predicted probability of use but no burrows present (Table 2). This suggested that although the habitat was suitable, burrows were absent; that is, habitat was not limiting burrow distribution. Conversely, on islands with more time since eradication (with larger colony area), there was a low proportion of rasters with burrows absent where predicted probability of burrow presence was high. This suggested that birds were filling suitable habitat. Furthermore, on islands with more time since eradication, burrows were present in a higher proportion of rasters with low predicted probability of presence, suggesting that birds were also occupying less suitable habitat (Table 2).
Burrow density time series
Although we had a low sample size, results from our (intra-island) burrow density time series model confirmed chronosequence results. On Kawhitu and Korapuki, islands with rats removed 21 and 26 years ago respectively, we found a small rate of burrow density increase within permanent plots over time (mean effect sizes 0.005 and 0.001 respectively; Table 3). On Ruamaahuanui, a predator-free island, we found no evidence of burrow density increase with year, as 95% CIs overlapped zero (mean effect size 0.003; 95% CI −0.002 to 0.008).
43
Figure 3
Mauitaha Taranga Ohinau Kawhitu Korapuki
Clus
ter
ing
ratio
0 1 2 3 4 5
0 1 7 21 26
Time since eradication
Figure 3. Ratio (‘clustering ratio’) between the distances of random points and burrows and between neighbouring burrows (± standard error) on islands off the north-eastern coast of
New Zealand’s North Island with different times since Pacific rat
94 New Zealand Journal of Ecology, Vol. 40, No. 1, 2016
Figure 5. Proportion of island area with ≥0.001 burrows/m2 measured using point density
calculations and corrected for surveyed area (‘Proportional colony area’) on six islands off the north-eastern coast of New Zealand’s North
Island, each with a different amount of time since
rat eradication (years since eradication indicated on the x-axis). Burrow densities per 225-m2 raster
were low (1–15 burrows), mid (16–30), and high
(≥31 burrows).
45
Figure 5
*Ruamaahuanui
Mauitaha Taranga Ohinau Kawhitu Korapuki Nui*
Tot
al col
ony
area/
Isl
and area*
surv
ey
area
0.000 0.050 0.150 0.200 0.250 0.300
Low Mid High
0 1 7 21 26 n/a
45
Figure 5
*Ruamaahuanui
Mauitaha Taranga Ohinau Kawhitu Korapuki Nui*
Tot
al col
ony
area/
Isl
and area*
surv
ey
area
0.000 0.050 0.150 0.200 0.250 0.300
Low Mid High
0 1 7 21 26 n/a
Table 2. Total proportion of rasters with burrows present (Burr pres) or absent (Burr abs) on six islands off the north-eastern coast of New Zealand’s North Island, where the predicted presence (P(pres) from predictive habitat models) of a burrow was greater or less than a threshold† (T). Islands are in ascending order from least to most time since Pacific rat (Rattus
exulans) removal, where Mauitaha still has rats present and Ruamahuanui never had rats introduced.
__________________________________________________________________________________________________________________________________________________________________
Island Burr abs, P(pres)>T Burr pres, P(pres)<T Burr pres, P(pres)>T Burr abs, P(pres)<T
__________________________________________________________________________________________________________________________________________________________________
Mauitaha 0.37 0.13 0.18 0.32
Taranga 0.32 0.11 0.26 0.30 Ohinau 0.25 0.17 0.21 0.37
Stanley 0.22 0.20 0.29 0.29
Korapuki 0.16 0.39 0.32 0.13
Ruamaahuanui 0.07 0.34 0.55 0.04
__________________________________________________________________________________________________________________________________________________________________
†The threshold was calculated as the mean predicted probability on each island (Liu et al. 2005)
Table 3. Median effect sizes and 95% credibility intervals from Bayesian logistic regression models predicting the relationship between years since Pacific rat (Rattus exulans) eradication (on Kawhitu and Korapuki) and petrel burrow density in permanent plots on three islands in north-eastern New Zealand.
__________________________________________________________________________________________________________________________________________________________________
Year rats eradicated Years measured Median effect size Credible intervals
5% 95%
__________________________________________________________________________________________________________________________________________________________________
Kawhitu 1991 1993, 1998, 2003 0.001† 0.0002 0.003
Korapuki 1986 2003, 2010, 2012 0.005† 0.002 0.009
Ruamaahuanui Never present 2006-2008, 2010, 2012 0.003 -0.002 0.008
__________________________________________________________________________________________________________________________________________________________________ † Credible intervals do not overlap 0, indicating strong evidence for a relationship between years and burrow density within an island
Discussion
Our results indicate that on islands where more time has elapsed since rat eradication, mean burrow density was higher and colony area greater. Although burrows were clustered in distribution on all islands, clustering decreased on islands with more time since eradication. These results suggest that both burrow density and burrowed area may increase on islands after rat eradication. Furthermore, both positive and negative density dependence may be mediating recruitment and colony growth; birds initially recruit into attractive remnant colonies until crowding forces birds to settle in new empty habitat.
Changes in burrow density and distribution
burrow density increased among islands with more time since rat eradication at an annual rate as great as 0.01 burrows/m2
(Table 3). This rate of increase is similar to those found in other burrow-nesting seabird populations after predator eradication: for example, a colony of ancient murrelets (Synthliboramphus
antiquus) doubled in size 5 years after the removal of black
(Rattus rattus) and Norway rats (R. norvegicus), while two
species of tropicbirds (red-billed Phaethon aethereus and white-tailed P. lepturus) recolonised and grew in population size by 2% per year after the removal of feral cats (Felis catus; Regher et al. 2007; Ratcliffe et al. 2010).
We found the highest level of burrow clustering was on islands with rats still present or recently removed, while clustering decreased on islands with more time since eradication (Fig. 3). We infer that the presence of Pacific rats may have restricted petrels to nest in clusters where they could minimise predation. For example, nest sites may persist where petrel density was high before rat invasion and predation was swamped or in areas infrequently used by predators (Lyver et al. 2000; Regher et al. 2007). Because rodents generally use all areas of an island (Moller & Craig 1987), the former explanation is the most likely. Furthermore, when predators are present, many colonial seabirds are known to have higher breeding success and lower mortality in larger, denser colonies (Gilchrist 1999; Cuthbert 2002). Clustering was highest on Ohinau, an island with 7 years since eradication. This may reflect philopatry and conspecific attraction, where individuals initially recruiting after eradication establish near previously occupied remnant breeding habitats, thus increasing clustering (Warham 1990; Forbes & Kaiser 1994; Whitworth et al. 2013). Finally, we found that the extent of burrowed areas increased with time since eradication: burrows were found in 50% of areas searched on islands with 20 years since rat eradication and in over 70% of areas searched on islands with over 25 years since eradication. Expansion of colony area has been reported in several seabird species in response to increased nesting habitat, either due to climate change (LaRue et al. 2013), the creation of habitat by humans (Sherfy et al. 2012), or the removal of a source of mortality (i.e. predation or hunting; Kress 1997; Keitt & Tershy 2003; Whitworth et al. 2013).
We postulate that the pattern of burrow density and distribution found in our study suggests the ideal despotic Allee model may apply to petrel recruitment and colony growth after rat eradication (Kildaw et al. 2005). An increase in burrow density and maintenance of burrow clustering on islands with more time since eradication suggest that persisting colonies may be initially attractive. The attractiveness of established colonies to new recruits is thought to be pervasive among gregarious animals, such as burrow-nesting seabirds (Danchin & Wagner 1997). However, as time passes after eradication, and the number of recruits into remnant areas increases, established colonies may become crowded, making it more advantageous for recruitment into new habitat (Fretwell 1972; Forbes & Kaiser 1994). This was also observed in our data, where burrows were found in almost all suitable habitat (Table 3), colony area was greater (Figs 4 and 5), and clustering decreased on islands with more time since rat eradication. Effect of nesting habitat abundance
Environmental covariates are known to affect the density and distribution of burrow-nesting seabirds (Buxton et al. 2015). Abiotic and biotic factors determining nesting habitat quality often include soil type, which must be soft enough to excavate, but strong enough to avoid collapse; canopy and
understorey vegetation, which adults must penetrate safely to reach their burrow; ground cover, which must be avoided or burrowed under; slope, which affects soil drainage; and aspect, elevation, and topography, which affect the ease of take-off and landing (Burger & Gochfeld 1991; Thompson & Furness 1991; Rodway et al. 1998; Bancroft et al. 2005a).
Our data suggest that environmental factors affected both burrow density and colony area. For example, among islands, higher burrow density was associated with deeper soil, the presence of large boulders, southern aspect, and the presence of māhoe and karamū stems (Appendix S1). Furthermore, burrows were more likely to be found in areas with steeper slopes (Appendix S3). However, there were large amounts of variation in burrow density and colony area that could not be explained by environmental factors alone (Table 2). For example, there was a large proportion of suitable habitat on Mauitaha, Taranga and Ohinau (Pacific rats still present, removed in 2011, and removed in 2005, respectively) that was not occupied with burrows. When habitat covariates were included in a model comparing burrow density with time since eradication, model fit increased, while the relationship between burrow density and time since eradication was still strong. We infer that, although nesting habitat is important in determining the distribution and density of petrel burrows, time since rat eradication still contributed to the final pattern of observed burrow distribution. We therefore conclude that although there may be interactive effects between colony recovery and nesting habitat quality, and that habitat should not be ignored, the effects of habitat are not necessarily enough to restrict increases in colony growth after eradication (Major et al. 2011; Buxton et al. 2015).
Potential caveats
Although we found a strong relationship between burrow density and colony area with time since rat eradication, caution must be taken when inferring a causal relationship with Pacific rat removal (Craig 1983; Jones 2001). Current distribution of burrow-nesting petrels on restored islands is likely to be shaped by a set of interacting variables including other introduced species (e.g. European rabbits), habitat modification, history of human harvesting, and historical distribution. We emphasise that, in this study, we use patterns of burrow distribution along the chronosequence of islands as a proxy for potential colony expansion after restoration, not as a direct indication of population recovery after rat removal.
In this study we use burrow density as a proxy for petrel abundance, as it has been shown to provide a temporally and spatially stable index of bird numbers (Rayner et al. 2007). Other indices, for example burrow occupancy assessed with infrared burrow cameras (Lyver et al. 1998), vary widely with season, at-sea conditions, and are associated with detection error (Sutherland & Dann 2012). However, burrow density alone may not be appropriate as a comprehensive index of population size, and more research is needed to examine the relationship between abundance and burrow density.
96 New Zealand Journal of Ecology, Vol. 40, No. 1, 2016
of each species of different sizes affected results. Further research should focus on the differences or similarities in recovery dynamics of various burrow-nesting seabird species. Conservation implications
Increase in burrow density and increase in burrowed area have several significant restoration and management implications. Because of seabirds’ role as ecosystem engineers, the growth of burrow-nesting petrel colonies can provide important insights into island ecosystem recovery (Mulder et al. 2009; 2011). Burrow excavation alone alters the physical and chemical properties of soil, increasing porosity and the rate of soil-forming processes, and results in stronger and drier soil (Bancroft et al. 2005b). Thus, an increase in burrow density and distribution after rat eradication may reflect a rapid change in soil dynamics. It has been postulated that a burrow density of 0.3–1 burrow/m2 is needed to promote ecosystem recovery
to never-invaded levels (Towns et al. 2009; Jones 2010a). We found that mean burrow density on restored islands was less than half (<0.1 burrow/m2) that on the never-invaded
Ruamaahuanui (>0.2 burrow/m2). Thus, although increases
in the number of burrows after rat eradication may seem rapid, burrow densities on restored islands have probably not yet reached a level where seabird-dominated ecosystem functioning is possible (Jones 2010b).
The increase in burrow density observed in our study, without active intervention, raises the question: in which cases and to what extent should managers actively work to facilitate seabird recovery (Holl & Aide 2011; Jones & Kress 2012; Buxton 2014)? Our data contradict the idea of slow or non-existent petrel recovery and instead suggest that island managers should carefully consider when the benefits of active restoration outweigh the cost. Several techniques, such as vocalisation playback and chick translocation, have been developed to actively anchor seabirds into new habitat (Parker et al. 2007; Miskelly et al. 2009; Buxton & Jones 2012; Jones & Kress 2012). In order to actively speed petrel recovery on islands with remnant colonies, the most effective strategy may be to lure birds into new habitat, which they would only otherwise inhabit passively after filling remaining patches.
Despite our study having potential caveats, our data confirm that much valuable information can be ascertained from monitoring the passive recovery of seabirds after predator removal to guide ecological understanding and restoration. Generally, invasive predator eradication projects have been undertaken without adequate consideration of ecosystem-level goal-setting or pre-eradication data collection. Thus, many projects lack the capacity to reliably assess success, notably the impact of predator removal on seabirds (Phillips 2010). Our results can be used to guide potentially effective monitoring strategies. For example, our data show that an increase in colony density and extent are expected after eradication, which suggests that post-eradication monitoring should target areas that are already burrowed at the time of eradication, but also non-burrowed areas where colonies may spread in the future.
Acknowledgements
Approval to access our study islands was granted by the Ngātiwai Trust Board, Ruamaahua Islands Trust, Ngāti Hei Trust, Ngāti Whanaunga, the Hauraki Collective and the Department of Conservation regional offices for Northland and Hauraki (Permit number WK-32142-RES). Special thanks
to C. Currey, F. Vonken, S. Reid, D. Hamon, K. Hawkins, C. Stone, C. Farr, B. Karl, M. Coleman, J. Thoresen, and R. Chappell for field assistance. Statistical support was kindly provided by A. Whitehead and helpful edits were provided by M. Rayner, C. Bezar, D. Anderson, and an anonymous reviewer. This project was funded by the New Zealand Ministry of Business, Innovation and Employment (contract C09X0908), the University of Otago, and the National Sciences and Engineering Research Council of Canada (NSERC).
References
Atkinson IAE 1989. Introduced Animals and Extinctions. New York, Oxford University Press.
Atkinson IAE 2004. Successional processes induced by fires on the northern offshore islands of New Zealand. New Zealand Journal of Ecology 28: 181–193.
Bancroft WJ, Roberts JD, Garkaklis MJ 2005a. Burrow entrance attrition rate in wedge-tailed shearwater Puffinus pacificus colonies on Rottnest Island, Western Australia. Marine Ornithology 33: 23–26.
Bancroft WJ, Garkaklis MJ, Dale Roberts J 2005b. Burrow building in seabird colonies: a soil-forming process in island ecosystems. Pedobiologia 49: 149–165.
Burger AE, Gochfeld M 1991. Nest-site selection by the herald petrel and white-tailed tropicbird on Round Island, Indian Ocean. Wilson Bulletin 103: 126–130.
Buxton RT 2014. Ecological drivers of seabird recovery after the eradication of introduced predators, PhD Thesis, University of Otago, Dunedin, New Zealand. 231 p. Buxton RT, Jones IL 2012. An experimental study of social
attraction in two species of storm-petrel using acoustic and olfactory cues. Condor 114: 733–743.
Buxton RT, Currey CA, Lyver POB, Jones CJ 2013. Incidence of plastic fragments among burrow-nesting seabird colonies on offshore islands in northern New Zealand. Marine Pollution Bulletin 74: 420–424.
Buxton RT, Jones CJ, Moller H, Towns DR 2014. Drivers of seabird population recovery on New Zealand islands after predator eradication. Conservation Biology 28: 333–344. Buxton RT, Anderson D, Moller H, Jones CJ, Lyver POB
2015. Release of constraints on nest-site selection in burrow-nesting petrels following invasive rat eradication. Biological Invasions 17: 1453–1470.
Columbus J, Sirguey P, Tenzer R 2011. A free fully assessed 15 meter elevation model for New Zealand. Survey Quarterly 66: 16–19.
Craig JL 1983. The effect of kiore on other fauna. In: Wright AE, Beever RE ed. The offshore islands of northern New Zealand. Wellington, New Zealand, Department of Lands and Survey Information Series. Pp. 75–83. Crespin L, Harris MP, Lebreton J-D, Frederiksen M, Wanless
S 2006. Recruitment to a seabird population depends on environmental factors and on population size. Journal of Animal Ecology 75: 228–238.
Cressie N, Calder CA, Clark JS, Hoef JMV, Wikle CK 2009. Accounting for uncertainty in ecological analysis: the strengths and limitations of hierarchical statistical modeling. Ecological Applications 19: 553–570.
Croll DA, Maron JL, Estes JA, Danner EM, Byrd GV 2005. Introduced predators transform subarctic islands from grassland to tundra. Science 307: 1959–1961.
density-dependent predation in the conservation of Hutton’s shearwater. Biological Conservation 108: 69–78. Danchin E, Wagner RH 1997. The evolution of coloniality:
the emergence of new perspectives. Trends in Ecology & Evolution 12: 342–347.
Edgar AT 1962. A visit to the Mercury Islands. Notornis 10: 1–15.
Ellison AM 1996. An introduction to Bayesian inference for ecological research and environmental decision-making. Ecological Applications 6: 1036–1046.
Fielding AH, Bell JF 1997. A review of methods for the assessment of prediction errors in conservation presence/ absence models. Environmental Conservation 24: 38–49. Forbes LS, Kaiser GW 1994. Habitat choice in breeding
seabirds: when to cross the information barrier. Oikos 70: 377–384.
Freeman E, Moison G 2008. PresenceAbsence: an R Package for presence-absence analysis. Journal of Statistical Software 23: 1–31. http://www.jstatsoft.org/v23/i11 (accessed 20 July 2015).
Fretwell S, Lucas H, Jr. 1969. On territorial behavior and other factors influencing habitat distribution in birds. Acta Biotheoretica 19: 16–36.
Fretwell SD 1972. Populations in a Seasonal Environment. Princeton, Princeton University Press.
Fukami T, Wardle DA, Bellingham PJ et al. 2006. Above- and below-ground impacts of introduced predators in seabird-dominated island ecosystems. Ecology Letters 9: 1299–1307.
Gelman A, Hill J 2007. Data analysis using regression and multilevel/hierarchical models. New York, USA, Cambridge University Press.
Gelman A, Carlin JB, Stern HS, Rubin DB 2004. Bayesian data analysis. Boca Raton, FL, Chapman and Hall/CRC Press. Gilchrist HG 1999. Declining thick-billed murre Uria lomvia
colonies experience higher gull predation rates: an inter-colony comparison. Biological Conservation 87: 21–29. Hardy MA 1993. Regression with dummy variables.
Quantitative applications in the social sciences. Newbury Park, CA, Sage.
Hicks GRF, McColl HP, Meads MJ, Hardy GS, Roser RJ 1975. An ecological reconnaissance of Korapuki Island, Mercury Islands. Notornis 22: 195–220.
Holdaway RN 1999. A spatio-temporal model for the invasion of the New Zealand archipelago by the Pacific rat Rattus
exulans. Journal of the Royal Society of New Zealand
29: 91–105.
Holl KD, Aide TM 2011. When and where to actively restore ecosystems? Forest Ecology and Management 261: 1558–1563.
Jones C 2000. Sooty shearwater (Puffinus griseus) breeding colonies on mainland South Island, New Zealand: evidence of decline and predictors of persistence. New Zealand Journal of Zoology 27: 327–334.
Jones HP 2010a. Prognosis for ecosystem recovery following rodent eradication and seabird restoration in an island archipelago. Ecological Applications 20: 1204–1216. Jones HP 2010b. Seabird islands take mere decades to recover
following rat eradication. Ecological Applications 20: 2075–2080.
Jones HP, Kress SW 2012. A review of the world’s active seabird restoration projects. Journal of Wildlife Management 76: 2–9.
Jones HP, Tershy BR, Zavaleta ES et al. 2008. Severity of
the effects of invasive rats on seabirds: a global review. Conservation Biology 22: 16–26.
Jones J 2001. Habitat selection studies in avian ecology: a critical review. The Auk 118: 557–562.
Keitt BS, Tershy BR 2003. Cat eradication significantly decreases shearwater mortality. Animal Conservation 6: 307–308.
Keitt BS, Campbell A, Saunders A, Clout M, Wang YW, Tershy B 2011. The global islands invasive vertebrate eradication database: a tool to improve and facilitate restoration of island ecosystems. In: Veitch CR, Clout M, Towns DR eds Island invasives: eradication and management. Gland, Switzerland, IUCN. Pp. 74–77.
Kildaw SD, Irons DB, Nysewander DR, Buck CL 2005. Formation and growth of new seabird colonies: the significance of habitat quality. Marine Ornithology 33: 49–58.
Kress SW 1997. Using animal behavior for conservation: case studies in seabird restoration from the Maine Coast, USA. Journal of the Yamashina Institute for Ornithology 29: 1–26.
LaRue MA, Ainley DG, Swanson M et al. 2013. Climate change winners: receding ice fields facilitate colony expansion and altered dynamics in an Adélie penguin metapopulation. PLoS One 8: e60568.
Lavers J, Wilcox C, Josh Donlan C 2010. Bird demographic responses to predator removal programs. Biological Invasions 12: 3839–3859.
Lindenmayer DB, Likens GE 2010. Effective ecological monitoring. Collingwood, VIC, Australia, CSIRO. Liu C, Berry PM, Dawson TP, Pearson RG 2005. Selecting
thresholds of occurrence in the prediction of species distributions. Ecography 28: 385–393.
Lobo JM, Jiménez-Valverde A, Real R 2008. AUC: a misleading measure of the performance of predictive distribution models. Global Ecology and Biogeography 17: 145–151. Lunn DJ, Thomas A, Best N, Spiegelhalter DJ 2000. WinBUGS – a Bayesian modelling framework: concepts, structure, and extensibility. Statistics and Computing 10: 325–337. Lyver POB, Robertson CJR, Moller H 2000. Predation at sooty shearwater (Puffinus griseus) colonies on the New Zealand mainland: is there safety in numbers? Pacific Conservation Biology 5: 347–357.
Lyver P, Hamilton S, McKenzie M, Dickson I, Dooher M, Broad T, Moller H 1998. A burrowscope for examining petrel nests in burrows. Wellington, New Zealand, Department of Conservation.
Major HL, Lemon MJF, Hipfner JM 2011. Habitat as a potential factor limiting the recovery of a population of nocturnal seabirds. Journal of Wildlife Management 76: 793–799. McCallum J, Bellingham P, Hay JR, Hitchmough RA 1984.
Birds of the Chicken Islands, Northern New Zealand. Tane 30: 105–124.
Miskelly CM, Taylor GA, Gummer H, Williams R 2009. Translocations of eight species of burrow-nesting seabirds (genera Pterodroma, Pelecanoides, Pachyptila and Puffinus: Family Procellariidae). Biological Conservation 142: 1965–1980.
Moller H, Craig JL 1987. The population ecology of Rattus exulans on Tiritiri Matangi Island, and a model of comparative population dynamics in New Zealand. New Zealand Journal of Zoology 14: 305–328.
98 New Zealand Journal of Ecology, Vol. 40, No. 1, 2016
Croxall JP, Evans PGH, Schreiber RW eds Status and conservation of the world’s seabirds. Cambridge, UK, International Council for Bird Preservation. Pp. 667–690. Mulder CPH, Grant-Hoffman MN, Towns DR, Bellingham
PJ, Wardle DA, Durrett MS, Fukami T, Bonner KI 2009. Direct and indirect effects of rats: does rat eradication restore ecosystem functioning of New Zealand seabird islands? Biological Invasions 11: 1671–1688.
Mulder CPH, Jones HP, Kameda K, Palmborg C, Schmidt S, Ellis J, Orrock JL, Wait A, Wardle DA, Yang L, Young H, Croll D, Vidal E 2011. Impact of seabirds on plant and soil properties. In: Mulder CPH, Anderson W, Towns DR, Bellingham P eds Seabird islands: ecology, invasion and restoration. New York, Oxford University Press.
NIWA 2012. The National Climate Database. http://cliflo. niwa.co.nz/
Parker MW, Kress SW, Golightly RT, Carter HR, Parsons EB, Schubel SE, Boyce JA, McChesney GJ, Wisely SM 2007. Assessment of social attraction techniques used to restore a Common Murre colony in central California. Waterbirds 30: 17–28.
Perrow MR, Davy AJ 2002. Principles of restoration. Cambridge, UK, Cambridge University Press.
Phillips RA 2010. Eradications of invasive mammals from islands: why, where, how and what next? Emu 110: i–vii. Pierce RJ 2002. Kiore (Rattus exulans) impact on breeding
success of Pycroft’s petrels and little shearwaters. Wellington, Department of Conservation.
Piñeiro G, Perelman S, Guerschman JP, Paruelo JM 2008. How to evaluate models: observed vs. predicted or predicted vs. observed? Ecological Modelling 216: 316–322.
Priddel D, Carlile N, Fullagar P, Hutton I, O’Neill L 2006. Decline in the distribution and abundance of flesh-footed shearwaters (Puffinus carneipes) on Lord Howe Island, Australia. Biological Conservation 128: 412–424. R Development Core Team 2012. R: a language and environment
for statistical computing. Vienna, Austria, R Foundation for Statistical Computing.
Ratcliffe N, Bell M, Pelembe T, Boyle D, Benjamin R, White R, Godley B, Stevenson J, Sanders S 2010. The eradication of feral cats from Ascension Island and its subsequent recolonization by seabirds. Oryx 44: 20–29.
Rayner MJ, Clout M, Stamp RK, Imber M, Brunton DH, Hauber ME 2007. Predictive habitat modelling for the population census of a burrowing seabird: a study of the endangered Cook’s petrel. Biological Conservation 138: 235–247. Regher HM, Rodway MS, Lemon MJF, Hipfner MJ 2007.
Recovery of the ancient murrelet Synthliboramphus antiquus colony on Langara Island, British Columbia, following eradication of invasive rats. Marine Ornithology 35: 137–144.
Rodway MS, Chardine JW, Montevecchi WA 1998. Intra-colony variation in breeding performance of Atlantic puffins. Colonial Waterbirds 21: 171–184.
Schippers P, Stienen EWM, Schotman AGM, Snep RPH, Slim PA 2011. The consequences of being colonial: Allee effects in metapopulations of seabirds. Ecological Modelling 222: 3061–3070.
Sherfy MH, Stucker JH, Buhl DA 2012. Selection of nest-site habitat by interior least terns in relation to sandbar construction. The Journal of Wildlife Management 76: 363–371.
Silverman BW 1986. Density estimation for statistics and data analysis. New York, Chapman & Hall.
Sladden B, Falla RA 1928. Alderman Islands. New Zealand Journal of Science and Technology 9: 282–290.
Smith JL, Mulder CPH, Ellis JC 2011. Seabirds as ecosystem engineers: nutrient inputs and physical disturbance. In: C. P. H. Mulder WA, D. R. Towns, Bellingham P eds Seabird islands: ecology, invasion and restoration. New York, Oxford University Press.
Spiegelhalter DJ, Best NG, Carlin BP, Van Der Linde A 2002. Bayesian measures of model complexity and fit. Journal of the Royal Statistical Society: Series B (Statistical Methodology) 64: 583–639.
Sturtz S, Ligges U, Gelman A 2005. R2WinBUGS: a package for running WinBUGS from R. Journal of Statistical Software 12: 1–16.
Sutherland DR, Dann P 2012. Improving the accuracy of population size estimates for burrow-nesting seabirds. Ibis 154: 488–498.
Taylor GA 2000. Action plan for seabird conservation in New Zealand, part A. Threatened species occasional publication. Wellington, New Zealand, Department of Conservation.
Taylor GA, Lovegrove T 1997. Flora and vegetation of Stanley (Atiu) Island, Mercury Islands Tane 36: 85–111.
Thomas A, O’Hara B, Ligges U, Sturtz S 2006. Making BUGS Open. R News 5: 12–17.
Thompson KR, Furness RW 1991. The influence of rainfall and nest-site quality on the population dynamics of the Manx shearwater Puffinus puffinus on Rhum. Journal of Zoology 225: 427–437.
Towns DR, Atkinson IAE, Daugherty CH 2006. Have the harmful effects of introduced rats on islands been exaggerated? Biological Invasions 8: 863–891.
Towns DR, West CJ, Broome KG 2013. Purposes, outcomes and challenges of eradicating invasive mammals from New Zealand islands: an historical perspective. Wildlife Research 40: 94–107.
Towns DR, Wardle DA, Mulder CPH, Yeates GW, Fitzgerald BM, Parrish GR, Bellingham PJ, Bonner KI 2009. Predation of seabirds by invasive rats: multiple indirect consequences for invertebrate communities. Oikos 118: 420–430. Warham J 1990. The petrels: their ecology and breeding systems.
San Diego, CA, Academic Press.
Warham J 1996. The behaviour, population biology and physiology of the petrels. Cambridge, UK, Academic Press. Whitehead A, Lyver POB, Jones CJ, Bellingham PJ, MacLeod
CJ, Coleman M, Karl BJ, Drew K, Pairman D, Gormley AM, Duncan RP 2014. Establishing accurate baseline estimates of breeding populations of a burrowing seabird, the Grey-faced Petrel (Pterodroma macroptera gouldi) in New Zealand. Biological Conservation 169: 106–116. Whitworth DL, Carter HR, Gress F 2013. Recovery of a
threatened seabird after eradication of an introduced predator: eight years of progress for Scripps’s murrelet at Anacapa Island, California. Biological Conservation 162: 52–59.
Wilmshurst JM, Anderson AJ, Higham TFG, Worthy TH 2008. Dating the late prehistoric dispersal of Polynesians to New Zealand using the commensal Pacific rat. Proceedings of the National Academy of Sciences 105: 7676–7680. Wittenberger JF, Hunt GL 1985. The adaptive significance of
coloniality in birds. In: Farner DS, King JR, Parkes KC eds Avian biology. New York, Academic Press. Pp. 1–78. Wright AE 1978. Vascular plants of Hen Island (Taranga)
Zhu L, Carlin BP 2000. Comparing hierarchical models for spatio-temporally misaligned data using the deviance information criterion. Statistics in Medicine 19: 2265– 2278.
Editorial board member: Dean Anderson
Received 1 October 2014; accepted 19 July 2015
Supplementary Material
Additional supporting information may be found in the online version of this article.
Appendix S1. Median effect sizes and 95% CI of habitat covariates and time since Pacific rat eradication
Appendix S2. Ranking of multivariate varying intercept models
Appendix S3. Median effect sizes and 95% CI from the top multivariate model predicting petrel burrow presence