RESEARCH ARTICLE
NON-EXPANDED RICE BASED SNACK: EFFECT OF PROCESSING VARIABLES ON
CHARACTERISTICS AND OPTIMIZATION OF EXTRUSION PROCESS USING
GENETIC ALGORITHM (GA)
1
Amit Baran Das and
2Prem Prakash Srivastav
1Food Engineering and Technology Department, Tezpur University, Assam 2Indian Institute of Technology, Kharagpur
ARTICLE INFO
ABSTRACT
The effect of extrusion conditions, including feed moisture (40–45%), screw speed (300–400 rpm) and
barrel temperature (65–75°C) onthe extrusion behaviour and extrudate properties of non-expanded rice
snack was investigated and optimization of process variables was carried out using response surface and genetic algorithm. Polynomial equations were developed for the extrudate properties such as water solubility index (WSI), water absorption index (WAI), specific mechanical energy (SME), power consumption and throughput in terms of the independent variables. These equations were used as the objective function to find the optimum process conditions for extrudate. The developed equations of WAI, WSI and throughput were maximized whereas power consumption and SME were minimized for optimum process conditions. Common optimum process conditions required a low screw speed of 323rpm, high moisture content of 44.59% (db) and low barrel temperature 65.82°C. The experimental extrudate properties matched the values predicted for common optimum conditions more closely than those for individual optimum conditions and percentage errors were higher in case of individually optimized conditions.
Copyright, AJST, 2013, Academic Journals. All rights reserved
INTRODUCTION
Extrusion cooking is a most popular method for preparing snacks. In the non-expanded or pellet snacks market, extrusion cooking has become the preferred processing technology. Extrusion cooking is a single process step where with the helps of various ingredients a wide variety of shapes and textures can be produced. The application of single screw extrusion cooking in processing of rice flour appears to be a simple process, but the control of the finished product characteristics
is rather complicated (Brent et al., 1997). Response surface
methodology (RSM) is very widely used to study the effect of process variables on product properties as well as for process optimization. Response surface methodology is consisted of some group of mathematical and statistical techniques used for development of relationship between dependent and independent parameter (Khuri and Cornell, 1987). It is particularly useful in areas where all the independent variables and their levels and responses are not clearly known (Harper, 1981). There is an abundant literature on the use of RSM for process development and optimization ( Bhattacharya and
Prakash, 1994, Khuri and Cornell, 1987, Sacchetti et al., 2004,
Shankar and Bandyopadhyay, 2004, Shankar and
Bandyopadhyay, 2005). Although RSM is intuitively a simple method, interpretation of the RSM results become tedious when optimizing a function with more than three independent
*Corresponding author: Amit Baran Das
Food Engineering and Technology Department, Tezupur University, Assam
variables at wider experimental range. Further, solving the RSM equations using canonical analysis involves orthogonal rotation of canonical varieties and the interpretation is widely believed to be very difficult (Das, 2005). In recent years, other optimization techniques for multiple process parameters have been used. Genetic algorithms (GAs) are one of them that have gained popularity in process engineering design. Genetic algorithms have found extensive application where process is highly complex and nonlinear (Goldberg, 2001). Food extrusion mechanisms are highly non-linear because of the complexity and variability of the extruder feed ingredients (Harper, 1981). For optimization of such type non-linear problems, genetic algorithms (GA) are one of the most promising techniques (Holland, 1992). However, literature regarding the application of genetic algorithms for optimization of process variables in extrusion cooking is uncommon. The present work has been undertaken to optimize the process variables for production of non-expandade rice snacks using single screw extruder. The specific objective of the present investigation was to find the optimum process conditions separately for each (individual) and commonly for all (common) extrudate properties.
MATERIALS AND METHODS
Raw Material
Rice flour from broken rice of Lal Sawarna was used in this study. Broken rice was produced during the milling of rice. ISSN: 0976-3376
Asian Journal of Science and Technology Vol. 4, Issue 07, pp.071-079, July, 2013
SCIENCE AND TECHNOLOGY
Article History:
Received 08th April, 2013
Received in revised form
07th
May, 2013
Accepted 24th June, 2013
Published online 19th
July, 2013
Key words:
Extruder, Broken Rice,
For conducting experiment broken rice was collected from the local rice mill in Kharagpur.
Feed preparation
Each experiment was conducted with 500 g of broken rice flour. The ingredients were mixed with rice flour and then measured amount of water (to maintain 40, 42.5 and 45 % db moisture content) was added slowly and mixing was carried out using a mixer. After mixing, feed sample put in polyethylene package at room temperature to equilibrate the moisture.
Extrusion
Each test was based on 500 g rice flour which was well mixed, adjusted to the desired moisture content (40, 42.5 and 45 % db) by adding water. For conducting the experiment a single screw cooking extruder was developed and fabricated at the workshop of the Indian Institute of Technology, Kharagpur. During extrusion, only the steady-state output was taken for analysis. Feeds were fed manual through the hopper.
Determination of dependent parameter
Evaluation for water absorption index (WAI) and water solubility index (WSI) of extrudates
WAI and WSI were determined according to the method
developed for cereals (Stojceska et al., 2008). The ground
extrudates were suspended in water at room temperature for 30 min, gently stirred during this period and then centrifuged at 3000 g for 15 min. The supernatants were decanted into an evaporating dish of known weight. The WAI was the weight of gel obtained after removal of the supernatant per unit weight of original dry solids. The WSI was the weight of dry solids in the supernatant expressed as percentage of the original weight of sample.
Weight gain by gel
WAI
Dry weight of extrudate
W
100
Weight of Dry Solid in Supernatant WSI
Dry eight of Extrudate
Power consumption
Power consumption was measured using standard energy meter during experiment.
Specific Mechanical Energy (SME)
After the consideration of motor load and its efficiency, the SME values were calculated according to the method described by Bhattacharya and Choudhury, (1994).
( )
100
kWH Screw Speed Power Torque
SME
kg Maximum Screw Speed Throughput
Throughput of Extrudates
Throughput was determined by using the method described by
Chevanan et al. (2008). The extrudate produced over a period
of time collecting and weighing in an open pan. The experiment was carried out for five replicates for each run and for each sample products collection after 10 minutes of regular production. The throughput of the extruder at different conditions was determined for each sample.
Experiment at Design
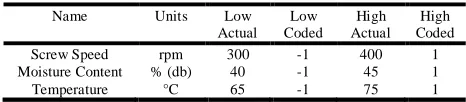
Experiments were conducted according to 3-level Factorial Design. The coded values of the independent variables and their real values are shown in Table.1. Based on the experimental design, trials were conducted and the statistical analysis was carried out by using Design Expert 7.0.0 (Stat-Ease) software and genetic algorithm to obtain the optimized solution. Solution with highest desirability was chosen as the optimal solution.
Table 1. Real and coded value
Name Units Low
Actual Low Coded High Actual High Coded
Screw Speed rpm 300 -1 400 1
Moisture Content % (db) 40 -1 45 1
Temperature °C 65 -1 75 1
Optimization of independent variables
Optimization of processing variables for developed single screw extruder was carried out by Response Surface Methodology and Genetic Algorithm. For this purpose, the experiments were conducted by using 3-level factorial design. Total number of experiments was 32 with 3 independent variables (screw speed, moisture content and barrel temperature) and 5 responses (power consumption, flow rate, specific mechanical energy, water absorption index and water solubility index) where the centre point was replicated five times. The function was assumed to be approximated by a second-degree polynomial equation:
3 3 3
2 0
1 1 1
i i ii i ij i j
i i i
y
b
b x
b x
b x x
(1)Where y is the dependent variable, xi and xj are the coded
independent variables, b0, bi, bij are regression coefficients.
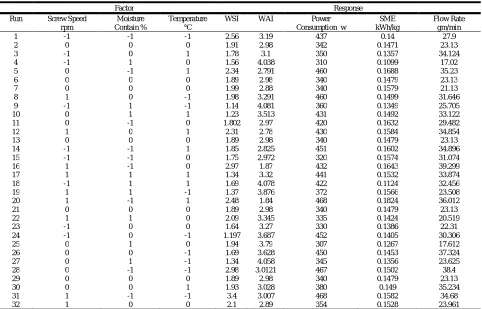
Experiments were conducted as per experimental design. Results obtained during experiments are presented in Table 2.
Statistical Analysis
Analysis of data
The regression analysis was conducted using the “stepwise variable selection backward elimination” procedure for fitting the model represented by the equation to the experimental data. Maximization and minimization of the polynomial thus fitted was performed by numerical techniques and mapping of the fitted responses was achieved using Stat-Ease software (Design Expert 7.0.0. Stat-Ease, MN, USA). The regression equations developed for the extrudate properties (WSI, WAI, Power Consumption, SME, Flow rate) were subsequently used as the objective functions in the genetic algorithm.
Process Optimization Using Genetic Algorithm
of the principles of evolutionary biology. Genetic algorithms used biologically inspired techniques such as genetic
inheritance, natural selection, mutation and sexual
reproduction (recombination, or crossover). Genetic
algorithms are typically implemented using computer simulations in which an optimization problem is specified. For this problem, members of a space of candidate solutions,
called individuals, are represented using abstract
representations called chromosomes. The GA consists of an iterative process that evolves a working set of individuals called a population toward an objective function, or fitness function (Goldberg, 1989). Traditionally, solutions are represented using fixed length strings, especially binary strings, but alternative encodings have also been developed. In genetic algorithm independent variable as a group are expressed by binary numbers 0 and 1. The evolutionary process of a GA is a highly simplified and stylized simulation of the biological version. It starts from a population of individuals, randomly generated according to some probability distribution, usually uniform and updates this population in steps called generations. Each generation, multiple individuals are randomly selected from the current population based upon some application of fitness, bred using crossover and modified through mutation to form a new population.
The goodness of the chromosome in the population is evaluated over a fitness function, which is the objective function of the optimization problem. In genetic algorithm, fitness is used to allocate reproductive traits to the individuals in the population and thus act as some measure of goodness to be maximized. This means that individuals with higher fitness value will have higher probability of being selected as candidates for further examination. Certain genetic operators require that the fitness function be non-negative, although certain operators need not have this requirement. For maximization problems, the fitness function can be considered to be the same as the objective function. For minimization problems, to generate non-negative values in all the cases and to reflect the relative fitness of individual string, it is necessary to map the underlying natural objective function to fitness function form. A number of such transformations are possible.
Iteration
At each step a new population is generated after crossover and mutation operations. The chromosomes are decoded and the new fitness values are computed. The crossover and mutation operations and fitness evaluation are repeated until the fitness values do not change after a certain number of iterations (stopping criteria). The stopping criterion is usually dependent on the best fitness, which does not change after certain number of iterations or time. The representation of decision variables, initial population size, crossover rate, mutation rate and stopping criteria all affect the performance of the genetic algorithm (Shankar and Bandyopadhyay, 2004).
RESULTS AND DISCUSSIONS
Effects of process parameters on dependent variables
Water Solubility Index (WSI)
WSI, often used as an indicator of degradation of molecular
components (Kirby et al. 1988), measures the degree of starch
conversion during extrusion which is the amount of soluble
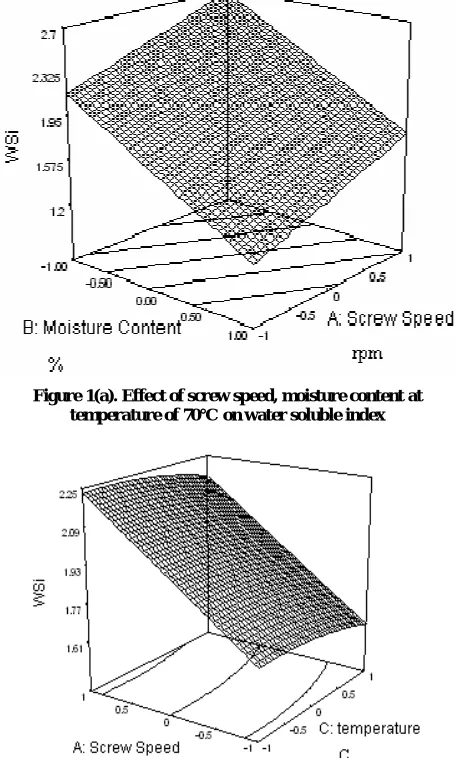
polysaccharide released from the starch component after extrusion. The effects of extrusion conditions on water solubility index of extrudate are shown in Figs. 1(a) 1(b) and 1(c). It was observed that water solubility index of rice extrudate product varied between 1.23 and 2.97.
Figure 1(a). Effect of screw speed, moisture content at temperature of 70°C on water soluble index
Figure 1(b). effect of screw speed, temperature at moisture content of 42.5 % (db) on water soluble index
From ANOVA (Table 3) data set, high model F-value and R2 indicated that the quadratic model can be successfully fitted to the experimental data (p<.001). It was observed from the graphs that increasing screw speed and barrel temperature significantly increased the WSI of extrudate, consistent with the results reported for extrudate wheat products (Singh and Smith, 1997), where as increased feed moisture was observed to result in a significant decrease in the WSI of extrudate, similar effects have been reported earlier for starch, maize
grits, wheat and pea flour (Kirby et al. 1988). The WSI
depends on quantity of soluble which increases due to the
degradation of starch. Wen, et al. (1990) indicated that screw
speed had a direct effect on polysaccharide size distribution. A higher screw speed resulted in more fragmentation than a lower screw speed. A degradation of amylose and amylopectin molecules of maniac starch through chain splitting has been
reported by Guha et al. (1997). It could be, therefore, inferred
that the combined effect of high temperature and high screw speed enhanced the amount of soluble materials in the extrudate. Whereas for the increase of feed moisture resulted in less fragmentation of starch which decreases the quantity of soluble in extrudate, as a result lower WSI for increase of feed moisture content.
Water Absorption Index
The WAI measures the volume occupied by the starch after swelling in excess water, which maintains the integrity of starch in aqueous dispersion. In the present study, it was observed that water absorption index of extrudate product varied between 1.84 and 4.081 (Table 2). From ANOVA
(Table 3) data set, high model F-value and R2 indicated that
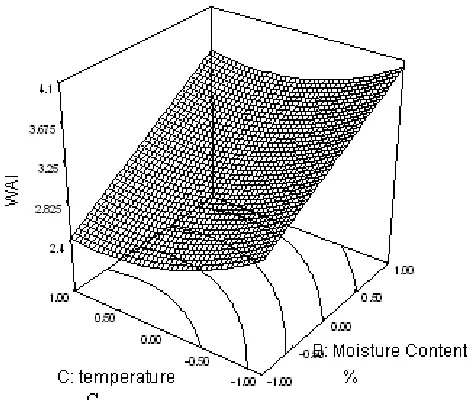
the quadratic model can be successfully fitted to the experimental data (p<.001). It was observed from the graphs (Fig. 2(a), 2(b) and 2(c)) that for the increase of screw speed and temperature, water absorption index of extrudate gradually decrease probably due to increase in starch degradation,
Hagenimana et al. (2006) observed similar type of result for
wheat based expanded extrudate snacks product. Whereas, opposite effect observed in case of moisture content. Water absorption has been generally attributed to the dispersion of
Figure 2(a). Effect of temperature, moisture content at screw speed 350rpm on water absorption index
Figure 2(b). Effect of moisture content, screw speed at temperature 70°C on water absorption index
Figure 2(c). Effect of screw speed, temperature at moisture contain of 42.5 % (db) on water absorption index
starch in excess water and the dispersion is increased by the degree of starch damage due to gelatinization and extrusion-induced fragmentation, that is, molecular weight reduction of
amylose and amylopectin molecules (Rayas-Duarte et al.
1998).
Power Consumption
Power consumption during extrusion cooking of broken rice flour varied from 307 to 468W (Table.2). The highest value for power consumption 468W was obtained at extrusion condition of 75°C, 400 rpm and 40% for barrel temperature, screw speed and feed moisture content respectively, while
70°C barrel temperature, 350 rpm screw speed and 45% (db)
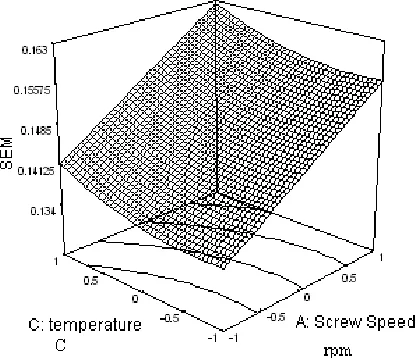
Specific Mechanical Energy
The total SME, defined as the total mechanical energy input to obtain 1 kg of extrudate, varied between 0.1099 and 0.1824 kWH/kg (Table 2). The lowest value 0.1124 kWH/kg of SME
was obtained at high temperature (75°C), low screw speed
(300 rpm) and high feed moisture (45% db). The quadratic model could be fitted to the experimental data and statistical significance (Table 3). The model had moderate F value and
R2 value (0.81) fitted well (p<.001) in relating Specific
mechanical energy (SME) with independent variables. The Model F-value of 23.0967 implies the model is significant. Any variable which affects viscosity would correspondingly
affect SME. It was observed that increase in screw speed increases the SME values as directly proportional to screw speed (Fig .4(a)). These observations are consistent with
previous studies (Guha et al. 1997). SME also decreased with
increasing feed moisture (Fig. 4(b)). Ilo et al. (1999) observed
same pattern of result in rice flour and amaranth blends extrudate product. These results could be explained by the dependence of melt viscosity on temperature, moisture and fat content. In the present study, it was observed that an increase in the temperature increased the SME. This result is in agreement with the findings of Bhattacharya and Choudhury, (1994) during extrusion of rice flour. The decreases in SME with increasing feed moisture could be attributed to the
Table 2. 3-Level factorial design arrangement and responses
Factor Response
Run Screw Speed Moisture Temperature WSI WAI Power SME Flow Rate
rpm Contain % °C Consumption w kWh/kg gm/min
1 -1 -1 -1 2.56 3.19 437 0.14 27.9
2 0 0 0 1.91 2.98 342 0.1471 23.13
3 -1 0 1 1.78 3.1 350 0.1357 34.124
4 -1 1 0 1.56 4.038 310 0.1099 17.02
5 0 -1 1 2.34 2.791 460 0.1688 35.23
6 0 0 0 1.89 2.98 340 0.1479 23.13
7 0 0 0 1.99 2.88 340 0.1579 21.13
8 1 0 -1 1.98 3.291 460 0.1499 31.646
9 -1 1 -1 1.14 4.081 360 0.1349 25.705
10 0 1 1 1.23 3.513 431 0.1492 33.122
11 0 -1 0 1.802 2.97 420 0.1632 29.482
12 1 0 1 2.31 2.78 430 0.1584 34.854
13 0 0 0 1.89 2.98 340 0.1479 23.13
14 -1 -1 1 1.85 2.825 451 0.1602 34.896
15 -1 -1 0 1.75 2.972 320 0.1574 31.074
16 1 -1 0 2.97 1.87 432 0.1643 39.299
17 1 1 1 1.34 3.32 441 0.1532 33.874
18 -1 1 1 1.69 4.078 422 0.1124 32.456
19 1 1 -1 1.37 3.876 372 0.1566 23.508
20 1 -1 1 2.48 1.84 468 0.1824 36.012
21 0 0 0 1.89 2.98 340 0.1479 23.13
22 1 1 0 2.09 3.345 335 0.1424 20.519
23 -1 0 0 1.64 3.27 330 0.1386 22.31
24 -1 0 -1 1.197 3.687 452 0.1405 30.306
25 0 1 0 1.94 3.79 307 0.1267 17.612
26 0 0 -1 1.69 3.628 450 0.1453 37.324
27 0 1 -1 1.34 4.058 345 0.1356 23.625
28 0 -1 -1 2.98 3.0121 467 0.1502 38.4
29 0 0 0 1.89 2.98 340 0.1479 23.13
30 0 0 1 1.93 3.028 380 0.149 35.234
31 1 -1 -1 3.4 3.007 468 0.1582 34.68
32 1 0 0 2.1 2.89 354 0.1528 23.961
Table 3. Analysis of variance for different models
Response Sources Sum of squares df Mean square F R-Squared
y1 Regression 5.9017 5 1.1803 11.8173 0.894
Lack Of Fit 2.5889 21 0.1232 4.7051
Pure Error 0.008 5 0.0016
Cor Total 8.4986 31
y2 Regression 8.1050 5 1.6210 41.7883 0.889
Lack Of Fit 1.0002 21 0.0476 2.8578
Pure Error 0.0083 5 0.0016
Cor Total 9.1136 31
y3 Regression 77883.2 5 15576.6 21.5253 0.885
Lack Of Fit 18811.3 21 895.777 3.4367
Pure Error 3.3333 5 0.6666
Cor Total 96697.9 31
y4 Regression 0.0054 5 0.00109 23.0966 0.816
Lack Of Fit 0.0011 21 5.4E-05 3.1456
Pure Error 8.7E-05 5 1.7E-05
Cor Total 0.0066 31
y5 Regression 1027.11 5 205.422 19.3509 0.788
Lack Of Fit 272.672 21 12.9844 1.9476
Pure Error 3.3333 5 0.6666
changes in melt viscosity. In general increasing barrel temperature and screw speed would both cause a decline in the melt viscosity and consequently, a decrease in SME. The torque required to turn the extruder screw is also related to
degree of fill in the extruder barrel (Akdogan, 1996). At a
constant feed rate, an increase in screw speed decreased the
length of filled flights.
Figure 3(a). Effect of temperature, moisture at a screw speed of 350rpm on power consumption
Figure 3(b). Effect of screw speed, moisture content at temperature of 70 °C on power consumption
Figure 3(c). Effect of screw speed, temperature at moisture content of 42.5 % (db) on power consumption
Figure 4(a). Effect of moisture content, screw speed at temperature of 70 °C on specific mechanical energy
Figure 4(b). Effect of temperature, moisture content at screw speed of 350rpm on specific mechanical energy
This resulted in a decrease in the load on the screw shaft motor. Thus, the extruder torque was reduced. However, as shown in the surface plot (Fig. 5), SME increased proportional to the screw speed, This result indicated that the effect of screw speed dominated the effect of melt viscosity, as reported in other studies (Akdogan, 1996). On the contrary, increasing feed moisture content, lowering the melt viscosity did not result in a lower SME. This could be due to the relatively narrow feed moisture range used in the study.
Throughput of Extrudate
Throughput is a parameter that determines production efficiency in terms of production output per unit time. In the present study the extrusion cooking of broken rice flour varied between 17.02 and 39.299 gm/min (Table 2). The highest value for throughput 39.299 gm/min was obtained at extrusion condition of 70°C, 400 rpm and 40% for barrel temperature, screw speed and feed moisture content respectively, while 70°C barrel temperature, 300 rpm screw speed and 45% feed moisture content produced the least through- put of 17.02 gm/min. Throughput was observed to be positively correlated with barrel temperature and screw speed of extruder. Response surface plots of interactions amongst the process variables as they affected throughput in this study are shown in Figures 5(a), 5(b) and 5(c).
Figure 5(a). Effect of moisture content, screw speed at temperature of 70°C on flow rate
Figure 5(b). Effect of temperature, screw speed at moisture content of 42.5 % (db) on flow rate
Figure 5(c). Effect of temperatures, moisture content at screw speed of 350rpm on flow rate
Table 4. Individual and common optimized solution for maximum WSI, maximum WAI, maximum flow rate, minimum
power consumption and minimum specific energy
Dependent variable Independent variable
Screw Speed ( rpm)
Moisture (% db)
Temperature (°C)
WSI 394 44.94 74.85
WAI 381 40 65
Power consumption (W) 300 40 65
SME (kWh/kg) 300 45 65
Flow rate (g/min) 378 45 75
common 323 44.59 65.82
Throughput gradually and rapidly increased with increase in screw speed but marginally increased with increase in barrel temperature. Both feed moisture content and barrel temperature had marginal effect on throughput over other process variables used in this study.
Diagnostic checking of the fitted model
After model reduction, the regression coefficients were obtained for all the models. Regression analyses for different models indicated that the fitted quadratic models accounted for more than 80 % of the variations in the experimental data, which were found to be highly significant. Multiple regression equations were generated relating to water solubility index
(y1), water absorption index (y2), power consumption (y3),
specific mechanical energy (y4), flow rate (y5) to coded levels
of the variables; screw speed (x1), feed moisture content (x2),
barrel temperature (x3).
WSI (y1) =1.95+0.27*x1-0.47*x2-0.039 *x3+0.22*x2*x3-0.028*x32 5.1
WAI (y2) =3.07-0.28*x1+0.53*x2-0.25*x3+0.054*x2*x3+0.22*x32 5.2
Power Consumption (y3) =346.43+18.22*x1-33.33*x2+1.22*x3+
17.50*x2*x3+ 78.24* x32 5.3
SEM (y4) =0.15+0.010*x1-0.012*x2+3.228e-003*x3-6.275e-003
*x2*x3+2.352e-03*x32 5.4
Flow Rate (y5) =24.15+1.25*x1-4.42*x2+2.04*x3+1.79*x2*x3+
8.24*x32 5.5
The linear, quadratic and interaction were calculated for each model. The correlation coefficients for all the responses are
quite high for response surfaces. The screw speed (x1) has
positive linear effects for all responses, whereas, it has no
quadratic effect on responses. The feed moisture content (x2)
absorption index (y2), whereas, the quadratic effect with
combination with barrel temperature (x3) has negative for
specific mechanical energy (y4) and positive for all other
responses. Barrel temperature has all types of relationship with responses. It has negative linear relationship with WAI, WSI and SME and other have positive linear relationship. Combination with feed moisture contains, barrel temperature has negative effect only on specific mechanical energy and other has positive effect. In case of quadratic relationship except WSI, all other have positive relationship with barrel temperature. An analysis of variance for all the responses is presented in Table 3. The F values for water solubility index, water absorption index, power consumption, specific mechanical energy, flow rate were 11.81, 41.78, 21.52, 23.09 and 19.35 respectively. The values of the lack of fit for all the models were not significant relative to the pure error. On these bases, it can be concluded that the selected models adequately represent the data for all the responses.
Optimization of Individual and common process condition
To find out the optimal solution, of the independent processing parameters, statistical optimization was done, with the help of genetic algorithm. The program developed for optimization using genetic algorithm was used in the present study. The program was developed in Mat Lab R2008a language to make it user-friendly. The development program included writing procedures to create an initial population, to calculate the probability of selection, to identify individuals for crossover and elements for mutation, for reproduction and calculation of fitness value. The objective function used was the regression equation (Eq.1). The objective function used to evaluate the fitness values of each individual extrudate property as the second-order polynomial regression equations obtained using RSM. Random populations of 100 chromosomes were generated. Selection of good chromosomes was based on fitness values at a crossover rate of 0.75, mutation probability 0.05 and degree of precision are 0.01, 0.001 and 0.001. The search was stopped after 50 generation and the corresponding results were displayed. The objective of the optimization was to determine the combination of values of process variables like screw speed (rpm), barrel, temperature (°C), feed moisture content (%) which will be in the range and maximize the flow rate, WSI and WAI value as well as minimize power consumption and specific mechanical energy during extrusion. Common and individual optimum values of process parameter are given in Table 5 the common optimum condition were screw speed 323 rpm, feed moisture content 44.59 % (db),
barrel temperature 65.82°C. The product obtained in the
common optimum condition, values of experimental independent variables were water Solubility index 2.853 and water absorption index 3.021, power consumption 309.12 W, specific mechanical energy 0.164 kWh/kg and flow rate 38.632 g/min.
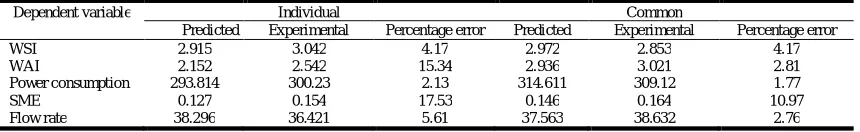
Table 5 shows the extrudate properties obtained at the individual and common optimum process conditions. The values show that all the values of experimental extrudate properties matched the predicted values more closely in the case of common optimum conditions than in the case of individually optimized conditions. The percentage errors of extrudate properties were higher in case of individually optimized conditions than common optimized condition.
Conclusion
Change of extrusion conditions, feed moisture content, screw speed and barrel temperature, affected the extruder system parameters and physical properties of the rice based snack. High water solubility index and low water absorption index observed at high screw speed and high barrel temperature, whereas, opposite effect were observed in the case of moisture content. It was observed that increase in screw speed increases the SME, throughput and power consumption rapidly. Both feed moisture content and barrel temperature had marginal effect on throughput. Optimum process conditions for rice snack by single-screw extrusion, established using response surface methodology and genetic algorithm. The individual and common optimum process conditions obtained using RSM and GA, was precisely pinpointed and varied within the experimental limits. The common optimum value of parameters were 323 rpm, 44.59 % (db) and 65.82°C for screw speed, moisture content and barrel temperature respectively. The values show that all the values of experimental extrudate properties matched the predicted values more closely in the case of common optimum conditions than in the case of individually optimized conditions. The percentage errors of extrudate properties were higher in case of individually optimized conditions than common optimized condition.
REFERENCE
Akdogan, H., 1996. Pressure, torque and energy responses of a twin screw extruder at high moisture contents. Food Res
Int, 29(56):423-429.
Bhattacharya, S., Choudhury, G.S. (1994): Twin-screw extrusion of rice flour: Effect of extruder length-to-diameter ratio and barrel temperature on extrusion parameters and product characteristics. J Food Pro & Pres, 18(5):389-406.
Bhattacharya, S., Prakash, M, (1994): Extrusion cooking of blends of rice and chickpea flour: A response surface
analysis. J Food Eng. 21:315-330.
Brent, Jr. J.L., S.J. Mulvaney., C. Cohen., J. A. Bartsch, (1997): Thermo-mechanical glass transitions of extruded cereal melts. J Cereal Sci, 26(3):301-312.
Chevanan, N., K.A. Rosentrater., K. Muthukumarappan, (2008): Effect of DDGS, moisture content and screw speed on physical properties of extrudates in single-screw extrusion. J Cereal Chem, 85(2):132-139.
Table 5. Experimental and predicted values of maximum WSI, maximum WAI maximum flow rate, minimum power consumption and minimum specific energy for optimized process condition
Dependent variable Individual Common
Predicted Experimental Percentage error Predicted Experimental Percentage error
WSI 2.915 3.042 4.17 2.972 2.853 4.17
WAI 2.152 2.542 15.34 2.936 3.021 2.81
Power consumption 293.814 300.23 2.13 314.611 309.12 1.77
SME 0.127 0.154 17.53 0.146 0.164 10.97
Das, H. (2005): Food Processing Operations Analysis. Asian Books publication, New Delhi.
Goldberg, D.E. (1989): Genetic Algorithms in Search, Optimization and Machine Learning. Addison-Wesley. London, U.K.
Goldberg, D.E. (2001): Genetic Algorithms in Search, Optimization and Machine Learning. Pearson Education, Singapore.
Guha, M., Ali, S.Z., Bhattacharya, S. (1997): Twin-screw extrusion of rice flour without a die: Effect of barrel temperature and screw speed on extrusion and extrudate characteristics. J Food Eng, 32(3):251-267.
Hagenimana, A., X. Ding and T. Fang, (2006): Evaluation of rice flour modified by extrusion cooking. J Cereal Sci, 43(1):38-46.
Harper, J.M. (1981): Extrusion of Foods. Vol. 1-2, CRC Press Inc., Boca Raton, FL., ISBN: 08-49352045: 1-212. Holland, J.H. (1992): Genetic algorithms. Scientific American,
66–72.
Ilo, S., Y, Liu., E, Berghofer, (1999): Extrusion Cooking of Rice Flour and Amaranth Blends. LWT - Food Sci Tech, 32(2):79-88.
Khuri, A. L., Cornell, J. A. (1987): Response Surfaces: Design and Analysis. Marcel Dekker, New York.
Kirby, A.R., Ollett, A. L., Parker, R., Smith, A.C. (1988): An experimental study of screw configuration effects in the twin-screw extrusion-cooking of maize grits. J Food Eng, 8(4):247-272.
Rayas-Duarte, P., Majewska, K., Doetkott, C. (1998): Effect of extrusion process parameters on the quality of buckwheat flour mixes. J Cereal Chem, 75(3):338-345.
Sacchetti, G., Pinnavaia, G.G., Guidolin, E., M, Dalla Rosa, (2004): Effects of extrusion temperature and feed composition on the functional, physical and sensory properties of chestnut and rice flour-based snack-like products. Food Res Int, 37:527–534.
Shankar, T.J., Bandyopadhyay, S. (2004): Optimization of extrusion process variables using a genetic algorithm. Food Bioprod Process. 82(C2):143–150.
Shankar, T.J., Bandyopadhyay. S. (2005): Process variables during single screw extrusion of fish and rice flour blends. J Food Process & Pres, 29:151–164.
Singh, N., Smith, A. C. (1997): A comparison of wheat starch, whole wheat meal and oat flour in the extrusion cooking process. J Food Eng, 34(1):15-32.
Stojceska, V., Ainsworth, P., Plunkett, A., S.I. Iu (2008): The recycling of brewer's processing by-product into ready-to-eat snacks using extrusion technology. J Cereal Sci, 47(3):469-479.
Wen, L.F., Rodis, P., Wasserman, B. P. (1990): Starch fragmentation and protein insolubilization during twin-screw extrusion of corn meal. Cereal Chem, 67(3):268-275.