ISSN: 2149-214X
www.jeseh.net
The Development and Validation of
Turkish Version of the Elementary
Teachers' Efficacy and Attitudes towards
STEM (ET-STEM) Scale
Emine Sahin-Topalcengiz 1,2, Bekir Yildirim2
1İstanbul University- Cerrahpasa 1,2Muş Alparslan University
To cite this article:
Sahin-Topalcengiz, E. & Yildirim, B. (2019). The development and validation of Turkish
version of the elementary teachers' efficacy and attitudes towards STEM (ET-STEM) scale.
Journal of Education in Science, Environment and Health (JESEH), 5(1), 12-35.
DOI:10.21891/jeseh.486787
This article may be used for research, teaching, and private study purposes.
Any substantial or systematic reproduction, redistribution, reselling, loan, sub-licensing,
systematic supply, or distribution in any form to anyone is expressly forbidden.
Authors alone are responsible for the contents of their articles. The journal owns the
copyright of the articles.
DOI:10.21891/jeseh.486787
The Development and Validation of Turkish Version of the Elementary
Teachers' Efficacy and Attitudes towards STEM (ET-STEM) Scale
Emine Sahin-Topalcengiz, Bekir Yildirim
Article Info
Abstract
Article History
Received: 12 June 2018
The purpose of this study was to adapt the Elementary Teachers Efficacy and Attitudes towards STEM Survey (ET-STEM scale; Friday Institute for Educational Innovation, 2012) into Turkish and test the validity and reliability of the instrument. ET-STEM was administered to 313 elementary teachers from different provinces of Turkey. Exploratory and confirmatory factor analyses were conducted to examine the structural validity of the scale. According to exploratory factor analysis results, the ET-STEM survey consists of nine factors. The values of Cronbach's alpha of the factors ranged from 0.891 to 0.964, and corrected item-total scale correlation ranged from 0.313 to 0.417. After the exploratory factor analysis performed, the ET-STEM was administered to 213 elementary school teachers. The results obtained from the confirmatory factor analyses demonstrated adequate reliability and validity for measuring the STEM competencies and attitudes of elementary school teachers.
Accepted: 07 November 2018
Keywords
STEM Validate Reliable Teacher
Introduction
Engineering and science industries are vital source of developed countries‟ economic growth. It is therefore not surprising to see substantial increase in interest and investment in science, technology, engineering, and mathematics (STEM) education from governments. In today‟s world, global competitiveness requires countries bring innovation and their capacity to innovate to market (MITRE, 2016). Developed countries came to the realization that a blended, well-reasoned, and “whole-of-government” approach is required to foster innovation, boost productivity and economic growth. Different organizations in developed countries work together to engage young people with STEM, offers professional development opportunities and the curriculum resources for teachers. One developed country example is The United States launched the “Educate to Innovate” initiative to improve American student‟s capabilities in the areas of STEM. The push for improving STEM education has been a priority for the USA for the following reasons: (1) the lack of information on STEM subjects (2) a shortage in STEM professionals (3) the lack of information on STEM professional areas (4) young people‟s negative perceptions and decreased interest of STEM subjects (Ostler, 2012; Atkinson and Mayo, 2010; Kelley & Knowles, 2016). To address the status of STEM and to reach STEM-related goals, the US and other nations paid attention to STEM education in K12 and college level.
The acronym STEM is a simple acronym, but the definitions of STEM may vary. STEM is often considered viewing different disciplines, those are science, mathematics, technology, and engineering, as a unit. Science, technology, and innovation are important drivers of economic growth in nations. Economic growth relies on generating new ideas and knowledge that can be used to solve a given problem. Any nations that fails to integrate basic and applied research knowledge over international average will be left behind developed countries. Friedman (2005) used a metaphor, “flat world”, to describe globalization. More people on the planet participate in economic, cultural, and political activities on a global scale. This means that the way people, information, money, services, and goods supply has changed. When the job market is global, employer can find needed talents from anywhere in the world. When the services and goods are needed, developing countries, such as China, and India, will offer cheap, the same quality products and companies would prefer them to buy. The current situation shows policymakers that countries‟ citizens lives will be affected by others who live in distant lands. This concerns in developed countries, pushed them to make changes in their education systems, make them questioned their current education pedagogy.
self-control, critical thinking skills, communication and self-regulation skills (NRC, 2010). With all the possible benefits of STEM education, it is important to support teachers, their teaching practices and teachers‟ self-efficacy. Additionally, materials should be supplied to implement STEM subjects in the classroom.
Successful integration of STEM areas largely depends on teachers‟ knowledge about STEM subjects, beliefs, teachers‟ pedagogical content knowledge, 21st century skills knowledge, and integration knowledge (Yildirim, 2017; Benuzzi, 2015; Hudson, English, Dawes, King, & Baker, 2015; Karakaya & Avgın, 2016; Rogers, Winship, & Sun, 2015; Stohlmann, Moore, & Roehrig, 2012; Wang, 2012; Wang, Moore, Roehring, & Park, 2011; Nadelson et al., 2013). Teacher beliefs are linked to behavior and shape their attitudes about teaching, about students, and about their abilities (Bandura, 1982). Beliefs influence teacher behaviors‟ in the classroom, teacher planning, decision making (Pajares, 1992; Pintrich & De Groot, 1990; Wallace & Kang, 2004). Teacher beliefs include beliefs about teaching and learning, beliefs about students, beliefs about teachers‟ role in the classroom, teachers‟ responsibilities, teachers‟ abilities (Bayraktar, 2011; Pressley et al., 2003). Teachers‟ belief together with attitudeand self-efficacy plays a central role in teachers‟ approach to teach STEM. When teachers are comfortable with STEM content, it affects students‟ success in the classroom, their motivation to the subject, and their perception towards the lessons (Beilock, Gunderson, Ramirez, & Levine, 2010; Tschannen-Moran & Woolfolk Hoy, 2001). Teachers‟ self-efficacy also influence students‟ success and implementation of STEM pedagogy in the classroom (Klassen & Chiu, 2010; Nadelson, Seifert, Moll, & Coats, 2012). Since teacher self-efficacy is content specific, teacher self-self-efficacy of STEM should be examined within the context and expectations of STEM pedagogy. The context of self-efficacy includes different factors: content knowledge, classroom management, engagement, and outcomes.
In a review of research published in science education, different instruments were developed to assess teacher efficacy (Tepe, 2011; Tekerek, Karakaya, & Tekerek, 2016; Bıkmaz, 2002; Bayraktar, 2011). These self-efficacy instruments were created and tested to assess teacher general aspects of self-self-efficacy (Yoon, et al.,2012). Some widely used instruments are: Teacher Efficacy Scale (TESS) (Gibson & Dembo, 1984), The Science Teaching Efficacy Belief instrument (STEBI) (Riggs and Enochs,1990), The Self-Efficacy Beliefs About Equitable Science Teaching (SEBEST) (Ritter, Boone & Rubba, 2002). The 30-item scale called Teacher Efficacy scale (TES) was constructed to investigate the relationship between teacher self-efficacy and teacher behaviors in the classroom (Gibson & Dembo, 1984). Another instrument called the Science Teaching Efficacy Belief instrument (STEBI) was developed by Riggs and Enochs (1990) to measure science teaching efficacy beliefs among preservice teachers. Similar to these instruments, other instrument The Self-Efficacy Beliefs About Equitable Science Teaching (SEBEST) was designed to measure the socioeconomic factors effects on teacher self-efficacy beliefs in science teaching and learning (Ritter, Boone & Rubba, 2002). Another content-specific instruments were developed to measure teacher self-efficacy beliefs in math teaching (The Mathematics Teaching Efficacy Belief Instrument (MTEBI): Enochs, Smith & Huinker, 2000), in language and literacy (Graham, Harris, & Fink, 2001), in technology (Pan & Franklin, 2011; L. Wang, Ertmer, & Newby, 2004) and in engineering (Yoon Yoon, Evans, & Strobel, 2012).
Even though researchers have developed different self-efficacy instruments for teachers in various setting, there are only a few instruments widely used in STEM education. These instruments are the General Perceived Self-Efficacy Scale (also known as the General Self-Self-Efficacy Scale (Dunlap, 2005; Jerusalem & Schwarzer, 1992), the Academic Self-Efficacy Scale (Painter & Bates, 2012; Pintrich & DeGroot, 1990), the Baldwin Confidence Survey Form (Baldwin, Ebert-May, & Burns, 1999), the Student Attitudes toward STEM Survey (S-STEM) survey (Friday Institute for Educational Innovation, 2012b), the Teaching Engineering Self-Efficacy Scale (TESS) (Yoon et al., 2012). Though different instruments exist in the literature, none of them was originally designed to measure teachers‟ self-efficacy in STEM in general. A STEM education instrument, Teacher Efficacy and Attitudes Toward STEM (ET-STEM) Survey, was developed to measure changes in elementary teachers‟ confidence and self-efficacy in STEM subjects (science and mathematics), use of technology in the classroom, 21st century learning skills, leadership attitudes, and STEM career awareness (Friday Institute for Educational Innovation, 2012).
Method
Hambleton and Patsula (1999)‟s adaptation process was followed in the study. The adaptation process includes following steps; (1) translation of the whole scale from original language (English) to target language (Turkish), (2) experts meet and through a dialogue decide on the best version of each item, (3) validity and reliability of the adopted scale was calculated by Exploratory Factor Analysis (EFA), Confirmatory Factor Analysis (CFA). The translation of the scale was carried out in five stages: (Stage 1) Necessary permissions obtained from Friday Institute for Educational Innovation via email; (Stage 2) After permissions were received from the institute, two experts who were fluent in Turkish and English were invited for translation and back-translation procedures; (Stage 3) To translate the first revised draft of the scale to Turkish, two different experts were invited to English translation process; (Stage 4) Pilot study with three elementary teachers; (Stage 5) Finalization of the Turkish version of the scale. After Friday Institute permission for translation of the scale, two experts who were fluent in Turkish and English translated the scale to Turkish independently, Afterwards, unclear and translated items were examined by the authors and experts. The authors, experts and translators reached a consensus regarding to unclear items and made necessary editing. This version of the scale was translated into English by two language experts. When translation was determined in equivalence between the original ET-STEM scale and the translated form, a pilot ET-STEM scale was administered to three elementary teachers to determine teachers‟ misunderstandings. Afterwards, the scale was administered to 526 elementary teachers.
Participants
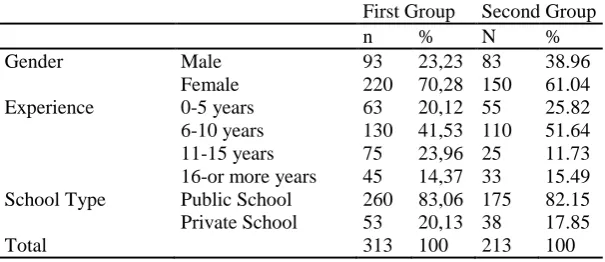
Two independent samples were used in the study. The first sample included 313 elementary teachers, of whom 93 male, 220 females; the second group consisted of 213 elementary teachers, of whom 83 male, 150 females. The experience of the study participants ranged from 1 years to more than 16 years. The participants of this research study are the teachers working for public and private schools (Detailed demographic characteristics of the elementary teachers were shown in Table 1). Exploratory factor analysis (EFA) was carried out on data collected from 313 elementary teachers and the confirmatory factor analysis (CFA) was conducted with second group, 213 elementary teachers. Different sample groups were selected for running exploratory and confirmatory factor analysis to not to replicate the results obtained in EFA. Before participants completed the scale; the teachers were informed about the purpose of this study and were reminded of their right to withdraw from the study at any time. All elementary teachers had volunteered for the study and received no award for their participation.
Table 1. Demographic characteristics of elementary teacher participants First Group Second Group
n % N %
Gender Male 93 23,23 83 38.96
Female 220 70,28 150 61.04
Experience 0-5 years 63 20,12 55 25.82
6-10 years 130 41,53 110 51.64 11-15 years 75 23,96 25 11.73 16-or more years 45 14,37 33 15.49 School Type Public School 260 83,06 175 82.15 Private School 53 20,13 38 17.85
Total 313 100 213 100
Data Analysis
recommended a minimum sample size of 200 to obtain reliable results in order to conduct factor analyses. The varimax rotation applied in this study. The varimax rotation produce simple solutions and each factor has small number of variables. This simplifies the interpretation (Kieffer, 1998). While running confirmatory factor analysis, the Goodness of Fit Index (GFI), the Adjusted Goodness of Fit Index (AGFI), the Root Mean Square Error of Approximation (RMSEA), the Comparative Fit Index (CFI), Standardized Root Mean Square Residual (SRMR), Incremental Fit Index (IFI), and the Normed Fit Index (NFI) statistics were used (Baumgartner & Homburg, 1996; Bentler, 1980; Brown, 2006; Field, 2009; Kılıç & Şen, 2014). Moreover, the correlation analysis was run for determining the relationship(s) between subscales of the STEM scale. The validity and reliability analyses of the scale were calculated using SPSS Statistics (Version 21.0) and LISREL (Version 8). The results of the exploratory and confirmatory factor analyses of the ET-STEM Scale are explained below
Elementary Teacher Efficacy and Attitudes toward STEM (ET-STEM) Scale
The Elementary Teacher Efficacy and Attitudes towards STEM Scale was developed by Friday Institute for Educational Innovation (2012). While developing scale, 228 elementary teachers participated in the study and only an exploratory factor analysis was conducted. Exploratory factor analysis identified nine dimensions with 83 items using a five-pint Likert scale.
Table 2. ET-STEM survey reliability
Construct Number of
Items
Cronbach‟s Alpha Elementary (n=228)
Science Teaching Efficacy and Beliefs 11 .905
Mathematics Teaching Efficacy and Beliefs 11 .939
Science Teaching Outcome Expectancy Beliefs 9 .854
Mathematics Teaching Outcome Expectancy Beliefs 9 .895
Student Technology Use 8 .943
STEM Instruction 14 .950
21st Century Learning Attitudes 11 .948
Teacher Leadership Attitudes 6 .870
STEM Career Awareness 4 .945
Constructs of ET-STEM Scale
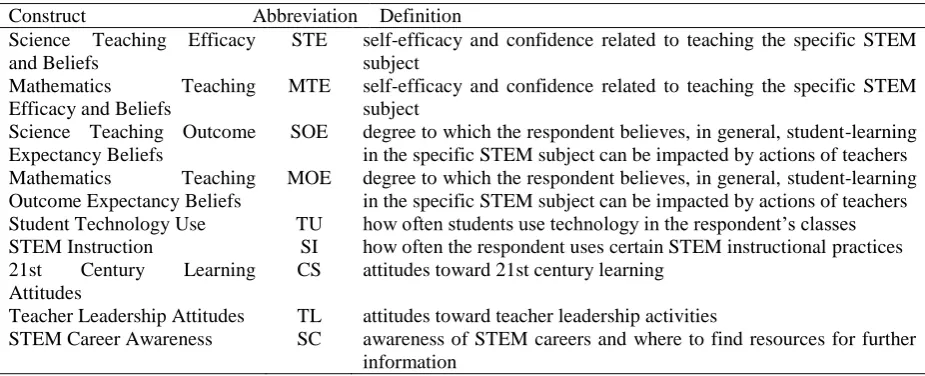
The ET-STEM Scale consisted of nine sub-dimensions. These dimensions were follows as: “STEM Instruction (SI)”, “21st-Century Learning Attitudes (CS)”, “Science Teaching Efficacy And Beliefs (STE)”, “Mathematics
Teaching Efficacy And Beliefs (MTE)”, “Student Technology Use (TU)”, Teacher Leadership Attitudes (TL)”, “Science Teaching Outcome Expectancy (SOE)”, “Mathematics Teaching Outcome Expectancy (MOE)”, “STEM Career Awareness (SC)”. The structures, abbreviations and definitions related to the mentioned nine sub-dimensions of ET-STEM were shown in Table 3 (Friday Institute for Educational Innovation, 2012).
Table 3. Definitions of the constructs of the ET-STEM scale
Construct Abbreviation Definition
Science Teaching Efficacy and Beliefs
STE self-efficacy and confidence related to teaching the specific STEM subject
Mathematics Teaching Efficacy and Beliefs
MTE self-efficacy and confidence related to teaching the specific STEM subject
Science Teaching Outcome Expectancy Beliefs
SOE degree to which the respondent believes, in general, student-learning in the specific STEM subject can be impacted by actions of teachers Mathematics Teaching
Outcome Expectancy Beliefs
MOE degree to which the respondent believes, in general, student-learning in the specific STEM subject can be impacted by actions of teachers Student Technology Use TU how often students use technology in the respondent‟s classes STEM Instruction SI how often the respondent uses certain STEM instructional practices 21st Century Learning
Attitudes
CS attitudes toward 21st century learning Teacher Leadership Attitudes TL attitudes toward teacher leadership activities
Results
Exploratory Factor Analysis was conducted with the first group. While using an EFA, the aim was to determine dimensions of the scale and the number of items. Before running an EFA analyses, Kaiser-Meyer-Olkin (KMO) and Barlett test were utilized. The KMO value of 83 items was calculated as 0.788 and the Bartlett test was found to be meaningful (χ2 28911,185 df= 3403, p < .05). Therefore, the data from Turkish elementary teachers
were appropriate to run an EFA.
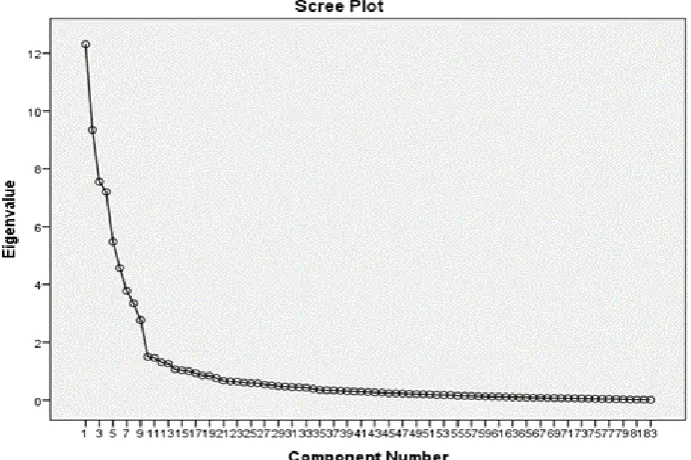
According to Büyüköztürk (2006), when KMO coefficient was greater than 0.60 and the Barlett test was significant, the EFA would be run. Varimax analysis was performed for the ET-STEM. Varimax analyses gather together factors with high correlations (Doğan, 2011). According to Kaiser (1960), one must consider whether a measure is more than an attribute value of 1 in factor selection. Based on the varimax analysis, nine factors‟ eigenvalues were found to be greater than 1. To calculate eigenvalue, a scree plot method was used. Figure 1 shows the maximum number of factors.
Figure 1. Scatter graph
Reliability Evidence
The ET-STEM's internal consistency coefficients were calculated, and the Cronbach‟s αs for each factor is presented in Table 4. The Cronbach α value of the ET-STEM scale and the subscale values were high. All values were greater than .70 (Tavşancıl, 2002), meaning good reliability evidence. The results of the EFA statistics of the ET- STEM scale (See Table 4).
Table 4. Internal consistency reliability coefficients of ET-STEM scale
Construct Cronbach‟s α
STEM Instruction .964
21st Century Learning Attitudes .935
Science Teaching Efficacy and Beliefs .956 Mathematics Teaching Efficacy and Beliefs .908
Student Technology Use .944
Teacher Leadership Attitudes .957
Science Teaching Outcome Expectancy .902 Mathematics Teaching Outcome Expectancy .891
STEM Career Awareness .917
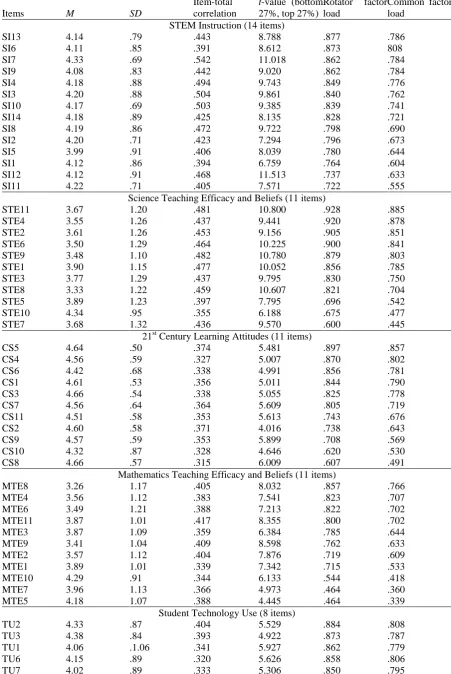
Table 5. Results of the exploratory factor analysis of ET-STEM scale
Items M SD
Item-total correlation
t-value (bottom 27%, top 27%)
Rotator factor load
Common factor load
STEM Instruction (14 items)
SI13 4.14 .79 .443 8.788 .877 .786
SI6 4.11 .85 .391 8.612 .873 808
SI7 4.33 .69 .542 11.018 .862 .784
SI9 4.08 .83 .442 9.020 .862 .784
SI4 4.18 .88 .494 9.743 .849 .776
SI3 4.20 .88 .504 9.861 .840 .762
SI10 4.17 .69 .503 9.385 .839 .741
SI14 4.18 .89 .425 8.135 .828 .721
SI8 4.19 .86 .472 9.722 .798 .690
SI2 4.20 .71 .423 7.294 .796 .673
SI5 3.99 .91 .406 8.039 .780 .644
SI1 4.12 .86 .394 6.759 .764 .604
SI12 4.12 .91 .468 11.513 .737 .633
SI11 4.22 .71 .405 7.571 .722 .555
Science Teaching Efficacy and Beliefs (11 items)
STE11 3.67 1.20 .481 10.800 .928 .885
STE4 3.55 1.26 .437 9.441 .920 .878
STE2 3.61 1.26 .453 9.156 .905 .851
STE6 3.50 1.29 .464 10.225 .900 .841
STE9 3.48 1.10 .482 10.780 .879 .803
STE1 3.90 1.15 .477 10.052 .856 .785
STE3 3.77 1.29 .437 9.795 .830 .750
STE8 3.33 1.22 .459 10.607 .821 .704
STE5 3.89 1.23 .397 7.795 .696 .542
STE10 4.34 .95 .355 6.188 .675 .477
STE7 3.68 1.32 .436 9.570 .600 .445
21st Century Learning Attitudes (11 items)
CS5 4.64 .50 .374 5.481 .897 .857
CS4 4.56 .59 .327 5.007 .870 .802
CS6 4.42 .68 .338 4.991 .856 .781
CS1 4.61 .53 .356 5.011 .844 .790
CS3 4.66 .54 .338 5.055 .825 .778
CS7 4.56 .64 .364 5.609 .805 .719
CS11 4.51 .58 .353 5.613 .743 .676
CS2 4.60 .58 .371 4.016 .738 .643
CS9 4.57 .59 .353 5.899 .708 .569
CS10 4.32 .87 .328 4.646 .620 .530
CS8 4.66 .57 .315 6.009 .607 .491
Mathematics Teaching Efficacy and Beliefs (11 items)
MTE8 3.26 1.17 .405 8.032 .857 .766
MTE4 3.56 1.12 .383 7.541 .823 .707
MTE6 3.49 1.21 .388 7.213 .822 .702
MTE11 3.87 1.01 .417 8.355 .800 .702
MTE3 3.87 1.09 .359 6.384 .785 .644
MTE9 3.41 1.04 .409 8.598 .762 .633
MTE2 3.57 1.12 .404 7.876 .719 .609
MTE1 3.89 1.01 .339 7.342 .715 .533
MTE10 4.29 .91 .344 6.133 .544 .418
MTE7 3.96 1.13 .366 4.973 .464 .360
MTE5 4.18 1.07 .388 4.445 .464 .339
Student Technology Use (8 items)
TU2 4.33 .87 .404 5.529 .884 .808
TU3 4.38 .84 .393 4.922 .873 .787
TU1 4.06 .1.06 .341 5.927 .862 .779
TU6 4.15 .89 .320 5.626 .858 .806
TU5 3.90 .84 .390 4.508 .803 .735
TU8 4.33 .90 .311 4.474 .708 .685
TU4 3.55 1.07 .364 5.897 .701 .585
Science Teaching Outcome Expectancy ( 9 items)
SOE7 4.14 .78 .300 2.566 .842 .733
SOE2 4.15 .82 .313 3.335 .789 .643
SOE1 3.99 .88 .319 4.073 .782 .626
SOE4 3.67 .96 .390 2.597 .781 .661
SOE6 3.80 .82 .380 2.254 .754 .648
SOE3 4.19 .82 .340 2.564 .740 .575
SOE8 4.38 .79 .347 4.357 .704 .526
SOE9 4.06 .90 .310 2.088 .674 .484
SOE5 3.40 1.09 .367 3.101 .643 .464
Teacher Leadership Attitudes (6 items)
TL4 4.65 .62 .340 5.884 .924 .910
TL5 4.66 .61 .411 6.605 .890 .884
TL3 4.67 .61 .301 4.653 .880 .805
TL6 4.57 .64 .311 4.629 .878 .767
TL5 4.66 .65 .411 6.605 .870 .884
TL1 4.62 .66 .397 4.255 .838 .818
Mathematics Teaching Outcome Expectancy (9 items)
MOE7 4.07 .78 .391 5,654 .812 .671
MOE4 3.58 1.01 .336 6,388 .788 .680
MOE3 4.06 .82 .382 5,705 .749 .605
MOE6 3.60 1.03 .380 7,434 .748 .614
MOE5 3.53 .96 .334 4,577 .716 .540
MOE1 3.81 .86 .378 5.164 .704 .524
MOE8 4.26 .87 .344 5,197 .697 .494
MOE2 4.01 .86 .313 3.517 .641 .470
MOE9 3.99 1.00 .381 4.056 .619 .440
STEM Career Awareness (4 items)
SC4 4.18 .88 .335 4.515 .795 .833
SC2 4.20 .70 .325 4.080 .793 .842
SC3 4.21 .88 .381 3.469 .777 .762
SC1 4.11 .86 .351 3.400 .681 .722
* factor loads value is lower than .30 were not shown in table (Çokluk, Şekercioğlu, & Büyüköztürk, 2014).
The Cronbach‟s Alpha value was .917 for the entire ET-STEM scale, .964 for the STEM Instruction dimension, .935 for the 21st-century learning attitudes dimension, .956 for Science Teaching Efficacy and Beliefs dimension, .908 for Mathematics Teaching Efficacy and Beliefs dimension, .944 for Student technology use dimension, .957 for teacher leadership attitudes dimension, .902 for the Science Teaching Outcome Expectancy dimension, .891 for the Mathematics Teaching Outcome Expectancy dimension and .917 for the STEM career Awareness dimension.
Alpha coefficients were calculated for Science Instruction dimension, 21st-century learning attitudes, Science Teaching Efficacy and Beliefs, Mathematics Teaching Efficacy and Beliefs Student technology use, teacher leadership attitudes, the Science Teaching Outcome Expectancy, the Mathematics Teaching Outcome Expectancy and STEM career Awareness factors and found all were higher than .70 (Tavşancıl, 2002).
with factor loads ranging from .838 to .924; Mathematics Teaching Outcome Expectancy consisted of 9 items with factor loads ranging from .619 to .812 and STEM Career Awareness consisted of 4 items with factor loads ranging from.681 to .795.
Confirmatory Factor Analysis
Figure 2. CFA result of ET-STEM scale
If the GFI and AGFI values are higher than 0.90 (Hooper, Coughlan, & Mullen, 2008; Sümer, 2000) and the RMR and RMSEA values are lower than 0.05 (Jöreskog & Sörbom, 1993; Sümer, 2000), the model-data fit is good. Nevertheless, if the GFI value is higher than 0.85, the AGFI is higher than 0.80, and the RMR and RMSEA values are lower than 0.080, model–data fit is acceptable (Anderson & Gerbing, 1984; Hu & Bentler, 1999; Sümer, 2000). The results of the confirmatory factor analysis for the ET-STEM Scale are shown in Table 6.
Table 6. Fit Indices of ET-STEM scale and acceptable fit indices values
Ki-kare p-value CFI NFI GFI AGFI IFI SRMR RMSEA
1236.481 p < .05 0.83 0.88 0.89 0.82 0.83 0.049 0.076
The results of the confirmatory factor analysis show that conformity between structural equation model and scale is high. Additionally, Chi-square value was found significant. The value of χ2 depends on the size of the sample, and when the size of the sample increases, it provides significant results. Briefly, when chi-square (χ2) is divided by the value of the degrees of freedom (df), it shows that the value is less than 5(χ2(332) =1236.481); in other words, based on the results the model–data fit is high. In addition, if the CFI, NFI, AGFI values are (Hooper, Coughlan & Mullen, 2008; Sümer, 2000) above 0.80, it indicates that the model–data fit is high. Also, if RMSEA value is 0.076, it indicates that the model–data fit is high. According to confirmatory factor analysis it is determined that ET-STEM scale consists of nine subdimensions and model–data fit is high.
Discussion
In this study, the ET-STEM developed by Friday Institute for Educational Innovation (2012) is adapted to Turkish. Two different populations, a total of 526 elementary teachers were employed for validity and reliability analyses of the Turkish ET-STEM. Varimax analysis of the ET-STEM scale revealed a nine-factor structure, as in its original version (STEM Instruction, 21st Century Learning Attitudes, Science Teaching Efficacy and Beliefs, Mathematics Teaching Efficacy and Beliefs, Student Technology Use, Teacher Leadership Attitudes, Science Teaching Outcome Expectancy, Mathematics Teaching Outcome Expectancy and STEM Career Awareness, respectively). Total variance of these nine factors was 67.885%, and the Cronbach‟s Alpha value of the scale was 0.917. The Cronbach‟s Alpha value was calculated as.964 for STEM Instruction, .935 for 21st
Century Learning Attitudes, .956 for Science Teaching Efficacy and Beliefs, .908 for Mathematics Teaching Efficacy and Beliefs, for Student Technology Use, .957 for Teacher Leadership Attitudes, .902 for Science Teaching Outcome Expectancy,.891 for Mathematics Teaching Outcome Expectancy, and .917 for STEM Career Awareness. Since adopted scale‟s Cronbach Alpha values greater than 0.80, Turkish version of the ET-STEM scale is reliable (Field, 2009; Kline, 1999). Also, these results are similar to the results Friday Institute for Educational Innovation found.
model–data fit was high (Hooper et al., 2008; Anderson & Gerbing, 1984; Hu & Bentler, 1999; Jöreskong & Sörbom, 1993). According to the confirmatory factor analysis results, model–data fit was high, and the Turkish version of ET-STEM Scale was found to have nine subdimensions. This scale was found to be valid and reliable based on the results of the exploratory and confirmatory factor analyses.
The Turkish version of ET- STEM scale will help teacher educators and policy makers to understand teachers‟ attitudes toward STEM. Second, it will guide school administrators while organizing professional development seminars. It will also give insight to researchers, policy makers, and administrators in the factors that are positively linked with elementary teachers‟ self-efficacy.
The related Turkish literature includes several different adopted scales and developed self-efficacy scales (Yıldırım, 2018; Çapa, Çakıroğlu & Sarıkaya, 2005; Bıkmaz, 2002; Taşkın & Hacıömeroğlu, 2010; Tepe, 2011) but these instruments mostly lack specificity in different subject areas. An elementary teacher may have high self-efficacy in teaching certain subject such as math, but not in another subject like science. Therefore, Turkish literature and researchers needs STEM content specific self-efficacy instrument.
Limitations of the Study and Suggestions
The Turkish version of ET-STEM scale will be used to measure elementary teachers‟ STEM-content knowledge, their technology use while teaching, 21st century learning skills, teacher‟ leadership attitudes, teachers‟ self-confidence and self-efficacy, and their STEM career awareness. Thus, this scale would be used in further researchers to measure these variables. Furthermore, this scale was originally designed to measure teacher self-efficacy in STEM in general. Other scales were developed and created to assess general aspects of self-efficacy. They are not specific for STEM.
A few of the limitations in the study may have implication on future studies. One limitation was the limit on responses created by the instrument (ET-STEM). Participants may have additional information they would like to share, but the instrument limited these responses. Using different techniques to collect a data would provide more insight into elementary teachers‟ perspectives. Another limitation is that possible selection bias of respondents. Respondents largely demonstrated high efficacy. It is possible that teachers with low self-efficacy did not respond the invitation to participate in the study. More invitations would be sent to bigger groups of elementary teachers in further researchers.
References
Anderson, J. C., & Gerbing, D. W. (1984). The effect of sampling error on convergence, improper solutions, and goodness-of-fit indices for maximum likelihood confirmatory factor analysis. Psychometrika, 49(2), 155-173.
Atkinson, R., & Mayo, M. (2010). Refueling the U.S. innovation economy: Fresh approaches to science, technology, engineering and mathematics (STEM) education. Retrieved from https://www.itif.org/files/2010-refueling-innovation-economy.pdf
Baldwin, J., Ebert-May, D., & Burns, D. (1999). The development of a college biolgy selfefficacy instrument for non-majors. Science Education, 83(4), pp. 397-408.
Bandura, A. (1982). Self-efficacy mechanism in human agency. American Psychologist, 37(2), 122-147. Baumgartner, H., & Homburg, C. (1996). Applications of structural equation modeling in marketing and
consumer research: A review. International Journal of Research in Marketing, 13(2), 139-161.
Bayraktar, Ş. (2011). Turkish preservice primary school teachers‟ science teaching efficacy beliefs and attitudes toward science: The effect of a primary teacher education program. School Science and Mathematics, 111(3), 83-92.
Beilock, S. L., Gunderson, E. A., Ramirez, G., & Levine, S. C. (2010). Female teachers‟ math anxiety affects girls‟ math achievement. Proceedings of the National Academy of Sciences, 107, 1860-1863. https://doi.org/10.1073/pnas.0910967107
Benuzzi, S. (2015). Preparing future elementary teachers with a stem-rich, clinical, coteaching modeling of student teaching. Unpublished doctoral dissertation, California State University, California.
Boomsma A. (1982). The robustness of LISREL against small sample sizes in factor analysis models. In H. Wold & K. Jöreskog (Eds.), Systems under indirect observations (pp. 147-173). New York: Elsevier North-Holland.
Bıkmaz, F. H. (2002). Self-efficacy belief instrument in science teaching. Educational Sciences and Practice, 1(2), 197-210.
Brown, T. A. (2015). Confirmatory factor analysis for applied research (2nd Ed.). New York, NY: Guildford Press.
Comrey, A., & Lee, H. (1992). A first course in factor analysis. Hillsdale, NJ: Erlbaum.
Çapa, Y., Çakıroğlu, J. & Sarıkaya, H. (2005). The developmeııt and validation of a Turkish version of the teachers‟ sense of efficacy scale. Educalion and Science, 30(137), 74-811.
Çokluk, Ö., Şekercioğlu, G., & Büyüköztürk, Ş. (2014). Sosyal bilimler için çok değişkenli ıstatistik: SPSS ve LISREL uygulamaları [Multivariate Statistics for Social Sciences: SPSS and LISREL Applications] (3rd ed.). Ankara, Turkey: Pegem.
Dellinger, A. B., Bobbett, J. J., Olivier, D. F., & Ellet C. D. (2008). Measuring teachers‟ self- efficacy beliefs: Development and use of the TEBS-Self. Teaching and Teacher Education, 24(3), 751–766.
Doğan, T. (2011). Sosyal görünüş kaygısı ölçeği‟nin psikometrik özelliklerinin ergenlerden oluşan bir örneklemde incelenmesi [An investigation of the psychometric properties of the social appearance anxiety scale in an adolescent sample]. Elementary Education Online, 10(1), 12–19. Retrieved from http://dergipark.ulakbim.gov.tr/ilkonline/article/view/5000037978/5000036836
Dunlap, J. (2005). Problem-based learning and self-efficacy: How a capstone course prepares students for a profession. Educational Technology Research and Development 53(1), 65-85.
Enochs, L. G., Smith, P. L., & Huinker, D. (2000). Establishing factorial validity of the mathematics teaching efficacy beliefs instrument. School Science and Mathematics, 100(4), 194-213.Field, A. (2009). Discovering statistics using SPSS (3nd ed.). California: SAGE.
Friday Institute for Educational Innovation (2012). Teacher efficacy and attitudes toward STEM survey-science teachers. Raleigh, NC: North Carolina State University.
Friedman, T. L. (2005). The world is flat: A brief history of thetwenty-first century. New York, NY: Farrar, Straus and Giroux
Gibson, S., & Dembo, M. H. (1984). Teacher efficacy: A construct validation. Journal of Educational Psychology, 76(4), 569-582.
Graham, S., Harris, K. R., Fink, B., & MacArthur, C. A. (2001). Teacher efficacy in writing: A construct validation with primary grade teachers. Scientific Studies of Reading, 5(2), 177-202.
Hambleton, R.K., & Patsula, L. (1999). Increasing the validity of adapted tests: Myths to be avoided and guidelines for improving test adaptation practices. Journal of Applied Testing Technology, 1(1), 1-30. Hooper, D., Coughlan, J., & Mullen, M. R. (2008). Structural equation modeling: Guidelines for determining
model fit. Journal of Business Research Methods, 6(1), 53–60.
Hu, L.-T., & Bentler, P. M. (1999). Cutoff criteria for fit indexes in covariance structure analysis: Conventional criteria versus new alternatives. Structural Equation Modeling: A Multidisciplinary Journal, 6(1), 1–55. doi:10.1080/10705519909540118.
Hudson, P., English, L., Dawes, L., King, D., & Baker, S. (2015). Exploring links between pedagogical knowledge practices and student outcomes in STEM education for primary schools. Australian Journal of Teacher Education, 40(6), 134-151.
Jerusalem, M. & Schwarzer, R. (1992). Self-efficacy as a resource factor in stress appraisal processes. In R. Schwarzer (Ed.), Self-efficacy: Thought control of action (pp. 195-213). Washington DC: Hemisphere. Jöreskog, K. G., & Sörbom, D. (1993). LISREL 8: Structural equation modeling with the simplis command
language. Lincolnwood: Scientific Software International.
Kass, R. A. & Tinsley, H. E. A. (1979). Factor analysis. Journal of Leisure Research, 11, 120-138.
Karakaya, F. & Avgın, S.S. (2016). Effect of demographic features to middle school students‟ attitude towards FeTeMM (STEM). Journal of Human Sciences, 13(3), 4188- 4198.
Kaiser, H. F. (1960). The application of electronic computers to factor analysis. Educational and Psychological Measurement, 20, 141-151.
Kelley, T.R., Knowles, J.G. (2016). A conceptual framework for integrated STEM education. International Journal of STEM Education, 3(11), 1-11.
Kılıç, H. E., & Şen, A. İ. (2014). Turkish adaptation study of UF/EMI critical thinking disposition ınstrument. Education and Science, 39(176), 1-12.
Kieffer, K. M. (1998). Orthogonal versus oblique factor rotation: a review of the literature regarding the pros and cons. Paper presented at the annual meeting of the American Educational Research Association, New Orleans, LA.
Kline, P. (1999). The handbook of psychological testing (2nd ed.). London: Routledge.
Marsh, H. W., & Hocevar, D. (1985). Application of confirmatory factor analysis to the study of self-concept: First-and higher order factor models and their invariance across groups. Psychological bulletin, 97(3), 562.
MITRE. (2016). The innovation landscape and government’s future role. Retreved from https://www.mitre.org/sites/default/files/publications/pr-15-3060-innovation-landscape-government-future-role_0.pdf
National Research Council (NRC). (2010). Exploring the intersection of science education and 21st century skills: A workshop summary. Washington, DC: National Academies Press.
National Research Council. (2011). Successful K-12 STEM education: Identifying effective approaches iscience, technology, engineering, and mathematics. Washington, DC: National Academy Press.
Nadelson, L. S., Seifert, A, Moll, A. J., & Coats, B. (2012). i-STEM summer institute: An integrated approach to teacher professional development in STEM. Journal of STEM Education, 13(2), 69-83.
Ostler, E. (2012). 21st century STEM education: A tactical model for long-range success. International Journal of Applied Science and Technology, 2(1), 28-33.
Painter, P. & Bates, R. (2012). Statistical models of self-efficacy in STEM students. Journal of Undergraduate Research at Minnesota State University, Mankato, 12(7), 1-13.
Pan, S. C., & Franklin, T. (2011). In-service teachers‟ self-efficacy, professional development, and Web 2.0 tools for integration. New Horizons in Education, 59(3), 28-40.
Pajares, M. F. (1992). Teachers‟ beliefs and educational research: cleaning up a messy construct. Review of Educational Research, 62(3), 307-333.
Pintrich, P. & DeGroot, E. (1990). Motivational and self-regulated learning components of classroom academic performance. Journal of Educational Psychology, 82(1), 33-40.
Pressley, M., Dolezal, S.E., Raphael, L.M., Mohan, L., Bogner, K., & Roehrig, A.D. (2003). Motivating primary-grade students. New York: Guilford.
Riggs, I. M., & Enochs, L. G. (1990). Toward the development of an elementary teacher‟s science teaching efficacy beliefs instrument. Science Education, 74(6), 625-637.
Ritter, J. M., Boone, W. J., & Rubba, P. A. (2001). Development of an instrument to assess prospective elementary teacher self-efficacy beliefs about equitable science teaching and learning (SEBEST). Journal of Science Teacher Education, 12(3), 175-198.
Rogers, R. R., Winship, J., & Sun, Y. (2015). Systematic support for STEM pre-service teachers: An authentic and sustainable four. In K. Dikilitaş. (Eds.). Innovative professional development methods and strategies for STEM education, (pp. 73-90). Hershey, PA: IGI Global. doi: 10.4018/978-1-4666-9471-2.ch005 Sümer, N. (2000). Yapısal eşitlik modelleri: Temel Kavramlar ve Örnek Uygulamalar [Structural Equation
Models: Basic Concepts and Sample Applications]. Türk Psikoloji Yazıları [Turkish Psychological Articles], 3(6), 49–74.
Stohlmann, M., Moore, T., & Roehrig, G. H. (2012) Considerations for teaching ıntegrated STEM education. Journal of Pre-College Engineering Education Research (J-PEER), 2(1), 28-34
Taşkın, Ç. Ş., & Hacıömeroğlu, G. (2010). Adaptation of the teachers‟ effıcacy beliefs system-self form and primary teachers‟ self-efficacy beliefs. Dokuz Eylül Üniversitesi Buca Eğitim Fakültesi Dergisi, 27, 63-75.
Tavşancıl, E. (2002). The evaluation of attitudes of data analysis through SPSS. Ankara: Nobel Publication. Tekerek, M., Karakaya, F. & Tekrerek, B. (2016). Ethical reasoning in STEM disciplines. Journal of Education
and Practice, 7(32), 182-188.
Tepe, D. (2011). Development of declaratory scale for preschool teachers’ self efficacy beliefs. (Unpulished master‟s thesis). Mehmet Akif Ersoy University, Burdur.
Tschannen-Moran, M., & Woolfolk Hoy, A. (2001). Teacher efficacy: Capturing an elusive construct. Teaching and Teacher Education, 17, 783-805. http://dx.doi.org/10.1016/S0742-051X(01)00036-1
Wallace, C. S., & Kang, N. (2004). An investigation of experienced secondary science teachers‟ beliefs about inquiry: An examination of competing belief sets. Journal of Research in Science Teaching, 41, 936-960. Wang, H. H., (2012). A new era of science education: science teachers’ perceptions and class room practices of science, technology, engineering, and mathematics (STEM) integration. (Unpublished doctoral dissertation). Minnesota University, Minnesota.
Wang, L., Ertmer, P. A., & Newby, T. J. (2004). Increasing preservice teachers‟ self-efficacy beliefs for technology integration. Journal of research on technology in education, 36(3), 231-250.
Wang, H. H., Moore, T. J., Roehrig, G. H., & Park, M. S. (2011). STEM integration: Teacher perceptions and practice. Journal of Pre-College Engineering Education Research (JPEER), 1(2), 1-13.
Yerdelen, S., Kahraman, N., & Tas, Y. (2016). Low socioeconomic status students' STEM career ınterest in relation to gender, grade level, and STEM attitude. Journal of Turkish Science Education,13, 59-74. Yıldırım, B. & Selvi, M. (2015). Adaptation of STEM attitude scale to Turkish. Turkish Studies-International
Periodical for the Languages, Literature and History of Turkish or Turkic, 10(3), 1107-1120.
Yıldırım, B. (2017). Fen eğitiminde STEM [STEM in Science Education]. M. P. Demirci Güler. (Ed.). Fen Bilimleri Öğretimi. Ankara, Turkey: Pegem.
Yıldırım, B. (2018). Adapting the teachers' efficacy and attitudes towards STEM scale into turkish. Journal of Turkish Science Education, 15(2), 54-65.
Yoon Yoon, S., Evans, M. G., & Strobel, J. (2014). Validation of the teaching engineering self-efficacy scale for K-12 teachers: A Structural Equation Modeling Approach. Journal of Engineering Education, 103(3), 463-485.
Author Information
Emine Şahin TopalcengizIstanbul University- Cerrahpasa İstanbul, Turkey
Muş Alparslan University Muş, Turkey
Contact e-mail: [email protected]
Appendix-1.Teacher Efficacy and Attitudes toward STEM (T-STEM) Survey (Original Version of the Scale)
Elementary Teacher
Appropriate Use
The Teacher Efficacy and Attitudes Toward STEM (T-STEM) Survey is intended to measure changes in teachers‟ confidence and self-efficacy in STEM subject content and teaching, use of technology in the classroom, 21st century learning skills, leadership attitudes, and STEM career awareness. The survey is available to help program coordinators make decisions about possible improvements to their program. The Friday Institute grants you permission to use these instruments for educational, noncommercial purposes only. You may use an instrument as is, or modify it to suit your needs, but in either case you must credit its original source. By using this instrument, you agree to allow the Friday Institute to use the data collected for additional validity and reliability analysis. The Friday Institute will take appropriate measures to maintain the confidentiality of all data.
Recommended citation for this survey:
Friday Institute for Educational Innovation (2012). Teacher Efficacy and Attitudes Toward STEM Survey-Elementary Teachers, Raleigh, NC: Author.
The development of this survey was partially supported by the National Science Foundation under Grant No. 1038154 and by The Golden LEAF Foundation. The framework for part of this survey was developed from the following sources: Riggs, I. M., & Enochs, L. G. (1990). Toward the development of an elementary teachers science teaching efficacy belief instrument. Science Education, 74(6), 625-637. doi: 10.1002/sce.3730740605 DIRECTIONS:
For each of the following statements, please indicate the degree to which you agree or disagree. Even though some statements are very similar, please answer each statement. There are no "right" or "wrong" answers. The only correct responses are those that are true for you. Whenever possible, let the things that have happened to you help make your choice.
Science Teaching Efficacy and Beliefs
Directions: Please respond to these questions regarding your feelings about your ownteaching.
Stro
n
g
ly
Dis
ag
ree
Dis
ag
ree
Neith
er
Ag
ree
n
o
r
Dis
ag
ree
Ag
ree
Stro
n
g
ly
Ag
ree
1. I am continually improving my science teaching practice.
○ ○ ○ ○ ○
2. I know the steps necessary to teach science effectively.
○ ○ ○ ○ ○
3. I am confident that I can explain to students why science experiments work.
○ ○ ○ ○ ○
4.I am confident that I can teach science effectively. ○ ○ ○ ○ ○ 5. I wonder if I have the necessary skills to teach
science.
○ ○ ○ ○ ○
6. I understand science concepts well enough to be
7.Given a choice, I would invite a colleague to evaluate
my science teaching. ○ ○ ○ ○ ○
8. I am confident that I can answer students‟ science questions.
○ ○ ○ ○ ○
9.When a student has difficulty understanding a science concept, I am confident that I know how to help the student understand it better.
○ ○ ○ ○ ○
10. When teaching science, I am confident enough to welcome student questions.
○ ○ ○ ○ ○
11.I know what to do to increase student interest in science.
○ ○ ○ ○ ○
Science Teaching Outcome Expectancy
Directions: The following questions ask about your feelings about teaching in general. Please respond accordingly.
Stro
n
g
ly
Dis
ag
ree
Dis
ag
ree
Neith
er
Ag
ree
n
o
r
Dis
ag
ree
Ag
ree
Stro
n
g
ly
Ag
ree
1. When a student does better than usual in science, it is
often because the teacher exerted a little extra effort. ○ ○ ○ ○ ○ 2. The inadequacy of a student‟s science background can
be overcome by good teaching. ○ ○ ○ ○ ○
3. When a student‟s learning in science is greater than expected, it is most often due to their teacher having found a more effective teaching approach.
○ ○ ○ ○ ○
4. The teacher is generally responsible for students‟ learning in science.
○ ○ ○ ○ ○
5. If students‟ learning in science is less than expected, it
is most likely due to ineffective science teaching. ○ ○ ○ ○ ○ 6. Students‟ learning in science is directly realted to their
teacher‟s effectiveness in science teaching. ○ ○ ○ ○ ○
7. When a low achieving child progresses more than expected in science, it is usually due to extra attention given by the teacher.
○ ○ ○ ○ ○
8. If parents comment that their child is showing more interest in science at school, it is probably due to the
performance of the child‟s teacher. ○ ○ ○ ○ ○
9. Minimal student learning in science can generally be attributed to their teachers.
○ ○ ○ ○ ○
Mathematics Teaching Efficacy and Beliefs
Directions: Please respond to these questions regarding your feelings about your ownteaching. Stro n g ly Dis ag ree Dis ag ree Neith er Ag ree n o r Dis ag ree Ag ree Stro n g ly Ag ree
1. I am continually improving my mathematics teaching practice.
○ ○ ○ ○ ○
2. I know the steps necessary to teach mathematics effectively.
○ ○ ○ ○ ○
3. I am confident that I can explain to students why
mathematics experiments work. ○ ○ ○ ○ ○
4. I am confident that I can teach mathematics effectively.
○ ○ ○ ○ ○
5. I wonder if I have the necessary skills to teach mathematics.
○ ○ ○ ○ ○
6. I understand mathematics concepts well enough to be
effective in teaching mathematics. ○ ○ ○ ○ ○
7. Given a choice, I would invite a colleague to evaluate
my mathematics teaching. ○ ○ ○ ○ ○
8. I am confident that I can answer students‟ mathematics questions.
○ ○ ○ ○ ○
9. When a student has difficulty understanding a mathematics concept, I am confident that I know how to help the student understand it better.
○ ○ ○ ○ ○
10. When teaching mathematics, I am confident enough
to welcome student questions. ○ ○ ○ ○ ○
11. I know what to do to increase student interest in mathematics.
○ ○ ○ ○ ○
Mathematics Teaching Outcome Expectancy
The following questions ask about your feelings about teaching in general. Please respond accordingly. Stro n g ly Dis ag ree Dis ag ree Neith er Ag ree n o r Dis ag ree Ag ree Stro n g ly Ag ree
1. When a student does better than usual in mathematics, it is often because the teacher exerted a little extra effort.
○ ○ ○ ○ ○
2. The inadequacy of a student‟s mathematics
background can be overcome by good teaching. ○ ○ ○ ○ ○
3. When a student‟s learning in mathematics is greater than expected, it is most often due to their teacher having found a more effective teaching approach.
○ ○ ○ ○ ○
4. The teacher is generally responsible for students‟ learning in mathematics.
5. If students‟ learning in mathematics is less than expected, it is most likely due to ineffective mathematics teaching.
○ ○ ○ ○ ○
6. Students‟ learning in mathematics is directly realted to their teacher‟s effectiveness in mathematics teaching.
○ ○ ○ ○ ○
7. When a low achieving child progresses more than expected in mathematics, it is usually due to extra attention given by the teacher.
○ ○ ○ ○ ○
8. If parents comment that their child is showing more interest in mathematics at school, it is probably due to the performance of the child‟s teacher.
○ ○ ○ ○ ○
9. Minimal student learning in mathematics can generally be attributed to their teachers.
○ ○ ○ ○ ○
Student Technology Use
Please answer the following questions about how often students use technology in settings where you instruct students. If the question is not applicable to your situation, please select “Not Applicable.”
During elementary STEM instructional meetings (e.g. class periods, after school activities, days of summer camp, etc.), how often do your students…
Nev
er
Occ
asio
n
ally
Ab
o
u
t
h
alf
th
e
tim
e
Usu
ally
E
v
er
y
tim
e
No
t
Ap
p
licab
le
1. Use a variety of technologies,
e.g. productivity, data visualization, research, and communication tools.
○ ○ ○ ○ ○ ○
2. Use technology to communicate and collaborate with others, beyond the classroom.
○ ○ ○ ○ ○ ○
3. Use technology to access online resources and information as a part of activities.
○ ○ ○ ○ ○ ○
4. Use the same kinds of tools that professional researchers use, e.g. simulations, databases, satellite imagery.
○ ○ ○ ○ ○ ○
5. Work on technology-enhanced projects that approach realworld applications
of technology. ○ ○ ○ ○ ○ ○
6. Use technology to help solve problems. ○ ○ ○ ○ ○ ○
7. Use technology to support higher-order thinking, e.g.
analysis, synthesis and evaluation of ideas and information.
○ ○ ○ ○ ○ ○
8. Use technology to create new ideas and
Elementary STEM Instruction
Please answer the following questions about how often students engage in the following tasks during your instructional time.
During elementary STEM instructional meetings (e.g. class periods, after school activities, days of summer camp, etc.), how often do your students…
Nev
er
Occ
asio
n
ally
Ab
o
u
t
h
alf
th
e
tim
e
Usu
ally
E
v
er
y
tim
e
1. Develop problem-solving skills through investigations
(e.g. scientific, design or theoretical investigations). ○ ○ ○ ○ ○
2. Work in small groups. ○ ○ ○ ○ ○
3. Make predictions that can be tested. ○ ○ ○ ○ ○
4. Make careful observations or measurements. ○ ○ ○ ○ ○
5. Use tools to gather data (e.g.
calculators, computers, computer programs, scales, rulers, compasses, etc.).
○ ○ ○ ○ ○
6. Recognize patterns in data. ○ ○ ○ ○ ○
7. Create reasonable explanations of results of an
experiment or investigation. ○ ○ ○ ○ ○
8. Choose the most appropriate methods to express results (e.g.drawings, models, charts, graphs, technical language, etc.).
○ ○ ○ ○ ○
9. Complete activities with a real-world context. ○ ○ ○ ○ ○
10. Engage in content-driven dialogue. ○ ○ ○ ○ ○
11. Reason abstractly. ○ ○ ○ ○ ○
12. Reason quantitatively. ○ ○ ○ ○ ○
13. Critique the reasoning of others. ○ ○ ○ ○ ○
14. Learn about careers related to the instructional content.
Appendix2. Öğretmenlerin STEM’e Yönelik Yeterlilikleri ve Tutumları (T-STEM)
Ölçeği (Turkish Version Of The Scale)
Uygun Kullanım:
Öğretmenlerin STEM‟e Yönelik Yeterlilikleri ve Tutumları (T-STEM) Ölçeği, öğretmenlerin STEM alanlarındaki konu alan bilgileri ve öğretimleri, sınıflarında teknoloji kullanımları, 21. yüzyıl öğrenme becerileri, liderlik davranışları, öğretmenlerin güven ve özyeterliliklerinde meydana gelecek değişimleri ve STEM alanlarıyla ilgili kariyer bilinçlerinin değişimini ölçmek amacıyla tasarlanmıştır. Anket, program koordinatörlerinin programlarındaki muhtemel geliştirmeler hakkında karar vermelerine yardımcı olması için hazırlanmıştır.
Anket formundaki sorulara vereceğiniz cevaplar yalnızca bu çalışma için kullanılacak olup, başkalarıyla paylaşılmayacaktır. Bu nedenle vereceğiniz samimi cevaplar gerçeği yansıtması açısından önemlidir.
Katılımınızdan ötürü çok teşekkür ederiz.
Dr. Bekir Yıldırım Arş. Gör Emine Şahin Branş : (…) Sınıf Öğretmenliği
Cinsiyet : (…) Bay (…) Bayan Deneyim : (…) 1-5 yıl arası (…) 6-10 yıl arası (…) 11-15 yıl arası (…) 16-20 yıl arası (…) 21yıl ve üzeri
TALİMATLAR:
Lütfen, aşağıdaki ifadelerin her biri için katılma veya katılmama derecenizi belirtiniz. Bazı ifadeler her ne kadar çok benzer olsa da lütfen her ifadeyi cevaplayınız. Ankette "Doğru" veya "Yanlış" cevap yoktur. Tek doğru cevap sizin için doğru olan cevaptır. Mümkün olduğunca, sizin başınıza gelen olayların, deneyimlerinizin seçiminizi yönlendirmesine izin verin.
Fen Öğretimi Yeterliği ve İnançlar
Talimat: Kendi öğretiminiz ile ilgili aşağıdaki soruları lütfen kendi duygu ve fikirlerinizi gözönünde bulundurarak yanıtlayınız.
Kesin
lik
le
katılm
ıy
or
um
Katılm
ıy
or
um
Kar
ar
sızım
Katılıy
or
um
Kesin
lik
le
katılıy
or
um
1. Fen öğretimimi sürekli geliştiririm.
2. Feni etkili öğretmek için gerekli aşamalarını bilirim.
3. Bilimsel araştırmaların neden işe yaradıklarını öğrencilere açıklayabilme konusunda kendime güveniyorum.
4. Fen dersini etkili bir şekilde öğretebildiğim konusunda kendime güveniyorum
7.Eğer fırsatım olsaydı meslektaşımı sınıfıma fen öğretimimi değerlendirmesi için davet ederdim.
8.Öğrencilerin fenle ilgili tüm sorularını cevaplayabileğim konusunda kendime güveniyorum.
9.Bir öğrenci, bir fen kavramını anlamakta zorluk çektiğinde, o öğrencinin
kavramı daha iyi anlayabilmesi için neler yapmam gerektiğini bildiğimden eminim.
10.Fen öğretirken öğrencilerin soru sormasını hoş karşılayacağım konusunda kendime güvenirim.
11.Öğrencilerin fene karşı olan ilgilerini artırmak için ne yapılması gerektiğini bilirim.
Fen Öğretiminde Sonuç Beklentileri
Talimat: Aşağıdaki sorularda sizin öğretimle ilgili genel düşünceleriniz sorulmaktadır. Lütfen uygun bir şekilde cevaplayınız.
Matematik Öğretimi Yeterliği ve İnançlar
Talimat: Aşağıda kendi öğretiminizle ilgili soruları lütfen duygularınızıda göz önünde bulundurarak cevaplayınız.
Kesin
lik
le
katılm
ıy
or
um
Katılm
ıy
or
um
Kar
ar
sızım
Katılıy
or
um
Kesin
lik
le
katılıy
or
um
1. Bir öğrenci fen dersinde ortalamanın üzerinde başarı gösterdiğinde, bu çoğunlukla öğretmenin gösterdiği fazla çabanın bir sonucudur. 2. İyi bir öğretim ile bir öğrencinin fen alanlarındaki yetersizliğinin
önüne geçilebilir.
3. Bir öğrencinin fendeki öğrenimi beklenilenden daha iyi olduğunda, bu çoğunlukla öğretmenin daha etkili bir öğretim yaklaşımı kullanmasının bir sonucudur.
4. Öğrencinin fen öğreniminden genellikle öğretmen sorumludur. 5. Öğrencinin fen öğrenimi beklenilenden düşük ise, bu muhtemelen
fen öğretiminin etkin bir şekilde yapılamamasından kaynaklanıyordur.
6. Öğrencinin fen öğrenimi doğrudan öğretmenin fen öğretiminde etkili oluşuyla alakalıdır.
7. Düşük seviyeli bir öğrenci fende beklenenden daha yüksek bir başarı gösterirse bu genellikle öğretmen tarafından gösterilen fazla ilginin bir sonucudur.
8. Eğer ebeveynler çocuklarının okulda fene olan ilgilerinin arttığı çıkarımında bulunurlarsa, bu ilgi artışı muhtemelen çocuğun öğretmeninin performansının bir sonucudur.
Matematik Öğretiminde Sonuç Beklentileri
Talimat: Aşağıdaki sorular sizin öğretimle ilgili genel düşüncelerinizi sormaktadır. Lütfen uygun şekilde cevaplayınız. Kesin lik le katılm ıy or um Katılm ıy or um Kar ar sızım Katılıy or um Kesin lik le katılıy or um
1.Matematik öğretimimi sürekli geliştiririm.
2.Matematiği etkili öğretmek için gerekli aşamalarını bilirim. 3.Matematiksel araştırmaların neden işe yaradıklarını öğrencilere açıklayabilme konusunda kendime güveniyorum.
4.Matematik dersini etkili bir şekilde öğretebildiğim konusunda kendime güveniyorum.
5.Matematik öğretimiyle ilgili gerekli becerilere sahip olup olmadığımı merak ederim.
6.Matematiksel kavramları matematiği etkili bir şekilde öğretecek kadar bilirim.
7.Eğer fırsatım olsaydı meslektaşımı sınıfıma matematik öğretimimi değerlendirmesi için davet ederdim.
8.Öğrencilerin matematikle ilgili sorularını cevaplayabileğim konusunda kendime güveniyorum.
9.Bir öğrenci, bir matematik kavramını anlamakta zorluk çektiğinde, o
öğrencinin kavramı daha iyi anlayabilmesi için neler yapmam gerektiğini bildiğimden eminim.
10.Matematik öğretirken öğrencilerin soru sormasını hoş karşılayacağım konusunda kendime güvenirim
11.Öğrencilerin matematiğe karşı olan ilgilerini artırmak için ne yapılması gerektiğini bilirim.
Kesin lik le katılm ıy or um Katılm ıy or um Kar ar sızım Katılıy or um Kesin lik le katılıy or um
1.Bir öğrenci matematikte ortalamanın üzerinde başarı gösterdiğinde, bu çoğunlukla öğretmenin gösterdiği fazla çabanın bir sonucudur.
2.İyi bir öğretim ile bir öğrencinin matematikle ilgili yetersizliğinin önüne geçilebilir.
3.Bir öğrencinin matematikteki öğrenimi beklenilenden daha iyi olduğunda, bu çoğunlukla öğretmenin daha etkili bir öğretim yaklaşımı kullanmasının bir sonucudur.
4.Öğrencinin matematik öğreniminden genellikle öğretmen sorumludur. 5.Öğrencinin matematik öğrenimi beklenilenden düşük ise, bu
muhtemelen matematik öğretiminin etkin bir şekilde yapılamamasından kaynaklanıyordur.
6.Öğrencinin matematik öğrenimi doğrudan öğretmenin matematik öğretiminde etkili oluşuyla alakalıdır.
Öğrencilerin Teknoloji Kullanımı
Talimat: Sizin öğretim yaptığınız yerlerde öğrencilerinizin teknolojiyi ne kadar sıklıkla kullandığıyla alakalı aşağıda verilmiş olan soruları lütfen cevaplayınız. Eğer soru sizin durumunuz için geçerli değil ise lütfen „Geçerli Değil‟ seçeneğini işaretleyiniz.
STEM öğretimi boyunca (örneğin ders zamanları, okul sonrası aktiviteler, yaz kampı vb.) ne sıklıkla öğrencilerin….
Asl
a
Nad
ir
en
B
az
en
Gen
ellik
le
Her
za
m
an
Geç
er
li
Değ
il
1. Farklı teknolojileri kullanır (örn. yaratıcılık, veri görselleştirme, araştırma yapmak ve iletişim araçları)
2. Sınıf ortamı dışındada diğerleriyle haberleşmek ve birlikte çalışmak için teknolojiyi kullanır.
3. Online kaynaklara ve bilgiye ulaşmak için teknolojiyi etkinliklerin bir parçası olarak kullanır.
4. Uzman araştırmacıların da kullandığı tarazda araçları kullanır (örn. simülasyonlar, veri tabanları, uydu görüntüleri).
5. Teknolojinin gerçek yaşam içerisindeki kullanımını ele alan teknoloji-destekli projeler üzerine çalışır.
6. Teknolojiyi problemlerin çözümüne çözmede yardımcı olması için kullanır.
7. Üst düzey düşünmeyi desteklemek için teknolojiyi kullanır (örn. analiz, sentez, fikir ve bilgileri değerlendirme).
8. Yeni fikirler oluşturmak ve bilginin gösterimi için teknolojiyi kullanır.
STEM Öğretimi
Talimat: Sizin öğretim yaptığınız sırada öğrencilerinizin etkinliklere ne kadar sıklıkla katılım gösterdiği ile ilgili aşağıdaki soruları lütfen cevaplayınız.
STEM öğretimi boyunca (örneğin ders zamanları, okul sonrası aktiviteler, yaz kampı vb.) ne sıklıkla öğrencilerin….
8.Eğer ebeveynler çocuklarının okulda matematiğe olan ilgilerinin arttığı çıkarımında bulunurlarsa, bu ilgi artışı muhtemelen çocuğun öğretmeninin performansının bir sonucudur.
9.Öğrencilerin minimum düzeyde matematik öğrenmeleri genellikle öğretmene bağlanır
Asl
a
Nad
ir
en
B
az
en
Ge
n
ell
ik
le
Her
za
m
an
1. Araştırma yoluyla problem çözme becerilerini geliştirir ( örn. Bilimsel, tasarım, teorik araştırmalar).
2. Küçük gruplar halinde çalışır. 3. Test edilebilir tahminlerde bulunur.
4. Dikkatli ölçümler veya gözlemlemeler yapar.
5. Veri toplamak için araçlar kullanır (örn. hesap makineleri, bilgisayarlar, bilgisayar programları, ölçekler, cetveller, pusulalar, vb.)
6. Verilerdeki desenleri farkeder.
21. Yüzyıl Öğrenim Tutumları
Talimat: Lütfen öğrenimle ilgili genel fikirlerinizi içeren aşağıdaki soruları cevaplayınız.
Öğretmen Liderlik Tutumu
Talimat:
Lütfen öğretmen liderliği ile ilgili genel düşünceleriniz hakkındaki aşağıdaki soruları cevaplayınız. 8. Sonuçları ifade etmek için en uygun yöntemleri seçer (örn. çizimler,
modeller, grafikler, tablolar, teknik dil, vb.)
9. Gündelik hayat içinden verilen etkinlikleri tamamlar. 10. İçerik odaklı diyaloglar içerisindedir.
11. Soyut düşünür. 12. Nicel düşünür.
13. Diğerlerinin düşüncelerini eleştirir.
14. Öğretilen içerikle ile ilgili kariyer alanlarını öğrenir.
Kesin lik le katılm ıy or um Katılm ıy or um Kar ar sızım Katılıy or um Kesin lik le katılıy or um
1. Bence öğrencilerin diğerlerinin hedeflerine ulaşmasını sağlayacağı öğretim ortamlarında olmaları önemlidir.
2. Bence öğrencilerin diğer öğrencilerin ellerinden gelenin en iyisini yapmalarını sağlayabilecekleri öğretim ortamlarında olmaları önemlidir.
3. Bence öğrencilerin yüksek kaliteli, nitelikli çalışmalar üreteceği öğretim ortamlarında olmaları önemlidir.
4. Bence öğrencilerin akranları arasındaki farklılıklara saygı duyabileceklerini sağlayan öğretim ortamında olmaları önemlidir.
5. Bence öğrencilerin akranlarına yardım edebilecekleri öğretim ortamında olmaları önemlidir.
6. Bence öğrencilerin karar verirken başkalarınında fikirlerinin alındığı öğretim ortamında olmaları önemlidir.
7. Bence öğrencilerin işler planlandığı gibi gitmediğinde değişimler yapılabilecekleri öğretim ortamında olmaları önemlidir.
8. Bence öğrencilerin kendi hedeflerini belirledikleri öğretim ortamında olmaları önemlidir.
9. Bence öğrencilerin kendi başlarına çalışırken zamanı planlayabilecekleri öğretim ortamında olmaları önemlidir.
10. Bence öğrencilerin birçok görev arasından hangisinin önce yapılacağını seçebileceği öğretim ortamında olmasının önemlidir.
11. Bence öğrencilerin farklı sosyal çevrelerden, deneyimlerden gelen
öğrencilerle birlikte uyum içinde çalışabilecekleri öğretim ortamında olmaları önemlidir. Kesin lik le katılm ıy or um Katılm ıy or um Kar ar sızım Katılıy or um Kesin lik le katılıy or um