Available online on 15.07.2019 at http://jddtonline.info
Journal of Drug Delivery and Therapeutics
Open Access to Pharmaceutical and Medical Research© 2011-18, publisher and licensee JDDT, This is an Open Access article which permits unrestricted non-commercial use, provided the original work is properly cited
Open Access
Research Article
Design and Development of a Microwave Generated Lactose Monohydrate -
Microcrystalline Cellulose Based Multifunctional Excipient Composites for
Tablet Formulation using Box–Behnken Design
Mr. Sachin Shivaji Kushare
a*, Dr. S. G. Gattani
ba* Research Scholar, School of Pharmacy, Swami Ramanand Teerth Marathwada University, Vishnupuri Nanded, (M.S.) India. Pin – 431606 b Professor, School of Pharmacy, Swami Ramanand Teerth Marathwada University, Vishnupuri Nanded, (M.S.) India. Pin – 431606
ABSTRACT
The concept of co-processing as a particle engineering technique continues to be used as a tool to enhance the functionality of several existing excipients. This important research was designed to improve the functionality of lactose monohydrate as excipient for direct compression by co-processing with microcrystalline cellulose. Microwave induced diffusion technique was first utilized for manufacturing Co processed lactose monohydrate (LM) - microcrystalline cellulose (MC) composites. The objective of the research was to obtain synergistic effects, incorporating better tablet adherence and hardness capacity. Box-Behnken experimental design was worked out to optimize the proportion of the primary excipients for the co-processed excipient. Fifteen experiments were carried out to assess the effect of primary excipients and mixing time required to prepare a slurry for microwaving treatment on percent fines, angle of repose, Carr’s index, friability, tensile strength, disintegration time as responses. The combination of the co-processed excipient that constructed significant characteristics after optimization was observed to be 70 % alpha-Lactose-monohydrate and 30 % microcrystalline cellulose. Consequently, Microcrystalline Cellulose-Lactose composites (MCLM), a co-processed excipient, were developed that offers functionality for direct compression, as a result of given flowability and compactability. Solid-state characterization was performed on optimized composites to ascertain its particle size, shape, distribution, surface morphology, degree of crystallinity, hygroscopicity, compatibility etc. employing proven analytical methods. Powder characteristics were determined by bulk and tapped densities, angle of repose, porosity, lubricant sensitivity ratio, dilution potential etc. The compaction patterns of MCLM were assessed employing Heckel and Kawakita equations and the compressibility, tabletability, compactability (CTC) profile was determined compared to the physical mixture of the native excipients and Cellactose. Tablets were developed by direct compression using paracetamol as the drug of choice. The results imply that microwave generated MCLM composites offers improved properties in comparison with native MC and LM. The current study highlights the concept of microwave drying technique as a cost-effective means for manufacturing multifunctional directly compressible excipient in comparison to the spray-drying technique.
Keywords: Microwave generated composites, Microcrystalline cellulose–lactose composites, cellactose, direct compression, compressibility, content uniformity, loading capacity, Co-processing; Multifunctional excipient
Article Info:Received 07 May 2019; Review Completed 13 June 2019; Accepted 19 June 2019; Available online 15 July 2019
Cite this article as:
Kushare SS, Gattani SG, Design and Development of a Microwave Generated Lactose Monohydrate - Microcrystalline Cellulose Based Multifunctional Excipient Composites for Tablet Formulation using Box–Behnken Design, Journal of Drug Delivery and Therapeutics. 2019; 9(4):1-17 http://dx.doi.org/10.22270/jddt.v9i4.3123
*Address for Correspondence:
Mr. Sachin Shivaji Kushare, Research Scholar,School of Pharmacy, Swami Ramanand Teerth Marathwada University, Vishnupuri, Nanded, (M.S.)
India. Pin – 431606.
1.
INTRODUCTION
Throughout the last centuries tablet manufacturers have got the materials and processes which could generate compressed tablets comprising an accurate amount of an active pharmaceutical ingredient (API) at fairly low cost and high speed. The expansion with regards to actives, excipients and then tableting machines during the past years has transformed tablet production a science and the tablets among the most widely used dosage form [1, 2]. The simplicity of manufacturing, comfort and ease in administration, right dosing, and stability in comparison with oral liquids, tamper-proof compared to capsules, harmless in contrast to parental dosage forms helps it be a
preferred and convenient dosage form. Professionals in the field of tableting are aware using the primary skill of tableting by three well-known techniques, i.e. Wet, dry granulation and direct compression. The advantages and disadvantages of wet granulation and dry granulation are very well described in the literature [3-5].
process [6]. During the dry granulation, the drug and the excipients are blended and afterwards passed through rollers and consequently screened for getting granules in appropriate sizes [7].
Amongst all of the aforementioned techniques, direct compression is considered the most suitable as it needs only some unit operations, offers lesser energy consumption and it provides a lot better stability intended for moisture, oxidation, and temperature sensitive drugs [8]. Nevertheless, approximately 80 % among the tablet formulations are manufactured by means of wet granulation. This is certainly the consequence of the indigent mechanical properties demonstrated by several drugs [9]. An excellent excipient designed for direct compression applications ought to have the subsequent attributes: excellent compressibility, good flow, resistance from segregation, quick disintegration, low level of sensitivity to lubricants, scaling-up feasibility, and good dilution potential [10]. The strain of formulating poorly compressible drugs right into robust tablets by DC is usually borne mainly through excipients utilized for this operation. Most of these excipients comprise a larger proportion of any DC excipient in accordance with API. It has consequently led to a greater thrust to formulate high-functionality excipients suitable for DC formulations. Through the years, research in regards to excipient development has concentrated around the co-processing of existing excipients to get a novel excipient with superior functionality. Co-processing of excipients is actually a particle engineering technique involving a combination of a couple of excipients at a sub - particle level intended to physically enhance their particular properties in a fashion that may not be accomplished through regular physical mixing [11, 12]. The final product with this technique contributed to the emergences of a composite excipient with improved functionalities like compressibility, flowability, dilution potential etc. [13]. A mixture of plastic and brittle deforming materials constitutes a co-processed excipient with the desired characteristics intended for tableting [14]. A large number of co-processing strategies have already been exercised, incorporating spray drying [13, 15, 16], co-drying [16-18] wet massing, melt extrusion, spheronisation [19], co-precipitation [20], co-grinding [21, 22] wet-, dry– and spray-granulation [23] and co-processing by crystal coating [24].
Innovative grades of known excipients may be obtained simply by transforming the powder fundamental properties resulting in improved derived (functional) properties. Fundamental attributes, such as particle size, shape, morphology, surface area, porosity and density, decide on excipient functional properties such as flowability, compressibility, compactibility, dilution potential, disintegration time and lubricant sensitivity. However, functionality could be improved to a certain degree as a result of limited range of possible alterations [13]. New mixtures of existing excipients could be an interesting strategy to improve excipient functionality as almost all formulations consist of multiple excipients. Various feasible combinations of existing excipients can often achieve the required set of performance attributes. Still, the development of many of these combinations is a complicated process since one excipient might hinder the present functionality of another excipient [11].Currently there are diversified commercial Multifunctional Pharmaceutical excipients are available just like Ludipress (Co processed milk sugar, PVP), Panexea (Co processed MCC, HPMC and CPVD), Provosolv ODT (Co processed Microcystalline polysaccharide, mixture silica, Mannitol, Fructose, Crospovidone) etc. Reveals improved functionality.[25]
Lactose monohydrate (LM) and microcrystalline cellulose (MC) are widely used functional excipients utilized in solid dosage forms. The two are naturally produced and widely used in the pharmaceuticals, either independently or together. Due to the inherent compactability attributes, microcrystalline cellulose (MCC) is widespread as an excipient in tablet formulations. Good binder and disintegration characteristics are attained with microcrystalline cellulose when employed in directly compressed tablet formulations [23]. On the other hand, microcrystalline cellulose, often has lubricating sensitivity. Lubricant sensitivity pertains to the decrease in the bonding between the plastically-deforming particles inside the powder containing lubricant, that leads to lowering of tablet strength or hardness [26]. In the pharmaceutical manufacturing, lactose is among the most frequently used excipients; however, just like many other excipients, lactose might not be well suited for direct compression as a result of inadequate powder flow or compaction characteristics [27]. To formulate synergistic functional performance of lactose monohydrate and microcrystalline cellulose, including improved compactability and powder flow, LM and MC were co-dried utilizing microwave induced diffusion, resulting in a monoparticulate system developing two compaction mechanisms, brittle fracture and plastic deformation, in discrete particles. Current excipient provides the flow and compaction properties intended for direct compression tableting. Optimized composition comprises 70 % alpha-lactose monohydrate and 30 % microcrystalline cellulose (MCC), each of those preserving their individual chemical identities. The excellent compactability of the material is produced by the synergic effect of consolidation by fragmentation of lactose as well as the plastic deformation of cellulose. While microwave drying, lactose particles cover the cellulose fibers developing granules of good flow. This unique excipient combines the good flowability and solubility of lactose together with the good water sorption and binding characteristics of cellulose [13].
Numerous procedures continue to be presented for synthesizing Multifunctional pharmaceutical excipients which include chemical modification, Physical modification, Grinding or sieving, Crystallization, Spray drying, Granulation/agglomeration and Dehydration [25]. Every single technique enlisted possesses its own benefits and drawbacks. Among all spray drying is a widespread approach to generate multifunctional excipients. Spray Drying produce highly porous particles with better flow and tabletability resulting in shorter time of disintegration inside the physiological fluids. Spray drying technology, is actually an expensive technique and also, it’s a time intensive process which usually produces less material. In current research attempts had been made to conquer the drawbacks of spray drying technology employing microwave drying.
Microwave radiation comprises of electromagnetic waves with frequencies between the infrared and radio waves, which is from the range of 0.3-300 GHz. It passes throughout the materials and oscillate their molecules, which usually produces heat. Microwave heating may confer several advantages above conventional heating, including quick heating and cooling, reduced temperature gradients through the sample, reduced energy usage, and superior reaction rates [28].
renewable and effective application intended for producing molecular dispersions.
2.
MATERIAL AND METHODS
2.1. Materials
α -Lactose monohydrate (LM) Ph. Eur., Microcrystalline cellulose (MC) and Cellactose was obtained respectively from Merck, India, RanQ Pharmaceuticals & Excipients Pvt. Ltd, Maharashtra, India, & MEGGLE Excipients & Technologies, Germany. Paracetamol and Aspirin were obtained as generous gift sample from Glenmark Pharmaceuticals, India.
2.2. Preparation of Multifunctional Composite Particles
A physical blend of the LM and MC was made by blending LM and MC in the specified proportion according to Table 1. Perfectly weighed quantity of the LM and MC was then passed through the ASTM # 60 sieve. The definite amount of distilled water was taken to stainless steel container and then slurry was prepared under stirring with the addition of a specified quantity of the sifted physical mixture slowly (Table 1). Slurry made as per table 1 was then held under stirring to obtain a homogeneous dispersion at 1400 RPM for a specified span of time to ensure interaction and association of LM and MC particles. Slurry was then shifted right into a glass beaker thereafter microwaved (Catalyst 2R, Catalytic Systems, India.) at 600 W for 4 minutes, mixture was then agitated with the help of glass rod. Later it was microwaved at 450 W for 5 minutes, resulting aggregates were consequently passed through ASTM # 20 and ASTM #30 sieves sequentially. Obtained aggregates were again microwaved at 200 W to find a moisture content lower than 5 % w/w. Final aggregates were therefore passed through ASTM # 40, 60 and 80. Finally, the mixture was kept in a screw-capped bottle until required.
2.3. Box–Behnken Experimental Design
Experimental designs are helpful in preparing a formulation demanding less experimentation and featuring estimates of the relative relevance of numerous variables. This study utilized the Box-Behnken model (BBD), a response surface methodology, as it needs fewer runs within a 3-factor experimental design than all other RSM designs, and is
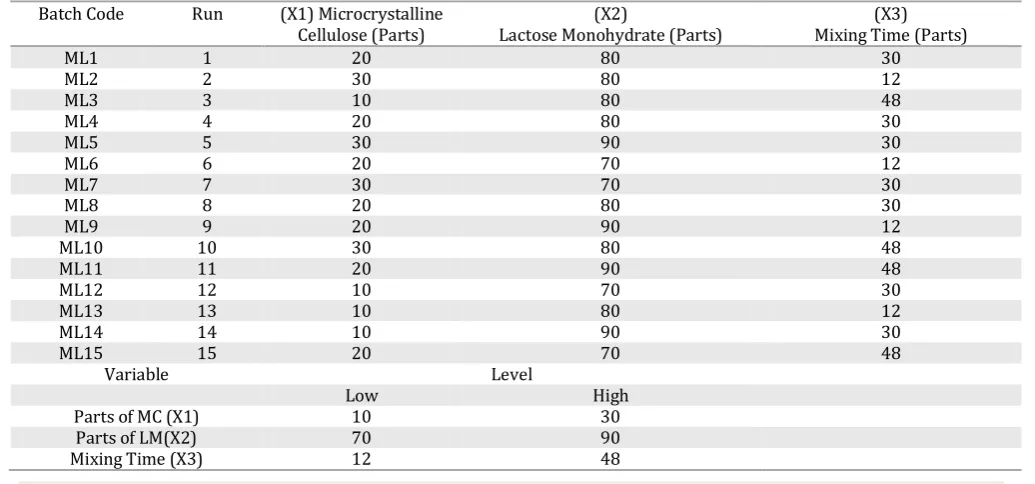
particularly beneficial when excessive treatment combinations has to be eliminated. Additionally, it helped to comprehend the relationship among independent and dependent variables in the formulations [29]. Primary experiments were conducted to choose the levels of excipients that have been evaluated around the mixture's capability to constitute the best composite. Three factors were identified effect on composite characteristics, those factors are Parts of microcrystalline cellulose (X1), Parts of Lactose monohydrate (X2) and Mixing time required for preparing slurry in Hrs (X3). Initial research likewise presented a set-up of the levels for every formulation variable. (Table 1). The chosen responses were Angle of Repose (Y1), percent fines (Y2), Carr’s Index (Y3), Tablet Friability (Y4), Tensile strength (Y5) and Disintegration time (Y6). A three-factor three-level Box-Behnken experimental design is utilized in the current study to assess the effects of chosen independent variables on the responses. This design is appropriate for investigation of quadratic response surfaces as well as for generating second order polynomial models, hence assisting to optimize the process by using a small number of experimental runs. A total of 15 experimental runs designed by BBD is demonstrated in Table 1. The design comprises center points with replicates and a set of the mid- points of each edge of the multidimensional cube. The model features the subsequent form: Y = b0 + b1X1 + b2X2 + b3X3 + b4X12 + b5X1X2 + b6X1X3 + b7X22 + b8X2X3 + b9X32 + E (1), where Y is the selected response, b0–b9 are the regression coefficients, X1, X2 and X3 are the factors studied and E is an error term. BBD is an orthogonal design; hence, the factor levels are evenly spaced. Coding for low, medium and high settings was as −1, 0 and +1. Subsequent to building the polynomial equations relating the dependent and independent factors, the method was optimized to uncover the levels of X1, X2 and X3, which give optimum values of Y1, Y2, Y3, Y4, and Y5. Box-Behnken experimental design. To confirm these values, a new formula was set based on the predicted levels of X1, X2 and X3. Finally, the obtained responses (Y1, Y2, Y3, Y4, and Y5) were assessed and then compared with computed values. A design expert software program (Version 8.0.4; Stat-Ease, Inc., MN, USA) was used to obtain the design. The software chosen a set of candidate points & quadratic model data fitting was performed.
Table 1: Experimental ranges of independent variables
Batch Code Run (X1) Microcrystalline
Cellulose (Parts) Lactose Monohydrate (Parts) (X2) Mixing Time (Parts) (X3)
ML1 1 20 80 30
ML2 2 30 80 12
ML3 3 10 80 48
ML4 4 20 80 30
ML5 5 30 90 30
ML6 6 20 70 12
ML7 7 30 70 30
ML8 8 20 80 30
ML9 9 20 90 12
ML10 10 30 80 48
ML11 11 20 90 48
ML12 12 10 70 30
ML13 13 10 80 12
ML14 14 10 90 30
ML15 15 20 70 48
Variable Level
Low High
Parts of MC (X1) 10 30
Parts of LM(X2) 70 90
2.4. Evaluation of Microwave generated composites:
2.4.1. Moisture Content
A fast infrared moisture analyzer (METTLER TOLEDO, Germany) was employed to determine moisture content of composite powder accurately. Roughly 1 g of screening sample was spread over the disc, and the results were recorded after constant reading was displayed.
2.4.2. Percentage of fines in composites
Percent fines were calculated considering the percentage quantity of composites getting through 200 # (74 μm). A definite quantity of the composites was agitated upon an Electromagnetic Sieve Shaker (EMS-8, Electrolab, India) equipped with 200 # sieve for 5 min. The quantity obtained below sieve was calculated as percentage of fines.
2.4.3. Bulk Density and Tapped density determination
The bulk and tapped density can be discovered employing a tap density apparatus (EDT-1020, Electrolab, India.). Defined amount of the test sample (20 g) was placed in a measuring cylinder, and the bulk volume is determined. 20 g of the material was added to 100 ml measuring cylinder to determine tapped density. The observed untapped volume is noted. The cylinder is tapped at pre-set drop distance of 14 ± 2 mm with the rate of 300 drops/min. Following the first 500 drops, the volume of the material inside the cylinder is scored. Furthermore tapping (750 and then 1250 drops consecutively) is applied. This final volume is presumed to be tapped volume. Bulk/tap densities had been determined according to the following equations.
( )
(1)
( )
(2)
2.4.4. Carr’s Compressibility Index and Hausner’s ratio:
This represents the percentage of difference between the tapped density and the bulk density against tapped density, also described as the compressibility index (equations 3). Ratio of the tapped to bulk density is expressed as Hausner’s ratio (equations 4). Hausner’s ratio ranges from about free-flowing powder (1.2) to cohesive powders (1.6). Carr's index of about 5 - 12% suggest free flowing powder; 23 - 35% specify poor flow and extremely poor flow >40% [30].
(
) (3)
(4)
2.4.5. Angle of Repose
The angle of repose can often be employed to evaluate the flow of powders. It is the maximum angle ϴ between the plane of the heap of powder and horizontal surface of powder heap. The value of ϴ below 30° demonstrates free flowing material, up to 40° designates reasonable flow, and over 50° suggests distinct difficulty in powder flow. A glass funnel was fixed on a stand with height to the tip of the funnel was 10 cm from the table surface. 10 g of sample was added through the funnel, with a gap of funnel halted up with a cotton wool. After removing it a powdered heap was formed. The height was assessed as H (cm). Radius, R was obtained from the circumference of the heap. The angle of repose can be determined applying equation 5 [17].
(5)
2.4.6. Water absorption ratio (%)
A piece of multi folded tissue paper was placed into a small Petri dish comprising distilled water (10 ml). A tablet was placed on the center of the paper, and the time required for complete wetting was noted. The water absorption ratio (R) was calculated using the following equation.
( )
(6)
Where Wb and Wa is the weight of the tablet before water absorption after water absorption respectively [31].
2.4.7. Tablet manufacture
The composites of batches ML1-ML15 were blended for 5 min with 2% talc and later 2 min with 1% magnesium stearate. Tablets were manufactured using a Rimek rotary tablet press with flat-faced punches and dies with a diameter of 11 mm (Cadmach Machinery Private Ltd., India). Average tablet weight targeted was 400 mg. Tablet thickness was kept ranging between 0.30 to 0.40 cm throughout the manufacturing of the tablets.
2.4.8. Tablet evaluation
2.4.8.1. Tensile strength
Tablet dimensions were determined using a micrometre. The crushing strength of the tablet was estimated after 24 h considering stress relaxation post compression. Erweka hardness tester (TBH 125 Series, ERWEKA GmbH, Germany) was used to determine crushing strength. The tablet tensile strength (MPa) can be calculated using following equation, considering crushing strength (P, kg), diameter (D, cm) and thickness (L, cm) [32].
(7)
2.4.8.2. Friability
Tablet friability was determined by tumbling tablets in a friabilator (Model EF2, Electrolab, India) for 4 min at 25 r/min. The dust was removed from the tablets, friability can be calculated as the percent loss in weight of 20 tablets [33]. 2.4.8.3. Disintegration time
Disintegration testing was completed according to USP24 (Model ED2, Electrolab, India). Disintegration of six tablets at 37ºC in 900 ml distilled water was observed [34].
2.4.8.4. Calculation of composite index
With the fulfilment of the individual tests a weighted composite index was employed to acquire a single score implementing two responses, i.e., Carr’s index (%), and Friability (%). As it's challenging to estimate the relative impact of the individual constraint to the “true” composite score, arbitrary value was designated for one-half of each of the two response variables. A score 100 for an optimum result for each of the two responses was considered. Each formulation result was altered to a value between 0 and 50. For Carr’s index, allocated lowest and highest value 12.00 and 40 respectively, with corresponding score 50 and zero. Similarly, for friability (%), allocated lowest and highest value 0.35 and 1.45 respectively with corresponding score 50 and zero. The batch with the highest composite index can be considered as the batch with desired characteristics. The raw data transformations can be done using Equation:
Where, Yi, Ymax and Ymin are the experimental, maximum and minimum values of the individual response, correspondingly [35].
Composite index = transformed value of Carr’s index + transformed value of friability (%) (9)
2.5. Evaluation of optimized composites
2.5.1.Fourier transform infrared (FTIR) spectral study
Native excipients LM, MC, physical mixture of LM & MC (70:30) and optimized MCLM composites had been taken up to evaluate interaction amongst LM and MC using FT-IR spectra. Test sample being analysed was mixed up with IR grade potassium bromide (KBr) in the ratio of 1:100 and compressed utilizing pellet press machine (Kimaya engineers, India) applying 15 tons pressure. FT-IR spectrophotometer (Shimadzu 8400S, Japan) was used to analyse the prepared pellets. Comparison of the principal peaks from FT-IR spectra of native excipients, physical mixture and optimized composites was done to assess the transformation occurred if any.
2.5.2. Differential scanning calorimetry
Differential Scanning Calorimetry (DSC) of LM, MC, physical mixture of LM & MC (70:30) and optimized MCLM composites was performed to assess the changes that had actually occurred when MCLM composites were manufactured. Differential Scanning Calorimeter (DSC 60, Shimadzu, Japan) was used to obtain DSC curves by keeping samples in reference pan at a heating rate of 10 °C/min from 0 to 350 °C in nitrogen atmosphere.
2.5.3. Determination of particle shape
Motic (optical) microscope coupled with an Olympus digital camera having pre calibrated magnification lenses was employed to measure the particle shape in the current research. Optimized excipient aggregate was transferred to slide and then mounted on the stagecoach. Particle shape was determined using 10X magnification lens with built-in camera was turned on. Afterwards, the image was captured by using Motic Images plus 2.0 software [21].
2.5.4. Particle size distribution
Sieve Shaker (EMS-8, Electrolab, India) was employed to determine particle size distribution by sieve size analysis. The particle size distribution of optimized composites was calculated using a stack of standard sieves with the aperture of 149, 125, 106, 90 and 74-μm. A 20 g of the powder sample was added on the top sieve and shaker was turned in with the speed of 1.50 mm/g for 5 min. The weight of material held on each sieve was identified. The mean composite diameter was calculated through the percent weight of composites retained on each sieve [36]. The average diameter can be calculated using the equation:
( ) ( )
(10)
2.5.5. True density
The specific gravity (pycnometer) bottle technique was utilized for determination of true density, employing acetone as displacement fluid. Bottle rinsed with acetone was filled to spilled over, excess liquid was wiped away. The weight of the bottle loaded with acetone was mentioned as (a), the bottle was purged, cleaned and dried. 2 g excipient sample was placed into the pycnometer, the weight of the powder was mentioned as (w). Pycnometer comprising the composite powder was partially filled up with acetone, shaken and kept aside for 10 minutes so air bubbles will get freed. Finally, pycnometer was filled with acetone and the
weight of the bottle was noted as (b). True density was afterwards calculated as:
[( ) ] (11)
Where ℓ is the particle density of Composite and S is the specific gravity of Acetone = 0.786 [37].
2.5.6. Determination of tablets packing fraction
The packing fraction of the tablets can be calculated using the particle densities of the tablet formulation. The packing fraction, Pf, is determined using the following equation:
(12)
Where W, r, t, l are weight of the tablets, radius, thickness, and l is the particle density of tablet using fluid displacement method respectively [38].
2.5.7. Porosity
Porosity can be demonstrated as the interarticular space. The volume occupied by certain weight of powder is bulk volume. Porosity can be calculated using true and bulk densities as per following equation [36].
( ) ( ) (13)
Where, is the bulk density, D is the true density, and e is the porosity
2.5.8. Moisture uptake study
2 g optimized composites were spread homogeneously on a Petri dish (5 cm diameter), and the dish was then stored in stability chamber (Newtronic, India) at 40˚C and 75% relative humidity. The percent gain in weight was observed after 24 h. [36].
2.5.9. Loading capacity
Drug loading capacity of excipient can be explained as the minimum concentration at which the excipient can be mixed with a drug and the mix keeps the desirable properties of the excipient, such as compressibility, flow rate, the ability to form hard compacts at low pressures, and so on. Since drug loading is among the major constraints of several native excipients, drug-loading capacities of Pure excipients LM, MC, physical mixture of LM & MC (70:30) and optimized MCLM composites were performed. Various ratios of paracetamol and each of the excipient mixtures were prepared so that each tablet consists of 400 mg paracetamol and the excipients. The ratio of paracetamol as to excipient was kept as 400:0, 300:100, 200:200, 100:300 and 0:400. Powder mixtures were compacted at a compression pressure of 25 kN using a single press tablet compression machine (Cadmach engineering, Ahmadabad, India.) using 11.0 mm punch and die set. The punch and die set were pre lubricated with a 10 % w/v magnesium stearate dispersion in ethanol. The compacts were kept in an airtight glass container for 24 h before hardness determination. The tablets were tested for hardness using Erweka hardness tester (TBH 125 Series, ERWEKA GmbH, Germany.) and friability (Model EF2, Electrolab, India). [39].
2.5.10. Disintegration efficiency
employing a rotary tablet press (Cadmach engineering, Ahmadabad, India.) with 11.5 mm punch and die. The compacts were kept in an airtight glass container for 24 h before hardness determination (TBH 125 Series, ERWEKA GmbH, Germany) and friability with a friabilator (Model EF2, Electrolab, India) [39].
2.5.11. Lubricant sensitivity
The sensitivity of each excipient to lubricant was evaluated by using Lubricant sensitivity test (LS). The test was performed by mixing powders with magnesium stearate (MS) passed earlier through a 250 μm sieve. With all the different lubricants being used, magnesium stearate is the most widespread exhibit low friction coefficient and high covering potential. Lubricant sensitivity analysis was conducted by means of the method described by Rojas et al. [40] with slight modification. Individual excipient and 1 % magnesium stearate were blended using a bin blender ranging from 10 to 60 min. After blending, the powder mass was screened through ASTM # 30 screen. 400 mg tablets of were compressed using rotary press with compaction pressure of 70 MPa. Similar method was used to prepare tablets without lubricants. Lubricant sensitivity (LS) can be calculated using the Equation,
(14)
Where Hlub and Ho are the hardness of the tablets prepared with and without lubricants [41].
2.5.12. Heckel compressibility analysis.
Sufficient tablet strength can be accomplished utilizing correct ratio of plastic and brittle materials in a tablet formulation. Hence Heckel equation is an attractive alternative of classifying material. Heckel analysis was performed using the equation below,
(
) (15)
(16)
Where D is the relative density of the compact at pressure P, ε is the porosity of powders, and K and A are constants. The slope of the Straight line, K is reciprocal of the mean yield force, PY of the material and ε is the porosity of a powder bed. The Heckel equation represents the relationship of the compact density with the applied pressure. The rate of density increase with applied pressure is proportional to the volume fraction of pores [42].
2.5.13. Tablet elastic recovery test
This study was performed to obtain information about elastic recovery during a compression cycle by measuring the expansion of the tablet after ejection, thereby to measure the whole recovery process, which means the time dependency of elastic recovery. Tablets with 400 mg weight were manufactured using 11.5 mm die on a tablet press with Compression pressure of 200 MPa at the speed of 10 mm/min. The Elastic Recovery can be calculated by the thickness of each tablet under maximum pressure (Hc) and after 24 hours from tablet ejection (He) is given by [43],
(17)
After 24 hours of tablet ejection, its weight, diameter, thickness and apparent density was determined. The true density (ρt) and tablet porosity (€) was measured with a pycnometer.
(18)
2.5.14. The Kawakita analysis
Packability determination using the Kawakita analysis was accomplished. In this technique 10 g of powder was poured into a 50 ml glass measuring cylinder. The heaped particles inside the cylinder were leveled using scale and the bulk volume Vo was noted. Mechanical tapping was initiated afterwards and the difference in volume of the powder Vn was noted after N no of taps. The behavior of Pure excipients LM, MC. physical mixture of LM & MC (70:30) and optimized MCLM composites in the tapping procedure were compared using numerical constants obtained from Kawakita plots. The information was examined using Kawakita’s [44] and Kuno’s [45] equation,
Equation and, respectively.
(19)
(20)
Where “a” and “b” are constants, n is the number of taps, and Vo, Vn, and Vinf are the powder bed volumes initially, after nth tapping and at equilibrium, correspondingly.
( ) ( ) (21)
Where ρo, ρn, and ρf, are the apparent densities initially, after the nth tapping (5, 10,15, 20, 25, 50, 75, 100) and at equilibrium (100th tap) respectively, and k is a constant.
2.6. Formulation and evaluation of tablets containing
model drug
Paracetamol was chosen as a model drug to determine the flow, compressibility as well as the tableting behaviour of the designed multifunctional excipient. 50 % W/W paracetamol, optimized composites and talc (2 % w/w) were sifted through # 60 sieve and blended in a bin blender for 5 min. Subsequent addition and blending (2 min) with 1 % w/w Magnesium stearate was done. Obtained blend was directly compressed as 400 mg tablet with 10 rotary tablet press (Cadmach Machinery Private Ltd., Ahmedabad) using 11.5 mm dies and punches. The tablets were evaluated for weight variation, friability, tensile strength, disintegration time, and in-vitro drug release.
2.6.1.Hardness, Thickness, and Diameter
Thickness, diameter and hardness of tablets was determined using Tablet Hardness Tester (TBH 125 Series, ERWEKA GmbH, Germany.) The outcome is the average of 10 determinations.
2.6.2.In-vitro drug release
The in-vitro drug release profile of paracetamol tablets was examined using a USP apparatus (model TDT-60T, Electrolab, India.) using baskets (50 rpm) with phosphate buffer (pH–5.8) as the dissolution medium at 37 ± 0.5ºC. 10 ml samples were withdrawn at programmed time intervals, filtered through a 0.45 μm membrane filter, and assayed at 243 nm in a UV/vis spectrophotometer (Shimadzu 1601, Tokyo, Japan) to build dissolution profile. Fresh dissolution medium (10 ml) was added immediately after samples were withdrawn.
2.6.3.Short-term stability study
3.
RESULTS AND DISCUSSION
3.1. Box–Behnken Experimental Design
Optimization with factorial designs and evaluation of the response surfaces are robust, effective, and organized tools that cut short enough time essential for the development of pharmaceutical dosage forms and boosts research output. Box Behnken (BB) experimental design enables the formulator to employ 3 levels of each factor (that has each factor positioned amongst each equally spaced value to assure orthogonality and near rotatability) to measure second-order response models in 15 runs, includes 3-replicated center points of a cubical design. [46]. BB design is known to generate a second-order polynomial model to
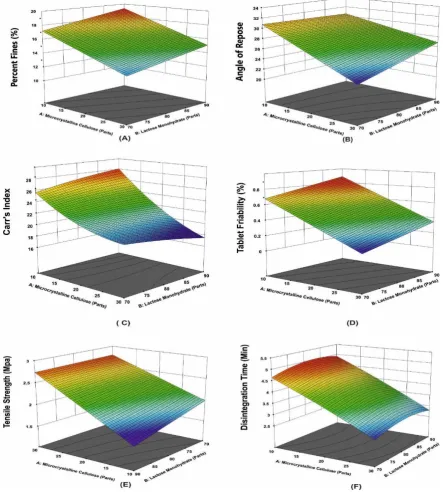
explain the mutual dependency with the examined variables [47]. Three primary independent variables which have distinctive effects on manufacturing multifunctional excipient composites had been uncovered. All these important factors consist of Parts of microcrystalline cellulose (X1), Parts of Lactose monohydrate (X2) and Mixing time in Hrs (X3). As a result, fifteen distinct combinations were manufactured, by using the values of the major selective variables X1, X2 and X3 at different levels as shown in Table 1. Responses for all 15 experimental runs of a BB design (ML1-ML15), performed according to Table 1 are shown in figure 1. Referring to diverse mixtures of factors and factor levels, a substantial difference between flowability, compressibility and percent fines was observed.
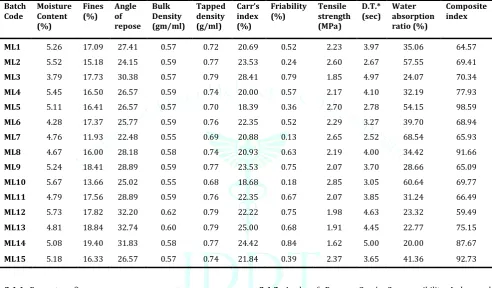
Table 2: Composition of batches prepared and observed responses
Batch
Code Moisture Content (%)
Fines
(%) Angle of
repose Bulk Density (gm/ml)
Tapped density (g/ml)
Carr’s index (%)
Friability
(%) Tensile strength
(MPa)
D.T.*
(sec) Waterabsorption
ratio (%)
Composite index
ML1 5.26 17.09 27.41 0.57 0.72 20.69 0.52 2.23 3.97 35.06 64.57
ML2 5.52 15.18 24.15 0.59 0.77 23.53 0.24 2.60 2.67 57.55 69.41
ML3 3.79 17.73 30.38 0.57 0.79 28.41 0.79 1.85 4.97 24.07 70.34
ML4 5.45 16.50 26.57 0.59 0.74 20.00 0.57 2.17 4.10 32.19 77.93
ML5 5.11 16.41 26.57 0.57 0.70 18.39 0.36 2.70 2.78 54.15 98.59
ML6 4.28 17.37 25.77 0.59 0.76 22.35 0.52 2.29 3.27 39.70 68.94
ML7 4.76 11.93 22.48 0.55 0.69 20.88 0.13 2.65 2.52 68.54 65.93
ML8 4.67 16.00 28.18 0.58 0.74 20.93 0.63 2.19 4.00 34.42 91.66
ML9 5.24 18.41 28.89 0.59 0.77 23.53 0.75 2.07 3.70 28.66 65.09
ML10 5.67 13.66 25.02 0.55 0.68 18.68 0.18 2.85 3.05 60.64 69.77
ML11 4.79 17.56 28.89 0.59 0.76 22.35 0.67 2.07 3.85 31.24 66.49
ML12 5.73 17.82 32.20 0.62 0.79 22.22 0.75 1.98 4.63 23.32 59.49
ML13 4.81 18.84 32.74 0.60 0.79 25.00 0.68 1.91 4.45 22.77 75.15
ML14 5.08 19.40 31.83 0.58 0.77 24.42 0.84 1.62 5.00 20.00 87.67
ML15 5.18 16.33 26.57 0.57 0.74 21.84 0.39 2.37 3.65 41.36 92.73
3.1.1.Percentage fines
The mathematical model resulted in for the response Y1 (Percent Fines) is as follows
Y1=+16.68-2.08.X1+1.04.X2-0.56.X3
Figure 1 (A) shows a 3D response surface plot predicted through the linear model reveals effect of factor MC (X1), LM (X2) and Mixing time (X3) on response percentage fines (Y1). As it was constructed with ANOVA values, X1 and X2 factors happen to be significant model terms in case of percent fines. The amount of fines inside formulation makes a difference to flow, compaction, and consolidation. Percentage of fines for batches ML1-ML15 are presented in Table 2. The batches composed of a low level of MC showed a slightly higher percentage of fines than any other batches as a result of insufficient binding activity of MC [26]. No batch demonstrated fine more than 19.4 %. The limit for fines was set at 20 % as an arbitrary requirement for the choice of a batch. All the batches fulfilled the selection criteria at the three different levels of MC and LM for the percentage of fines.
3.1.2.Angle of Repose, Carr’s Compressibility Index and
Hausner’s ratio:
The mathematical model resulted in for the responseY2 (Angle of Repose) and Y3 (Carr’s Compressibility Index) are as follows,
Y2=+27.84-3.62.X1+1.14.X2-0.087.X3+1.11.X1.X2+0.81.X1.X3-0.20.X2.X3
Y3=+20.54-2.32.X1+0.17.X2-0.39.X3-1.17.X1.X2-2.06.X1.X3-0.17.X2.X3+1.16.X1²-0.22.X2²+2.2.X3²
(Table 2) that the MCLM composites have enhanced flow properties than the inherent excipients. Almost all composites with a greater amount of microcrystalline cellulose demonstrated the lesser angle of repose and good to fair compressibility and vice versa. The desirable flowability & compressibility of the composites may be due to diffused agglomeration of MC and LM particles with propinquity of water in the microwave [28]. From Table 2, it could be observed that a microwaving process, resulting in near spherical particles, reduces the time required for the mass-flow of a given sample volume, thereby increasing the flow rate. LM alone display brittle fracture addressing poor compressibility while microcrystalline cellulose is actually a plastic material demonstrating good compressibility. The better compressibility from the composites might be caused by a coating of MC over LM particles with the presence of water in the microwave. This shows that microwave generated co-processed excipients are effective within the manufacturing of novel excipients with enhanced flowability [21].
3.1.3.Friability
The mathematical model generated for the responses Y4 (Friability) is as follows,
Y4=0.53-0.27X1+0.10.X2-0.02.X3
Figure 1 (D) displays a 3D response surface plot predicted through the special two factor interaction model reveals effect of factor MC (X1), LM (X2) and Mixing time (X3) on response percent friability (Y4). As it was constructed from ANOVA values, X1 and X2 factors are significant model terms in the event of friability. Disproportionate friability is unacceptable as, crumbling and dusting of the tablets lead to loss of the active ingredients, influences the tablet appearance and consumer appeal, and decreases the potency of any tablet. It could be ascribed by a range of factors like poor tablet design (too sharp edges), low moisture content, insufficient binder, etc. The friability of tablets reduced by the augmented amount of microcrystalline cellulose. This could be resulting from good binding properties of microcrystalline cellulose. Mixing time for preparing excipient composites likewise have vital effect as a model term, this suggests increased mixing time will allow good association of MC and LM particles and therefore composites with better resistance from friability.
3.1.4.Tensile strength
The mathematical model generated for the responses Y5 (Tensile strength) is as follows
Y5=2.24+0.43.X1-0. 104.X2+0. 031.X3+0. 10X1.X2+0.08.X1.X3-0. 02X2.X3
Figure 1 (E) displays a 3D response surface plot predicted from the special two factor interaction model shows the effect of factor MC (X1), LM (X2) and Mixing time (X3) on response percent tensile strength (Y5). An ANOVA values
show X1, X2, X1X2 interaction and X1X3 interaction factors are significant model terms in the instance of tensile strength of tablets. Tablet strength is a vital property for patient handling, innocuous transportation and coating of tablets in a coating machine. The tensile strength of the tablets increased with increased mass of MC as well as LM. ANNOVA values implies prevalent impact of MC on tensile strength of tablets. This trend can be depicted through interfacial interaction of the particles. Edge et. al. [48] and van Veen et al. [49] discovered that the tensile strength improvement by physical modification of microcrystalline cellulose properties might be due to interfacial interaction instead of modification of bulk MC properties. Mixing time for preparing excipient composites likewise have a significant effect as a model term, this suggests increased mixing time allows good association of MC and LM particles and therefore composites with enhanced tensile strength. All experimental trials have demonstrated tensile strength ranging from 1.61 to 2.84 MPa. These outcomes suggested the fact that amount of MC played a substantial role within the manufacturing of satisfactory composites by the microwave-induced diffusion.
3.1.5.Disintegration time & water absorption ratio
The mathematical model generated for the responses Y6 (Disintegration time) is as follows
Y6=+4.02-1.X1+0.16.X2+0.18.X3-0.03.X1.X2-0.03.X1.X3-0.06.X2.X3-0.06.X1²-0.23.X2²-0.18.X3²
Figure 1: Response surface plots for (A) Percent Fines (B) Angle of Repose (C) Carr’s Index (D) Tablet Friability (E) Tensile strength (F) Disintegration Time
Table 3: Regression output for Box – Behnken Design for batches (ML1 to ML15)
Coefficient Angle of
Repose Carr's Index % Fines % Friability Tensile strength Disintegration Time
R2 0.97 0.97 0.85 0.92 0.98 0.99
Adjusted R2 0.94 0.92 0.82 0.89 0.96 0.98
P 0.0001 0.0280 0.0001 0.0001 0.0001 0.0001
3.2. Design optimization results
The six responses were plotted together by means of statease design expert software to evaluate a standard optimal region. The factors X1, X2 & X3 at 30 parts, 70 parts and 45.813 Hrs. correspondingly offered the optimum response of Y1: 13.07 %, Y2:22.77, Y3:19.84, Y4: 0.143%,
Table 4: Experimental and Predicted Values for the Optimized MCLM Composites
Response Experimental
valuea
Predicted value Percent
prediction errorb
Y1 13.68±0.37 13.07 4.47
Y2 23.40±0.91 22.77 2.68
Y3 20.67±0.44 19.84 4.01
Y4 0.133±0.01 0.14 7.73
Y5 2.692±0.09 2.78 3.36
Y6 2.761±0.05 2.64 4.46
a Mean of 3±SD b Percentage error was calculated using the formula [(Experimental value−Predicted value)/Experimental value] ×100
3.3. Moisture Content
Moisture content impact the physico-chemical and then microbiological properties of finished pharmaceutical goods. Optimum moisture content of excipient is accountable to good flowability and compressibility. The composites of batch ML1 to ML15 exhibited a moisture content between 3.79 to 5.73 % which was found optimum. All composites show considerably less moisture content as sufficient drying occurs in the microwave. The higher moisture content could possibly be a result of the normal water content of α-lactose monohydrate which is around 5%.
3.4. Calculation of composite index
All experimental batches fulfilled the decision criteria set for angle of repose and Carr’s index. Composite index near to 100 signifies the appropriateness of composition in terms of flow and compaction. The outcomes of composite index are demonstrated in Table 2, illustrates the highest index value of 98.59, 92.73 and 91.66 for batches ML5, NL15 and ML8 correspondingly. The index value indicates higher content of MC and mixing time is responsible for good flow and compressibility properties.
3.5. Characterization of optimized batch
3.5.1.Fourier transform infrared (FTIR) spectral study
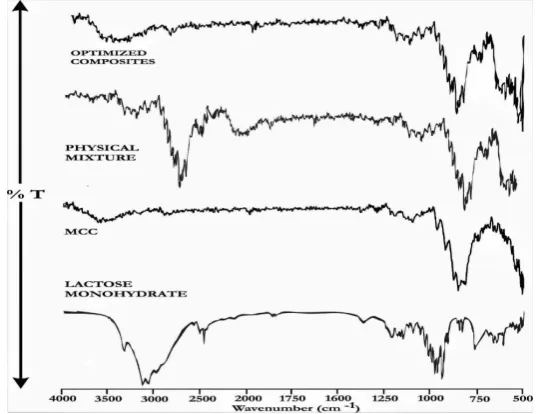
FT-IR spectroscopy facilitates identifying compounds by simple and quick technique. The IR spectrums of a given substance are unique and characteristic. IR spectrum can differentiate different types of bonds and help to get knowledge about structural changes and the interaction between the molecules. The IR spectra of MC, LM, Physical mixture of MC and LM (70:30) and MCLM Composites are presented in Figure 2. MC displays characteristic peaks at
3446 cm-1 (O-H stretching), 1431 cm-1 (intramolecular hydrogen bonds of the C6 group and O-H in-plane bending vibration), and 889 cm-1 (antisymmetric out-of-phase stretching vibration) [35]. The peaks of hydroxyl (O-H) and aromatic (C-C) groups of lactose monohydrate were found at 3389 and 1562 cm−1, respectively. Similar characteristic peaks were observed in both the physical mixture and optimized MCLM composites suggesting no chemical alteration of interaction has occurred during processing and physical mixing. The presence of some additional functional groups at 784 cm-1 compared to that of MC and LM against MCLM composites suggests physical modification of native excipient took place during microwave drying.
3.5.2. Differential scanning calorimetry
DSC is a beneficial technique of explaining polymers depending on their thermal transitions which can be endothermic or exothermic. DSC thermogram of any compound exhibits first endothermic peak known as glass transition (Tg) & and second endothermic peak as melting (Tm) temperature which can be easily identified in any endotherm. The DSC thermograms of MC, LM, Physical mixture of MC and LM and MCLM composites are manifested in Figure 3. In DSC of LM desolvation endotherm is evident in the 140-160° C region, melting endotherm at somewhere around 217°C and small decomposition endothermic peak at 225°C, while in case of MC melting endotherm was detected at 230°C. Identical endothermic peaks were observed in optimized MCLM composites at 219 °C indicating no chemical modification has happened during the microwaving process. Investigation of thermograms of the MC, LM and the composite signifies little shifting of melting endotherm implies physical combination of MC and LM mixtures yielding novel functional composite excipient.
Figure 2: FT- IR Spectrum of (A) Lactose monohydrate (B) Microcrystalline Cellulose (C) Physical Mixture of LM and MC
Figure 3: DSC of (A) Lactose monohydrate (B) Microcrystalline Cellulose (C) Physical Mixture of LM and MC (70:30) (D) Optimized MCLM Composites
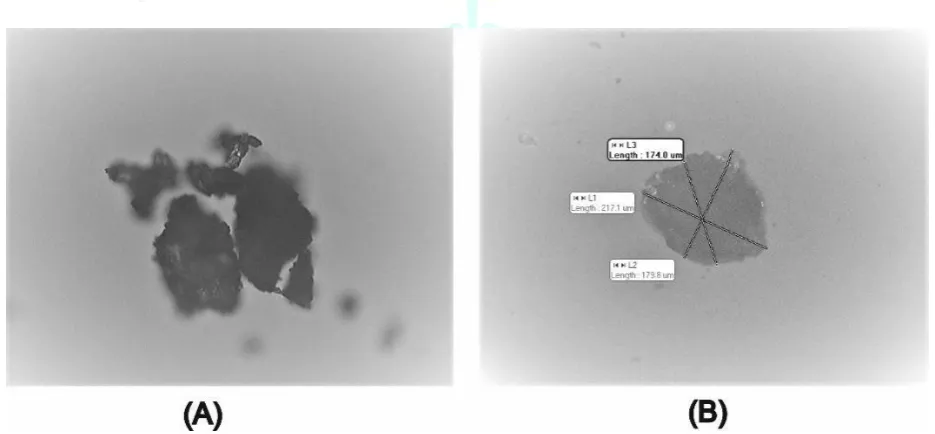
3.5.3. Determination of particle shape
Photomicrographs captured in the Motic software package for optimized composite excipient are embodied in Figure 4. From photomicrographs particle shape was observed to be
elongated to asymmetrically spherical. Particle size determined employing image pro software was found in a range of 80 to 174 µm. Based on the spherical shape observed for MCLM composites are expected to flow freely dues to elongated and near spherical shape.
Figure 4: Photomicrographs of Optimized MCLM composites at 10X
3.5.4. Particle size distribution
Optimum amount of fines in powder blends for direct compression is a key factor as it may lead to segregation which will results in poor powder homogeneity yielding weight variation of tablets. All of the composites of batch ML1 to ML15 and optimized composites passed through an ASTM # 80 (180 μm) sieve during particle size distribution estimation using sieve analysis. Whereas not more than 3 % of agglomerates were retained on an ASTM # 200 (74 μm) sieve. The optimized composites demonstrated mean particle size 92.86±0.37 μm. This elaborates better particle
size distribution profile with optimum fines suggesting best fit for achieving good blend and content uniformity during tablet manufacturing [28].
3.5.5. True density and Porosity
manufactured tablets. [20]. The composites of batch ML1 to ML15 and optimized composites exhibited true density between 1.42 to 1.55 and porosity varying through 24.71 % to 32.23 %. True density of physical mixture of LM & MC, cellactose and optimized composites was found to be 1.53,1.57 and 1.42 respectively, while porosity was found to be 24.98, 39.49 and 30.68 respectively. The porosity of co processed excipients was found higher, which may be due to physical modification done using spray and microwave drying as they generate porous particles. Effect of porosity on tablet compressibility can be well discussed using Kawakita and Kuno’s equation in further discussions.
3.5.6. Moisture uptake study
Moisture content of excipients is a key factor that may alter physical, chemical and microbiological properties of formulation and ultimately quality of final product. Optimum moisture content in excipient is necessary for better compressibility properties. Immediately after 24 h storage at 40˚C temperature and 75 % relative humidity, composites of batch ML1 to ML15 exhibited moisture uptake between 5 to 18 %, it was observed that moisture uptake capacity elevated with increased quantity of MC as it possesses moisture uptake properties [13]. Optimized composites adsorbed 4.99±0.77% w/w moisture demonstrating poor moisture sensitivity of optimized composites indicating use of excipient to formulate better physical, chemical and microbiological quality attributes.
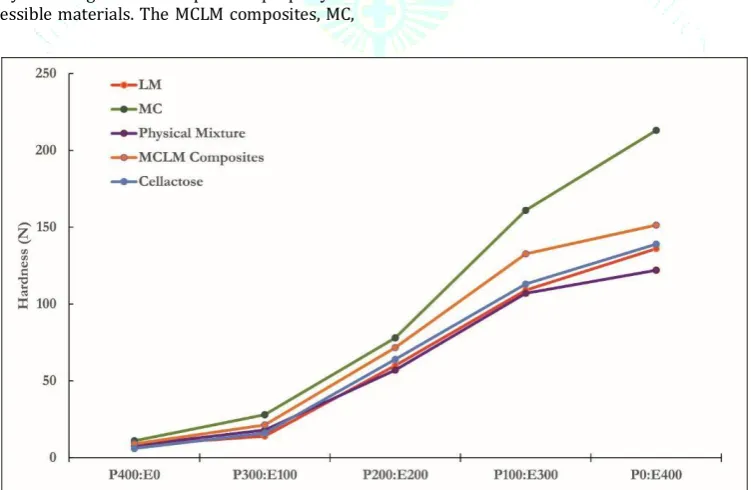
3.5.7. Loading capacity
Loading capacity is recognized as important property of directly compressible materials. The MCLM composites, MC,
LM, physical mixture of LM and MC (70:30) and cellactose were subjected for loading capacity determination. A model drug selected for the loading capacity determination was Paracetamol (PAR) owing to its poor compaction property & its capability to undergo a considerable elastic recovery as an when compaction pressure is withdrawn [51]. Loading capacity implies the amount of drug which can be appended in formulation. The larger the loading capacity, higher the quantity of drug that can be appended. Figure 5 illustrates the increased hardness with increased excipient ratio in accordance with that of PAR in the compacts. Compacts manufactured with all excipients demonstrated similar hardness attributes with ratio of P300: E100 (Figure 5). MC compacts had highest hardness followed by optimized composites and cellactose at the varying ratio after P300: E100. Higher loading capacity of MC can be correlated perfectly with porosity. Blends with MCLM composites offered lower values of hardness than blends with MC when the paracetamol percentage was below 50%. Optimized MCLM composites demonstrated better hardness profile than cellactose. In this instance, the best excipient was defined as the one which, when mixed with paracetamol, was significantly less influenced in its flow and compactability properties. These conditions are best achieved by Optimized MCLM composites. Bulk and tapped densities of excipients demonstrated inverse relationship with the powder’s loading capacity. The loading capacity of the various excipients as examined by the compact hardness of equal excipient and PAR mixture can be sequenced as follows (MC > MCLM optimized composites > Cellactose >LM>Physical Mixture).
Figure 5: Loading capacity of (A) Lactose monohydrate (B) Microcrystalline Cellulose (C) Physical Mixture of LM and MC
(70:30) (D) Optimized MCLM Composites (E) Cellactose
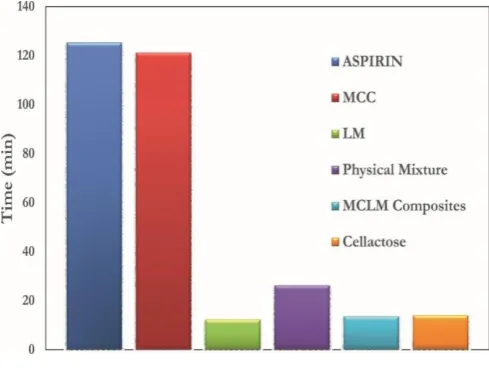
3.5.8. Disintegration efficiency
The objective of analyzing disintegration efficiency was to assess the disintegration behavior of newly formed excipient without disintergrant. The disintegration time of aspirin tablets manufactured with MC, LM, Physical Mixture of MC & LM (30:70), MCLM composites and cellactose are shown in Figure 6. A model drug chosen for study was aspirin due to its low solubility in water and good compatibility. The compressed aspirin without excipient and with MC disintegrate after 2 hr. in contrast physical mixture exhibited disintegration time of (26.29±1.83 Min). Aspirin compacts
Figure 6: Disintegrant Efficiency of (A) Lactose monohydrate (B) Microcrystalline Cellulose (C) Physical
Mixture of LM and MC (70:30) (D) Optimized MCLM Composites (E) Cellactose
3.5.9. Lubricant sensitivity
Lubricants, when included in a small amount among two contacting or rubbing surfaces, reduce interfacial friction. It is well discovered that a large number of excipients in binary excipient drug mixtures reveals better compactability devoid of lubricants. If similar structure is augmented with
the magnesium stearate, distinctive decrease of hardness is observed with the same compacting pressure. This change might be attributed to decrease in adhesion. It is familiarized that prolonged mixing of magnesium stearate with agglomerates generate a film over the agglomerates and prevent binding of agglomerates [63]. Materials with plastic deformation possess more sensitivity than with brittle fracture deformation. The lubricant sensitivity reflects capacity of the material to mix with lubricant; the higher the ratio, the greater the ability to mix with a lubricant. The mixing time is an essential element that influences tensile strength [35]. From the results it is evident that prolonged mixing of magnesium stearate lowered the tablet hardness. MCLM composites express slight sensitivity to the Mg Stearate. Presence of lubricant has insignificant influence on the consolidation of MCLM composites since the fragmenting behavior predominates plenty of fresh surfaces of lactose are produced under compression and, therefore, the effect of the lubricant would be at a minimum. Figure 7 illustrates the profile for lubricant sensitivity ranged as Physical Mixture>LM>MC>Optimized MCLM composites>Cellactose. Figure 7 symbolizes the effect of blending time on lubricant sensitivity. Lubricant sensitivity within 30 min of blending for Optimized MCLM composites and cellactose implies that newly available sites for particle binding are created soon after 30 min. Amongst all compositions highest sensitivity has been demonstrated by a physical mixture, indicating need of processing excipients for enhanced compaction properties.
Figure 7: Lubricant Sensitivity of (A) Lactose monohydrate (B) Microcrystalline Cellulose (C) Physical Mixture of LM and MC
(70:30) (D) Optimized MCLM Composites (E) Cellactose
3.5.10. Tablet elastic recovery test
Table 5 elaborates the outcomes of tablet elastic recovery (ER) tests. ER was found elevated in compacts with physical mixture, MC and LM while significantly less for optimized composites and cellactose. Elasticity property of the compact particles is reflected by ER. The high ER value represents a decline in tablet strength as a result of reduction in bonding surface area contributing to capping and lamination of tablets. The particle interaction affects the relaxation behavior of tablets. Tablet relaxation is usually regarded as an excellent balance concerning stored elastic energy as the key force of expansion and particle bonding as counteracting force [54]. LM and physical mixture represents highest elastic recovery, which may be due to higher particle size, crystallinity and the degree of disorder of LM particles [55]. MC represents the higher elastic recovery owing to its elongated shape and hydrophobic surfaces of MC, that could be resisting particle densification and interparticle bonding
[56].The lowest ER of MCLM and Cellactose tablets reflected higher inter-particulate bonding between particles masking hydrophobic surfaces of MC by hydrophilic surfaces of LM. It is trustworthy to note that elastic recovery properties of MC, LM and physical mixture of MC and LM are masked completely in optimized composites. The elastic recovery expressed by MC in present research work is overcome by hydrophilic properties of LM suggesting functional use of co processing MC and LM by microwave drying which LM covers MC particles in composite aggregates. ER results of optimized MCLM composites implies its use as directly compressible material with multifunctional properties.
3.5.11. Determination of tablets packing fraction
cellactose indicating denser particles in bulk. Tensile strength value facilitates the outcomes of packing fraction, signifying reduction of voids between particles at the highest
pressure [57]. Consequently, optimized MCLM composites should be considered for greater consolidation.
Table 5 – Diameter, Height, Elastic Recovery and packing fraction of LM, MC, Physical Mixture of LM & MC (70:30) and
Optimized MCLM Composites.
Tablet parameters Diameter
(mm) Height (mm) Recovery (%) Elastic Fraction Packing
LM 11.5 3.07 27.69 0.81
MC 11.5 2.46 21.54 1.02
Physical Mixture (LM+MC) 11.5 3.02 25.50 0.85
Cellactose 11.5 3.09 2.59 0.90
Optimized MCLM Composites 11.5 3.19 3.97 0.77
3.5.12. Heckel compressibility analysis.
The Heckel equation represents the relationship between compact density & applied pressure. The rate of density rise with the applied pressure is proportionate to the volume fraction of pores [42]. Mean yield pressure (Py=1/K) can be represented by the reciprocal value of the slope implies attribute of aggregates that resists the deformation. Heckel plot explains several phases of the compression process. The most crucial curvature point implies the particle rearrangement prior to a plastic deformation commences. A linear part in the plot symbolizes plastic deformation and a plateau is reached. The plateau is identified through the work of hardening and crystal density change. This section of Heckel plot also designates the elastic deformation of the powder mass [35]. The constants for Heckel equation are listed in Table 6. The Heckel plots of the powder mixtures evaluated are demonstrated in Figure 8 display rank order for Py values as MC>Physical Mixture> LM>Cellactose>Optimized MCLM Composites. This implies the fact that beginning of plastic deformation is a lot faster in the native excipients than the MCLM Composites and
cellactose. Usually, a smaller Py value demonstrates higher plastic deformation, low resistance to compaction pressure, better densification and easy compression. In low compaction pressure removal of voids associated with the loose particles results through rearrangement, fragmentation and plastic deformation, resulting in quick densification of optimized MCLM composites. However, the second phase (1 to 3 Ton pressure) contributes to plastic deformation of MCLM composite particles accountable for the densification of MCLM compact. Third phase (3 to 6 Ton pressure) subsequent to decompression, a gain in tablet height is depicted by elevated tablet porosity. The compactibility of optimized MCLM composites is attributed to a synergistic effect of consolidation by fragmentation of lactose and plastic deformation of cellulose, although the identical effect is not observed in physical mixture suggesting demand of processing over native excipient [53]. The physical mixture marginally improves the particle rearrangement at primary phase of the powder bed densification. LM mainly deforms by brittle deformation, and MC is deemed slightly elastic in nature.
Figure 8: Heckle Plots for(A) Lactose monohydrate (B) Microcrystalline Cellulose (C) Physical Mixture of LM and MC (70:30)
Table 6: Heckle, Kawatika and Kuno’s parameters for LM, MC, Physical Mixture of LM & MC (70:30) and Optimized MCLM Composites.
Material Kawatika Kuno Heckle
a b K Consolidation
index A K Py
LM 0.35 0.04 0.42 -1.49 0.38 1.11 2.63
MC 0.30 0.05 0.38 -1.72 0.33 0.87 3.07
Physical Mixture (LM+MC) 0.47 0.03 0.59 -1.75 0.37 0.77 2.70
Cellactose 0.25 0.04 0.36 -1.75 0.42 0.86 2.38
Optimized MCLM Composites 0.20 0.05 0.35 -1.65 0.47 1.13 2.13
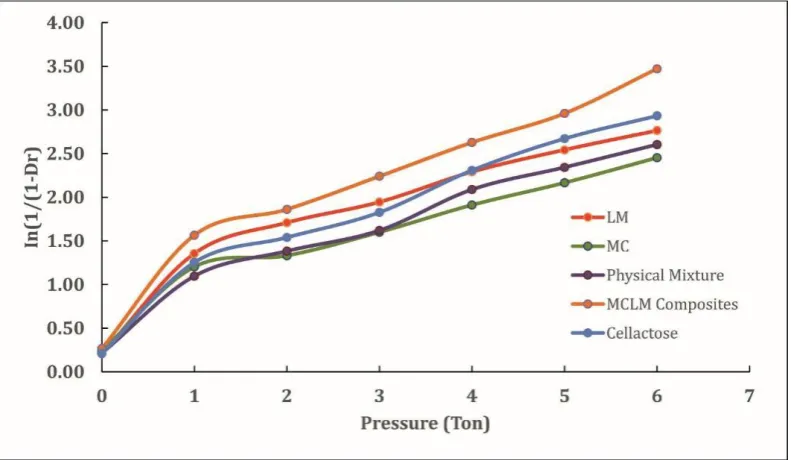
3.5.13. The Kawakita analysis
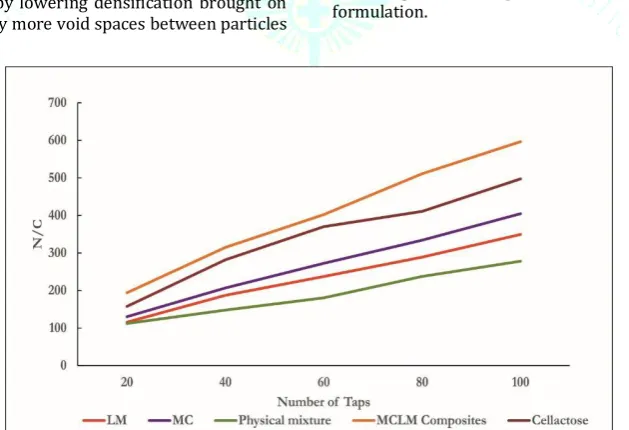
The Kawakita equation proposes that N/C is proportional to the number of taps. Figure 9 displays the plot of a N/C vs number of taps for MC, LM, Physical Mixture, Cellactose and optimized MCLM composites. One can notice that a linear relationship prevails between N/C and the number of taps in the whole pressure range investigated at a correlation coefficient (R2 = 0.934), signifies that densification behavior is in line with conjecture from the Kawakita equations. Table 6 displays the values of a, i.e. the maximum volume reduction after tapping. The rank order of ‘‘a’’ is Physical Mixture>LM>MC>Cellactose>MCLM optimized Composites. It could be noticed that with a smaller number of tapping MCLM tablet is way better packed than Cellactose before initial tapping into the cylinder. Low ‘‘a’’ value implies the fact that tapping reduces voids by air displacement through the powder bed, devoid alteration of particle size and shape. This might be caused by lowering densification brought on by forming considerably more void spaces between particles
by MIND diffusion [21]. Furthermore, the “a” parameter as well as the total powder porosity were found comparable. The “b” value analysis has been associated with cohesion and various other types of particle interaction forces. The higher “b” parameter attained implies a low degree of interparticle interactions that oppose volume reduction, and therefore, such material was the easiest to compress (volume reduction) by applied tapping. The “b” value of the optimized MCLM and cellactose (0.05) proved that the packing velocity of the MCLM composites was quick than that of LM and MC powder, this is supported by smaller “K” value of Kuno’s equation (Table 6). The slow packing velocity is proportionate to powder bed consolidation per tap. Consequently, from enhanced packability, optimized composites exhibited better compression in contrast to LM and MC powder [35]. The results of Kawakita and Kuno’s analysis suggests quicker consolidation of MCLM composites indicating best fit excipient for direct compression of tablet formulation.
Figure 9: Modified Kawakita Plots of (A) Lactose monohydrate (B) Microcrystalline Cellulose (C) Physical Mixture of LM and
MC (70:30) (D) Optimized MCLM Composites (E) Cellactose
3.6. Formulation and evaluation of tablets containing
model drug
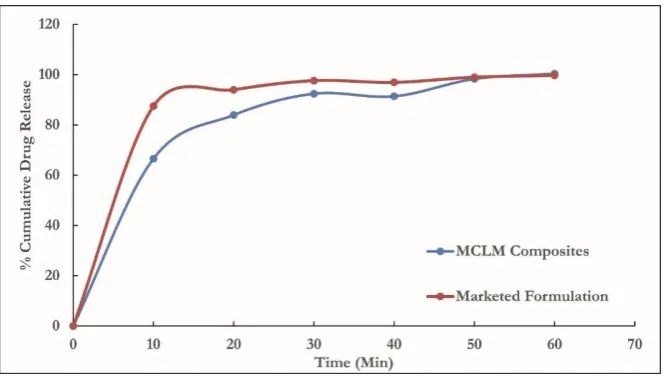
Table 7 shows that the composites of optimized MCLM composites presented satisfactory tableting characteristics with paracetamol. The model drug formulation demonstrated weight variations < 5%, friability < 1%, and a disintegration time < 17 min. An in-vitro drug release profile of paracetamol tablets prepared with optimized MCLM composites in contrast to the market formulation (Glaxo SmithKline Pharmaceuticals Ltd) found comparable. The in-vitro drug release profiles of marketed and test formulation are displayed in Figure 10. Tablets manufactured with optimized MCLM composites demonstrating similarity factor more than 80 with marketed formulation.
Table 7: Percentage composition of the tablets using model
drug.
Ingredients/parameters
Paracetamol (%) 50
Optimized MCLM composites (%) 48
Talc (%) 1
Magnesium stearate (%) 1
Average weight (mg) 404.6±4.64
Tablet hardness (N) 86±4.16
Friability (%) 0.47