FIRM VALUE
Dong Heon Byun Jinbae Kim Joon Yong Shin Korea University Business School
Korea
Abstract
This paper studies the effects of the performance-based compensation system and the Age-Wage structure which pays lower (higher) compensation than the industry average during employees’ early (later) service periods. Previous studies show that both compensation systems have positive effects on firm value. The paper extends the results and shows the effects of the compensation systems on major factors of firm value. Empirical results using employee-wage data of Korean firms show that the Age-Wage structure contributes to firm value through the enhancement of ROA, cost reduction and an improvement in labor productivity, and the performance-based compensation system does so through sales growth
Keywords: wage structure, compensation, performance, firm value
Introduction
When there is information asymmetry among agents, the informed party has an incentive to use the information in the interest of his own at the expense of the uniformed party. Such behaviors of the informed party in firms generate agency costs. Previous studies have examined agency costs and related issues. The issues examined by the previous studies include the relationship among ownership structure, the agency problem, and firm value [Stulz (1988), Morck, Shleifer and Vishny (1988), Chen, Carl, Thomas and Steiner (2000), and Fann, Joseph and Wong (2002)]; the effects of agency costs on financial decisions [Ross (1977), Grossman and Hart (1982), and Agrawal and Knoeber (1996)]; and the relationship among executive compensation, corporate governance, and agency costs [Douglas and Santerre (1990), Kaplan (1994), Byun, Kim and Shin (forthcoming) and Cho (1988)].
agency costs, and eventually to improve firm value. Among many types of incentive or monitoring systems, the compensation system has been proved as one of the most effective incentive systems. Previous studies have examined the effectiveness of compensation systems on controlling agency costs and improving firm value. Those studies testify the positive effects of compensation systems on firm value. But the previous studies fail to show how compensation systems improve firm value.
This study empirically examines whether two types of compensation systems can improve firm value, and analyzes how several aspects of firm value are affected by these compensation systems. Two types of compensation systems analyzed in this study are: (i) the “Age-Wage” structure, which pays lower compensation than the industry average during employees’ early service periods and higher compensation than the industry average during employees’ later service periods; and (ii) the performance-based compensation system.
An analysis of employee-wage data of Korean firms covering 20 years reveals that both the Age-Wage structure and the performance-based compensation system have positive relationships with firm value. The ways in which these two types of incentive systems improve firm value, however, are not uniform. While the Age-Wage structure contributes to firm value through the enhancement of return on assets (ROA), cost reduction, and an improvement in labor productivity, the performance-based compensation system does so through sales growth. These results imply that Korean firms use the performance-based compensation system mainly to increase the size of firms rather than to improve operational efficiency.
This study differs from previous studies in the following way. This study measures the effectiveness of compensation systems using continuous variables. With the improved measurement method, this study successfully captures the effects of compensation systems on the major factors of firm value, while other studies fail to measure such effects. By showing the paths of the firm value enhancement process induced by two compensation systems, this study can contribute to the microscopic design of optimal monitoring systems.
Theory and Hypotheses
The Age-Wage Structure and Bonding
in practice. An employment contract which replicates the effects of the bond is the Age-Wage structure contracts as Lazear (1979) and Milgrom and Roberts (1992) suggest.
A firm that uses the Age-Wage structure pays employees less than the value of what employees produce in their early employment periods. In their later employment periods, the firm pays more than the value of what they produce and what they can be paid elsewhere. The present value of employees’ lifetime earnings under this compensation structure would not be affected and therefore the value of this contract to employees would not be diminished. The costs to the firms would be similarly unaffected. The high wage promised in future years serves as a bond which can be forfeited in the case of evidence of moral hazard. The difference between the low wage and the marginal productivity in the early employment period can be regarded as an insurance premium to ensure honest working behavior. In addition, the Age-Wage structure will serve a screening function. If a firm pays wages that are relatively lower (higher) than the market average in the early (later) stages of employment1, workers who will remain at a
firm for a long time will prefer an employment contract similar to the Age-Wage structure.
The bonding effects and screening function of the Age-Wage structure will have a positive impact on the value of a firm. So the following hypothesis is proposed: H 1-1: The adoption of the Age-Wage structure is positively associated with
firm value.
Because the enhancement of firm value is a very complex process, the effect of the Age-Wage on firm value would not be uniform to all firms. A firm conducts various activities, so firm value can be increased through many different paths. While the issue of whether firm value is affected is important, it is also interesting to probe what aspects of firm value are affected. The previous studies failed to capture the effects of specific compensation structures on the aspects of firm value. This study examines four factors of firm value and proposes the following hypotheses:
H 1-2: The adoption of the Age-Wage structure is positively associated with return on investment.
H 1-3: The adoption of the Age-Wage structure is positively associated with sales increase.
H 1-4: The adoption of the Age-Wage structure is positively associated with labor productivity.
The Performance-Based Compensation System
It is well know that the performance-based compensation system is a very effective incentive system. It has been widely used by various firms and organizations. It attracts highly-productive employees and provides appropriate incentives for higher productivity. Performance-based compensation can be of various types, such as profit sharing, differential incentive systems for different departments, annual salary systems, and stock option schemes. A compensation system based on performance evaluation can attract competent applicants, reduce the number of high-productivity employees seeking early retirement, and induce workers to increase their efforts while containing problems of moral hazard. Such a scheme would increase firm value. Hence, the following hypothesis is proposed:
H 2-1: The adoption of the performance-based compensation is positively associated with firm value.
Even if the adoption of the performance-based compensation system increases firm value on average, its effects would not be uniform to all firms. It is well known that the performance-based compensation system is effective when the income effect of the employees’ efforts is high, when employees have relatively low risk-aversion, when performance measurement can be accurately made, and when the probability of employee productivity improvement is high. Therefore, such a system cannot be effectively applied to all firms with a certainty of reducing the risk of moral hazard. Firms for which this system is unsuitable would adopt systems such as the Age-Wage structure described above or other more traditional methods such as the direct control system.
To investigate the effect of the performance-based compensation system on various factors of firm value, this paper proposes the following hypotheses:
H 2-2: The adoption of the performance-based compensation is positively associated with return on investment.
H 2-3: The adoption of the performance-based compensation is positively associated with sales increase.
H 2-4: The adoption of the performance-based compensation is positively associated with labor productivity.
Sample
The Ministry of Labor of Korea surveys labor conditions including wages and labor hours for 5,400 establishments in Korea every year. The sample firms for this study were initially drawn from the 1999 and 2000 surveys. From the initial sample, the following firms were excluded:
•
Firms not listed on the Korea Stock Exchange in 1999 and 2000•
Merger firms, financial firms, or firms designated as having stocks of administrative issue2•
Firms with negative net book values•
Firms for which ownership and accounting data were not availableThe second and third criteria were included to ensure homogeneity of the sample firms and to exclude those that experienced unusual circumstances in their operations during the sampling period. Based on these criteria, a final sample of 215 firms was selected. The industry distribution is shown in Table 1.
Table 1: Industrial Distribution of Sample Firms
Industry Number of Firms
Food, beverages 20
Textiles, apparel 14
Pulp, paper 7
Petroleum, chemicals, rubber 43
Pharmaceuticals 15
Non-metallic minerals 9
Basic metals 11
Machinery & equipment 21
Electronic communication equipment,
electrical machinery, precision machinery 39
Construction 11
Wholesale, retail 8
Service (electricity & gas, transportation,
telecommunication) 12
Fishery, mining 5
Total (13 industries) 215
The wage data3 were obtained from the Survey Reports on Wage Structure of
“Data Analysis Retrieval and Transfer System (DART)” of the Financial Supervisory Service and the “TS2000 Database” of the Korea Listed Companies Association.
Research Design
To test Hypothesis 1-1 and Hypothesis 2-1, it is necessary to measure firm value.4 Tobin’s Q was chosen as a proxy for overall firm value and is measured in the following way:
Tobin’s Q5 = (Market Value of Equity + Book Value of Debt)
÷
(Book Value of Total Assets)Other factors affecting firm value also need to be measured. Return on investment is measured by return on assets; that is, net income divided by average total assets. Sales increase is measured as the growth rate of sales revenue. The size of expense is measured as the natural log of the cost of goods sold plus selling and administrative expenses. Finally, labor productivity is measured as value added per employee divided by average total assets.
To measure the degree to which the Age-Wage structure is used, wage is regressed on the length of the service period for which an employee has served in the firm. If the total compensation over the whole employment period is the same, the firms adopting the Age-Wage structure would have steeper slope coefficients in the wage regressions than the industry average. The value of the Age-Wage structure variable is determined by the difference between a slope coefficient in an individual firm’s wage regression and a slope coefficient in the industry average wage regression. Specifically,
AWVAR for firm i = Di - Dj
where Di is the coefficient in the wage regression of ln(wageiT) = Ci + Di T + eT
Dj is the coefficient in the wage regression of ln(wagejT)= Cj + Dj T +
G
Tj is the industry which firm i belongs to and T is the length of service.
higher compensation than the industry average during the early periods and even higher compensation than the industry average during the later periods. Such a firm would not claim that it uses the Age-Wage structure.
To ensure the compensation levels of the sample firms are within a comparable range, firms that provide an average pay of 30 percent more or 30 percent less than the industry average (called “extreme firms”) were excluded from the sample. By this procedure, 60 firms from the 1999 data and 53 firms from the 2000 data were excluded.
Another independent variable, PPVAR, is related to the adoption of the performance-based compensation system. PPVAR is measured by
PPVAR = Performance-Related Compensation
÷
Total CompensationMost firms adopt some form of the performance-based pay system. However, many of these forms are only nominal and the payments received are regarded by employees as a portion of their regular salary rather than as a compensation for good (or bad) performance. To capture the intended incentive effects, “the performance-based compensation system” in this paper is a generic term that includes only: (i) compensation systems that involve profit-sharing schemes whose rules and details are predetermined; and (ii) compensation systems that differentiate between each individual or each team unit.
Since firm value is possibly influenced by factors other than wage structure and a compensation system based on performance, we control these factors in the study. We control firm size and industry since they create different environments for agency costs and therefore affect firm value. Jensen and Meckling (1976) and Grossman and Hart (1982) claim that liability provides the source of agency costs. It is also claimed that high liability tends to induce income-increasing behavior of management and suppress investment. Therefore, capital structure is another factor that may affect firm value.
Prior studies such as Jensen et al. (1976) and Morck et al. (1988) investigated the relationship between agency costs and ownership structure, and documented that the ownership ratios of specific groups have significant impacts on firm value. To control these effects, this paper includes in the regression ownership by the largest shareholder and related parties, institutional ownership, and foreign ownership.
In summary, the following cross-sectional model is used to test the hypotheses:
where
DEPVAR: dependent variables
Tobin’s Q: (market value of equity + book value of debt)
÷
(book value of total assets)ROA: net income divided by average total assets GROWTH: growth rate of sales revenue
LNEXPENSE: ln (cost of goods sold + selling & administrative expenses) PRODT: value added per employee divided by average total assets AWVAR: Age-Wage variable (see above description for details) PPVAR: performance-related compensation
÷
total compensation LEVER: total liability divided by total assetsLNSALES: natural log of sales revenue
INSTI: proportion of shares owned by institutional investors FOREN: proportion of shares owned by foreign investors
OWN: proportion of shares owned by largest shareholders and related parties
IDUM: industry dummies
Results
Descriptive Statistics
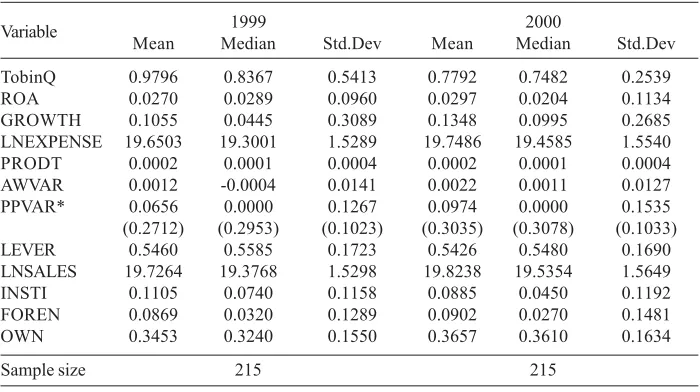
Table 2 presents the descriptive statistics for the full sample that includes “extreme firms” whose average compensation is considerably different from the industry average. Tobin’s Q is 0.9796 in 1999 and 0.7792 in 2000, implying that the firms in the sample are undervalued on average, particularly in 2000. The proportion of firms that adopt performance-based compensation was 24.2 percent in 1999 and 32.1 percent in 2000.
Table 3 presents the descriptive statistics for the “adjusted” sample firms that exclude “extreme firms.” The number of firms in the sample is reduced to 155 for 1999 and 162 for 2000. The average size of the firms, measured by sales revenue, for the adjusted sample is bigger than the full 1999 sample and the smaller 2000 sample. This indicates that no systematic shift in firm size occurs when “extreme firms” are excluded. All the other statistics are also similar to those shown in Table 2. Hereafter, the results performed with the adjusted sample that excludes “extreme firms” are reported.6
Table 2: Descriptive Statistics of Variables for Full Sample That Includes “Extreme Firms”
Variable 1999 2000
Mean Median Std.Dev Mean Median Std.Dev
TobinQ 0.9796 0.8367 0.5413 0.7792 0.7482 0.2539
ROA 0.0270 0.0289 0.0960 0.0297 0.0204 0.1134
GROWTH 0.1055 0.0445 0.3089 0.1348 0.0995 0.2685
LNEXPENSE 19.6503 19.3001 1.5289 19.7486 19.4585 1.5540
PRODT 0.0002 0.0001 0.0004 0.0002 0.0001 0.0004
AWVAR 0.0012 -0.0004 0.0141 0.0022 0.0011 0.0127
PPVAR* 0.0656 0.0000 0.1267 0.0974 0.0000 0.1535
(0.2712) (0.2953) (0.1023) (0.3035) (0.3078) (0.1033)
LEVER 0.5460 0.5585 0.1723 0.5426 0.5480 0.1690
LNSALES 19.7264 19.3768 1.5298 19.8238 19.5354 1.5649
INSTI 0.1105 0.0740 0.1158 0.0885 0.0450 0.1192
FOREN 0.0869 0.0320 0.1289 0.0902 0.0270 0.1481
OWN 0.3453 0.3240 0.1550 0.3657 0.3610 0.1634
Sample size 215 215
* The numbers in parentheses are statistics for the firms with positive PPVAR values.
Definitions of Variables
Tobin’s Q: (market value of equity plus book value of debt) divided by book value of total
assets
ROA: net income divided by average total assets
GROWTH: growth rate of sales revenue
LNEXPENSE: ln (cost of goods sold + selling & administrative expenses)
PRODT: value added per employee divided by average total assets
AWVAR Di - Dj where Di is the slope coefficient in the regression of an individual firm’s wage
on length of service, Dj is the slope coefficient in the regression of industry wage on
service length, j is the industry which firm i belongs to, and T is the length of
service
PPVAR: performance-related compensation divided by total compensation
LEVER: total liability divided by total assets
LNSALES: natural log of sales revenue
INSTI: proportion of shares owned by institutional investors’ holdings
FOREN: proportion of shares owned by foreign investors
OWN: proportion of shares owned by largest shareholders and related parties
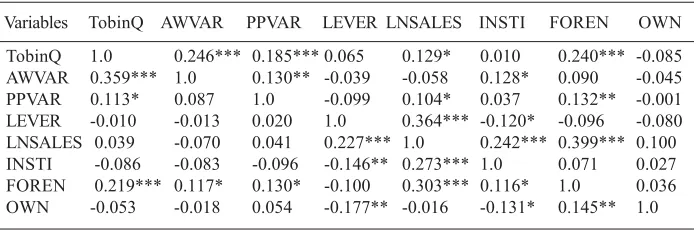
Leverage is significantly negatively correlated with institutional ownership and largest shareholder ownership.
Regression Results for Tobin’s Q
Table 3: Descriptive Statistics of Variables for Adjusted Sample That Excludes “Extreme Firms”
Variable 1999 2000
Mean Median Std.Dev Mean Median Std.Dev
TobinQ 0.9582 0.8087 0.5900 0.7797 0.7417 0.2773
ROA 0.0296 0.0280 0.0692 0.0337 0.0222 0.1210
GROWTH 0.0859 0.0325 0.2888 0.1365 0.1020 0.2737
LNEXPENSE 19.7268 19.4135 1.5031 19.7088 19.4683 1.4549
PRODT 0.0001 0.0001 0.0005 0.0002 0.0001 0.0004
AWVAR 0.0023 0.0006 0.0131 0.0021 0.0017 0.0123
PPVAR* 0.0671 0.0000 0.1291 0.0964 0.0000 0.1497
(0.2814) (0.2988) (0.0968) (0.3004) (0.3071) (0.0913)
LEVER 0.5491 0.5505 0.1738 0.5305 0.5315 0.1674
LNSALES 19.8042 19.5056 1.5048 19.7886 19.5532 1.4608
INSTI 0.1021 0.0730 0.1021 0.0861 0.0445 0.1119
FOREN 0.0862 0.0320 0.1289 0.0905 0.0270 0.1433
OWN 0.3452 0.3240 0.1511 0.3743 0.3765 0.1614
Sample size 155 162
* The numbers in parentheses are statistics for the firms with positive PPVAR values.
See Table 2 for definitions of variables.
Table 4: Pearson Correlation Matrix of Variables
Variables TobinQ AWVAR PPVAR LEVER LNSALES INSTI FOREN OWN
TobinQ 1.0 0.246*** 0.185*** 0.065 0.129* 0.010 0.240*** -0.085
AWVAR 0.359*** 1.0 0.130** -0.039 -0.058 0.128* 0.090 -0.045
PPVAR 0.113* 0.087 1.0 -0.099 0.104* 0.037 0.132** -0.001
LEVER -0.010 -0.013 0.020 1.0 0.364*** -0.120* -0.096 -0.080
LNSALES 0.039 -0.070 0.041 0.227*** 1.0 0.242*** 0.399*** 0.100
INSTI -0.086 -0.083 -0.096 -0.146** 0.273*** 1.0 0.071 0.027
FOREN 0.219*** 0.117* 0.130* -0.100 0.303*** 0.116* 1.0 0.036
OWN -0.053 -0.018 0.054 -0.177** -0.016 -0.131* 0.145** 1.0
The upper-right triangle represents the correlation coefficient for 2000 and the lower-left triangle represents the correlation coefficient for 1999.
***, **, and * indicate statistical significance at the 1 percent, 5 percent, and 10 percent levels respectively.
See Table 2 for definitions of variables.
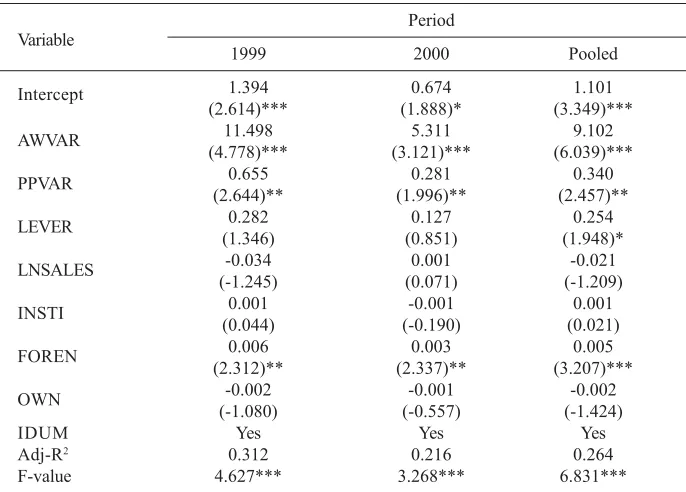
Table 5: The Effect of the Age-Wage Structure and the Performance-Based Compensation System on Firm Value
TobinQ = D0 + D1AWVAR + D2PPVAR + D3LEVER + D4LNSALES
+ D5INSTI+ D6FOREN+ D7OWN+ ¹D8 IDUM+
G
Variable Period
1999 2000 Pooled
Intercept 1.394 0.674 1.101
(2.614)*** (1.888)* (3.349)***
AWVAR 11.498 5.311 9.102
(4.778)*** (3.121)*** (6.039)***
PPVAR 0.655 0.281 0.340
(2.644)** (1.996)** (2.457)**
LEVER 0.282 0.127 0.254
(1.346) (0.851) (1.948)*
LNSALES -0.034 0.001 -0.021
(-1.245) (0.071) (-1.209)
INSTI (0.044)0.001 (-0.190)-0.001 (0.021)0.001
FOREN 0.006 0.003 0.005
(2.312)** (2.337)** (3.207)***
OWN -0.002 -0.001 -0.002
(-1.080) (-0.557) (-1.424)
IDUM Yes Yes Yes
Adj-R2 0.312 0.216 0.264
F-value 4.627*** 3.268*** 6.831***
***, **, and * indicate statistical significance at the 1 percent, 5 percent, and 10 percent levels respectively.
See Table 2 for definitions of variables. The t-values are in parentheses.
The regression results show that the Age-Wage structure has a significant and consistent effect on firm value. AWVAR has a significantly positive relationship with Tobin’s Q at the 1 percent level in 1999 (a coefficient of 11.498 and a t-value of 4.778), in 2000 (a coefficient of 5.311 and a t-value of 3.121), and in the pooled period (a coefficient of 9.102 and a t-value of 6.039). This result therefore provides statistical support for Hypothesis 1-1. As higher compensation than the industry average in the later stages of employees’ careers plays the role of a bond that reduces opportunistic behavior, the adoption of the Age-Wage structure reduces agency costs and increases firm value.
pooled period. All three are statistically significant at the 5 percent level. These results are consistent with Hypothesis 2-1 that the adoption of the performance-based compensation system has a positive effect on firm value.
Foreign ownership (FOREN) was found to have a positive relationship with firm value that is significant at the 1 percent level in the pooled period and the 5 percent level both in 1999 and 2000. The coefficients of OWN – largest shareholder ownership – are negative in all three periods even though they are not statistically significant. Recently, there has been much interest in corporate governance in Korea. Foreign ownership is generally believed to be associated with good corporate governance because it can provide better monitoring. Ownership by the largest shareholder and related parties is regarded as a bad signal for corporate governance for the same logic. The regression results in Table 5 are consistent with this notion.
F-values are 4.627, 3.268, and 6.831 in 1999, 2000, and the pooled period respectively. They are all statistically significant at the 1 percent level. Adjusted R squares are 0.312, 0.216, and 0.264 in 1999, 2000, and the pooled period respectively. There is no evidence of either autocorrelation or multicollinearity. The Durbin-Watson statistic is 2.283 and 2.061 in 1999 and 2000 respectively, and the variation inflation factor is at the 1-2 level.
Overall, the results shown in Table 5 support the proposition that the Age-Wage structure and the performance-based compensation system are used to control employee moral hazard and to improve the value of Korean firms.
Regression Results for Return on Assets, Sales Growth, Labor Productivity, and Expenses
Table 6: The Effect of the Age-Wage Structure and the Performance-Based Compensation System on Return on Assets, Sales Growth, Labor
Productivity, and Expenses
Dep Var = D0 + D1AWVAR + D2PPVAR + D3LEVER + D4LNSALES
+ D5INSTI+ D6FOREN+ D7OWN+ ¹D8 IDUM+
G
Independent Dependent Variables
Variable TobinQ ROA GROWTH PRODT LNEXPENSE
Intercept 1.101 0.042 -0.001 0.002 0.305
(3.349)*** (1.247) (-0.007) (13.216)*** (3.206)***
AWVAR 9.102 0.273 0.400 0.002 -1.163
(6.039)*** (1.766)* (0.534) (2.414)** (-3.110)***
PPVAR (2.457)**0.340 (0.480)0.001 (2.216)**0.147 (0.085)0.001 (-0.155)-0.005
LEVER (1.948)*0.254 (-6.915)***-0.105 (0.176)0.011 (-4.782)***-0.001 (3.897)***0.121
LNSALES (-1.209)-0.021 (0.586)0.001 (0.393)0.003 (-10.618)***-0.001 (193.3)***0.985
INSTI (0.021)0.001 (1.296)0.001 (-0.803)-0.001 (-1.148)-0.001 (-0.736)-0.001
FOREN (3.207)***0.005 (2.039)**0.001 (2.754)***0.002 (0.793)0.001 (-2.775)***-0.001
OWN (-1.424)-0.002 (0.340)0.001 (0.852)0.001 (1.063)0.001 (0.170)0.001
IDUM Yes Yes Yes Yes Yes
Adj-R2 0.264 0.257 0.142 0.520 0.996
F-value 6.831*** 6.218*** 3.487*** 17.276*** 3692.6***
***, **, and * indicate statistical significance at the 1 percent, 5 percent, and 10 percent levels respectively.
See Table 2 for definitions of variables. The t-values are in parentheses.
The coefficient of the Age-Wage structure in the regression of ROA is 0.273 with a t-value of 1.766, which is statistically significant at the 10 percent level. The Age-Wage structure has a positive impact on labor productivity (PRODT) with a t-value of 2.414, which is significant at the 5 percent level. The impact on expenses (LNEXPENSE) is significantly negative at the 1 percent level with a t-value of -3.110. These results support Hypotheses 1-2, 1-4, and 1-5. The Age-Wage structure, however, does not have a significant impact on sales growth.
These results shown in Table 6 imply that, while both the Age-Wage structure and the performance-based compensation system have positive effects on firm value, they do so through different paths. The empirical results suggest that the Age-Wage structure accomplishes the expected bonding effects; that is, it reduces inadequate perks, lowers costs, improves productivity, and eventually enhances firm value. On the other hand, the empirical results indicate that the incentive provided by the performance-based compensation system enhance firm value through sales maximization. These results are consistent with our survey results that most firms that adopt a performance-based compensation system actually base performance compensation on sales or net income.
Additional Analyses
Analysis Using The Full Sample That Includes “Extreme Firms”
The previous analysis excluded those firms that paid out wages that were 30 percent more or 30 percent less than the industry average. This procedure was necessary because the Age-Wage structure is measured by comparing the regression coefficient in each firm’s wage regression with the regression coefficient in the industry average wage regression. If the wages of the sample firms are not in a comparable range, a very steep regression coefficient will not necessarily mean that the firm adopts an Age-Wage structure. Such a steep regression coefficient may result because such firms pay high (or low) wages in the early periods and even higher (or lower) wages than the industry average.
While it seems necessary to ensure that the sample firms’ total compensation levels are comparable, the procedure and the cut-off of 30 percent are arbitrary and may introduce selection bias. To see if the previously reported results are sensitive to the exclusion of “extreme firms,” the same tests were performed with the full sample that includes “extreme firms.”
The results from the analysis with the full sample are not qualitatively different from the results with the sample that excluded “extreme firms.”7 The coefficient
and the performance-based compensation system are measured by dummy variables, the coefficient of the performance-based compensation system is statistically significant, but the coefficient of the Age-Wage structure is not.
The results with the full sample are comparable to those with the sample that excluded “extreme firms” and are not necessarily weaker, suggesting that the empirical results of this paper are not driven by the sample selection.
Conclusions
This study examines a relationship between Tobin’s Q which is a proxy for firm value and two compensation systems. The systems analyzed in the study are the Age-Wage structure and the performance-based compensation system. Analyses using data of Korean firms show that both the Age-Wage structure and the performance-based compensation system are positively associated with firm value. This means that Korean firms use these incentive mechanisms to control moral hazard and improve firm value.
The positive relationship between compensation systems and firm value was successfully examined by previous studies. Even though the compensation systems positively affect firm value, however, the way they affect firm value may depend upon firm characteristics. Previous studies could not provide clear explanation how or through which paths the compensation systems improve firm value. Using an improved method to measure the degree of using two compensation systems, this study shows that the Age-Wage structure is positively associated with return on assets, labor productivity, and expenses, while the performance-based compensation system is positively associated with sales growth.
Most of previous studies in the area mainly focused on the relationship between firm value and incentive structures and used compensation data top management. This paper has extended the findings of these earlier studies by an improved measurement method and using wage data for all levels of firms.
Notes
1 Paying wages the same level as the worker’s marginal productivity is, on the average, the same
as paying the market average if the workers attracted to each firm have similar productivity.
2 The key criteria for the designation of stocks as administrative issue by the Listing Regulation
3 This wage data are not in the public domain. Authors obtained special permission to use the
wage data for this study.
4 An alternative approach would be to investigate the effects of wage structures on agency
costs. While several studies have tried to directly measure agency costs, this approach was not chosen because agency costs could not be measured with sufficient accuracy.
5 Tobin’s Q is defined as the ratio of the market value of the firm divided by the replacement cost
of its total assets. In empirical studies, ratios such as the price earnings ratio or the market-to-book ratio are usually used as a proxy of Tobin’s Q, since the replacement cost of assets is difficult to measure accurately [Rindenberg and Ross (1981), and Smith and Watts (1992)]. In this study, the book value for debt, assets, and the share price at the end of the year were used for the calculation of Tobin’s Q.
6 When all the analyses were repeated with the full sample that included “extreme firms,” the
results were not qualitatively different from the results reported in this paper. The results are discussed in a later section of this paper.
7 Detailed results are not reported. They are available from the authors upon request.
References
Agrawal, A. and Knoeber, C. R. (1996). Firm Performance and Mechanisms to Control Agency Problems between Managers and Shareholders. Journal of Financial and Quantitative Analysis, 31, 377-398.
Byun, D. H., Kim J. and Shin, J. Y. (forthcoming). The Effects of Deferred Compensation and Performance-Based Compensation on Firm Value. Asia-Pacific Journal of Accounting and Economics.
Chen, C. R. and Steiner, T. L. (2000). Tobin’s Q, Managerial Ownership and Analyst Coverage. Journal of Economics and Business, 355-382.
Cho, M. (1998). Ownership Structure, Investment and Corporate Value: An Empirical Analysis. Journal of Financial Economics 47, 103-122.
Dore, R. (1997). Global Changes and National Developments in Industrial Relations, Labor Relations, Labour Markets and Labour Movements. Seminar Paper, Korea Labor Institute.
Douglas, E. J. and Santerre, R. E. (1990). Incentive Contracts and Stockholders Monitoring: Substitute Sources of Executive Compliance. Quarterly Review of Economics and Business, 30, 24-31.
Fann, Joseph. P. H. and Wong, T. J. (2002). Corporate Ownership Structure and the Informativeness of Accounting Earnings in East Asia. Journal of Accounting and Economics, 33, 401-425.
Hashimoto, M. and Raisian, J. (1985). Employment, Tenure and Earnings Profiles in Japan and the United States, American Economic Review, 75(4).
Hutchens, R. (1989). Seniority, Wages and Productivity: A Turbulent Decade. Journal of Economic Perspectives, 3(4).
Jensen, M. C. and Meckling, W. H. (1976). Theory of the Firm: Managerial Behavior, Agency Costs and Ownership Structure. Journal of Financial Economics 3, 305-360. Kaplan, S. N. (1994). Top Executive Rewards and Firm Performance: A Comparison of Japan and the United States. Journal of Political Economy (June), 510-546.
Lazear, E. P. (1979). Why is There Mandatory Retirement? Journal of Political Economy
87(Dec), 1261-1284.
Lazear, E. P. (1981). Agency, Earnings Profiles, Productivity and Hours Profiles, American Economic Review, 71(4).
Lazear, E. P. (1995). Personnel Economics (The MIT Press).
Lazear, E. P. (1998). Personnel Economics for Managers (John Wiley & Sons).
Milgrom, P. and Roberts, J. (1992). Economics, Organization and Management (Prentice Hall, Englewood Cliffs, NJ).
Morck, R., Shleifer, A. and Vishny, R. W. (1988). Management Ownership and Market Valuation: An Empirical Analysis. Journal of Financial Economics 20, 293-315. Ross, A. S. (1977). The Determination of Financial Structure: The Incentive Signaling Approach. Bell Journal of Economics 8: 23-40.
Shin, J. Y. and Jung, M. (1998). Management Accounting (Hackhyun, Seoul)
Stiglitz, J. E. (1975). The Theory of Screening, Education and the Distribution of Income.
American Economic Review, 283-300.