Asia-Pacific Management Accounting Journal, Volume 4 lssue 2, l-27. 2009
THE APPLICATION OF MODERN
MANAGEMENT ACCOUNTING
TECHNIQUES: A FIELD STUDY
Norlaila Abdullah
Accounting Research Institute & Faculty of Accountancy Universiti Teknologi MARA, Pahang, Malaysia
Abstract
This study examines the management accounting (MA) practices adopted by companies in the local industries such as oil and gas, petrochemical, chemical, manufacturing and automobile. A sample comprising 40 local and multinational firms, was measured to determine the rate of adoption of the various MA practices. These practices were further classified as strategic, modem, and conventional for comparative purposes with other countries' emerging development. Some other variables such as production process (technology), production set up, product mix, and firm size (employee) affecting the use and rate of application of MA practices were considered. Findings revealed that firms' usage of the various classes of management accounting practices depended upon the sample origin, size, product lines and technology. Some surprising revelations on the MA applications were highlighted based on the field study conducted.
Keywords: Industries, adoption, strategic, modern, conventional management accounting practices
Introduction
The field of management accounting combines two disciplines: management and accounting. Both are highly sensitive to changes occurring in business. Prior to the lndustrial Revolution of the 201h Century, owner-managers had limited use of management accounting information. They did not need elaborate reports, as there were fewer external parties involved or few complicated events taking place. Their dependence, on internally generated financial accounting information, for many decades, caused management accounting to stagnate as its functions were mainly overshadowed by the financial accounting system.
ISSN 1675-3 194
Asia-Pacific Managemenl Accou/1/ing Journal, Volume 4 Issue 2. 1-27, 2009
Subsequently, the practice of management accounting flourished in the United States of America with the growth of large industries. Both industrial and commercial activities flourished and spread to the rest of the world. As product lines expanded and operations became complex, forward-looking companies such as Du Font, General Motors and General Electric recognized the need for management-oriented accounting reports that were distinct and separate from financial reports (Johnson 1987); thus, management accounting practices became relatively sophisticated and provided essential infonnation needed to manage large scale production of textiles, steel and other products (Chandler, 1977).
These days the growth of international holding businesses coupled with technological advancement has changed the world of management accounting. A number of modem and strategic management accounting techniques have emerged and proven to be successful tools as indicated by numerous volumes of academic management accounting textbooks. These worry many academicians professing management accounting techniques in classrooms especially in some developing countries. The predicament lies in the differences between academic literature on MA practices with existing local adoptions. This issue is vital as students need to understand the MA practices used and adopt�d by most firms locally before investigating those adapted elsewhere. Thus, the objective of this study is to examine, investigate and hight ight the rate of adoption of the strategic, modern and traditional management accounting practices by local firms. This study also addresses the need for management accow1ting posts in the sample as catalysts of new MA practices. It is hoped that the outcome of this investigation will be useful to academicians, practitioners and students in search of new practices, vital for appreciating other countries' practices.
Literature Review
The Application of Modern Management Accounting Techniques: A Field Study
improvement (kaizen) are examples of leading practices. Similarly, for the past decade, Malaysia has been encouraging foreign direct investors. With the influx of multinational companies, it is now time to measure the transfer technology and identify best MA practices.
Studies have shown that Malaysian-owned companies use traditional methods such as standard costing and budgetary control. Likewise, multinational companies operating in Malaysia also use traditional MA practices not only as a tool to communicate with their managers but also to make decisions (Omar and Muda, 2002 and Abdul Rahman, Omar and Sabaruddin, 2002). Similarly, in Singapore and Hong Kong, traditional MA practices such as business budgeting, long term planning, capital budgeting and cash budgeting are widely practiced (Akira Nishimura, 2002). Interestingly, similar trends are detected in some ASEAN countries. These are attributed to the respective countries' economic and business developmental structure where abundance of medium and small-sized businesses is making management accountants' services unaffordable.
Traditional practices are customary MA practices that have existed since 1925. These practices follow older methods and ideas and are highly shielded from the use of sophisticated technologies. Examples of traditional MA practices are standard costing, budgeting and budgetary control, job order costing, variance analysis, transfer pricing to mention a few. Basically, these practices are not only highly dependent on the available support infrastructure and resources, but on its identity or name.
Methodology
The Conceptual Framework
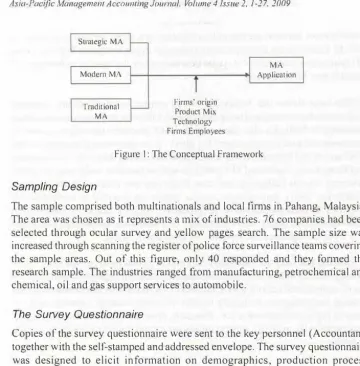
The study highlights the current practices of local MA practices progression. It is based developed by Graham and Harvey's (2001) theory of corporate finance where very specific and qualitative questions were applied to moderately large samples of corporate finance practices. This paper adopts the same conceptual framework as shown in Figure I.
The Pilot Study
Asia-Pacific Management Accounting Journal. Volume 4 Issue 2, 1-27.2009
Strategic MA
Modem MA
Traditional MA
Firms' origin Product Mi,, Technology Firms Employees
MA Application
Figure I: The Conceptual Framework
Sampling Design
The sample comprised both multinationals and local firms in Pahang, Malaysia. The area was chosen as it represents a mix of industries. 76 companies had been selected through ocular survey and yellow pages search. The sample size was increased through scanning the register of police force surveillance teams covering the sample areas. Out of this figure, only 40 responded and they formed the research sample. The industries ranged from manufacturing, petrochemical and chemical, oil and gas support services to automobile.
The Survey Questionnaire
Copies of the survey questionnaire were sent to the key personnel (Accountant) together with the self-stamped and addressed envelope. The survey questionnaire was designed to elicit information on demographics, production process (technology), production lay out, and the kind of MA practices used. These practices were then classified into strategic, modem and conventional and the sample rate of adoption was measured. The last section focused on measuring the existence of the management accountant's position, educational background, and professional membership. The inter-items reliability analysis scale (alpha) showed coefficient for thirty-one variables was 0.8361. Secondary sources were also utilized to further augment the results of the study.
The Field Study and Personal Interview
The Application of Modern Management Accounting Techniques: A Field Study
shutdowns, only in the following year. Moreover, a relatively short time was allocated for field observation.
Personal interviews with accounting and non-accounting personnel were conducted to explore further relevant issues, which were previously cited in the survey questionnaire. Simultaneously pictorial documentation of the various infrastructure and state-of-the-art technologies available locally was also examined to further substantiate the findings. ln cases, where researcher was barred from viewing the process, illustrative discussions were taken as an alternative.
Findings and Discussions
Company Attributes
Table 1 presents the summary of infonnation on 40 firms from differing industries: manufacturing (52.5%), automobile (7.5%), oil & gas (5%), and petrochemical (35%). Domestic companies made up 62.5% and 37.5% were multinationals. The multinationals operated in industries ranging from chemicals, rubber latex threads, wood based chips, medium to high-density fiber product while the domestic companies in automobile, oil and gas, petrochemical and timber milling. The majority had decades of business experience as indicated those with less than five years (7.5%), five to ten years (37.5%), eleven to fifteen years (32.5%), sixteen to twenty-four years (20%), and one (2.5%) company with thirty-five years experience. However, on questions relating to capital investment, almost all of the respondents preferred not to state the amount, suggesting that they held conservative views on this aspect but a few indicated owning production assets investments ranging from RM I million to RM 2.9 billion. On the issue of product mix, 80% of the respondents produced two or more products sold locally and the world over while the 20% were producing a product for the local market. The firm's workforce ranged from 100 to 7,000 persons, with 82.5% employing fewer than 500 and 1 7 .5% had 501 to 7,000 employees.
Table 1: Summary of Demographical Attributes of Respondents Kinds of Business:
Industry Covered:
Size of Investment: Years in Business:
Number of Employees:
Berhad (7 .5%) Sendirian Berhad (92.5%)
Manufacturing (2 l or 52.5%) Automobile (3 or 7.5%) Oil & Gas SS (2 or 5%) Petrochemical/Chemical (14 or 35%)
RM I million to RM2.9 billion
Less than 5 (3 or 7.5%), 5 to 10 (15 or 37.5%), 11 to 15 (13 or 32.5%), I 6 to 24 (8 or 20%), 35 ( I or 2.5%)
Asia-Pacific Management Accounting Journal, Volume 4 issue 2, 1-27. 2009
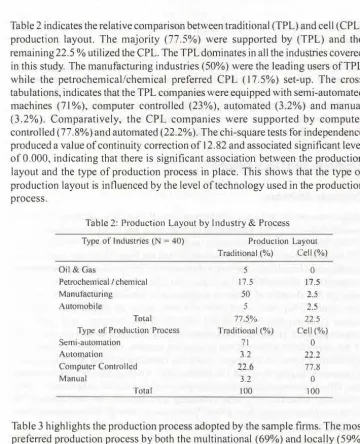
Table 2 indicates the relative comparison between traditional (TPL) and cell (CPL) production layout. The majority (77.5%) were supported by (TPL) and the remaining 22.5 % utilized the CPL. The TPL dominates in all the industries covered in this study. The manufacturing industries (50%) were the leading users of TPL while the petrochemical/chemical preferred CPL ( 17.5%) set-up. The cross tabulations, indicates that the TPL companies were equipped with semi-automated machines (7 l %), computer controlled (23%), automated (3.2%) and manual (3.2%). Comparatively, the CPL companies were supported by computer controlled (77 .8%) and automated (22.2%). The chi-square tests for independence produced a value of continuity correction of 12.82 and associated significant level of 0.000, indicating that there is signi ti cant association between the production layout and the type of production process in place. This shows that the type of production layout is influenced by the level of technology used in the production process.
Table 2: Production Layout by Industry & Process Type of Industries ( = 40)
Oil & Gas
Petrochemical/ chemical Manufacturing
Automobile
Total Type of Production Process Semi-automation
Automation
Computer Controlled Manual
Total
Production Layout Traditional(%) Cell(%)
5 0
17.5 17.5
50 2.5
5 2.5
77.5% 22.5
Traditional (%) Cell(%)
71 0
3.2 22.2
22.6 77.8
3.2 0
100 100
Table 3 highlights the production process adopted by the sample firms. The most preferred production process by both the multinational (69%) and locally (59%) is semi-automated production process. Dual use of machine and labour is predominant. The use of fully automated production process by both the multinational and the local companies was low at 8%, prevalent in the Petrochemical industry. The use of manual production process is still available locally.
Strategic Management Accounting (SMA)
The Application of Modern Management Accounting Techniques: A Field Study
Table 3: Tabulation Analysis of Production Process by Country of Origin Production Process Local Companies (N = 25) Multinationals (N = 15) Total
N Percent N Percent (Percent)
Automated 2 8% I 8% 7.5%
Semi-automated 13 52% 9 69% 55%
CNC 9 36% 5 33% 35%
Manual 4% 0 0 2.5%
Percent 63% 37%
Table 4: Cross Tabulation of Production Layout and Use of MACT
SMA Practices
Target Costing
Continuous Improvement (kaizen)
Benchmarking Re-engineering
Balanced Scorecard Product Life Cycle Costing Value Chain Analysis
Target Costing
Type of Production Layout (N = 40) Traditional (%) Cell(%)
15 2.5
25 22.5
50 15
10 2.5
5 12.5
5 2.5
Total (%)
17.5 47.5
65 12.5 17.5 7.5
80
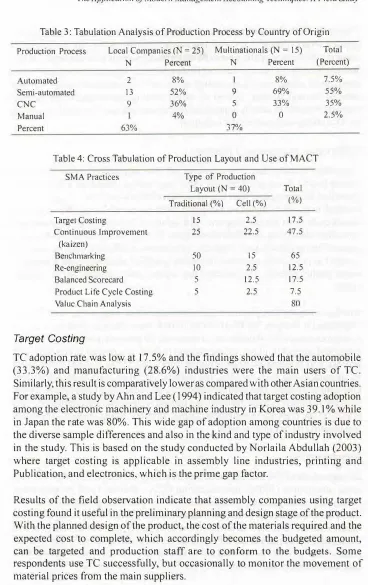
TC adoption rate was low at 17.5% and the findings showed that the automobile (33.3%) and manufacturing (28.6%) industries were the main users of TC. Similarly, this result is comparatively lower as compared with other Asian countries. For example, a study by Ahn and Lee (1994) indicated that target costing adoption among the electronic machinery and machine industry in Korea was 39.1 % while in Japan the rate was 80%. This wide gap of adoption among countries is due to tbe diverse sample differences and also in the kind and type of industry involved in the study. This is based on the study conducted by Norlaila Abdullah (2003) where target costing is applicable in assembly line industries, printing and Publication, and electronics, which is the prime gap factor.
Asia-Pac/fie Manageme/11 Accou111i11g Journal. Volume 4 Issue 2. 1-27.2009
During the field observation at Enten Oil lndustries, a plant kernel crushing plant, applied target costing to monitor the various cost items that are significant in attaining the desired profit. One of its major cost drivers is kilowatt hour's usage. Relying heavily on Tenaga Nasional Bhd as the main supplier of electricity for its mechanical automatic process, energy and power cost was exorbitantly high and seemed beyond control. Driven by target costing and research, the general manager was able to identify appropriate production schedule, at night time, leading to 30% energy and power cost reduction.
Continuous Improvement (Kaizen)
The survey revealed that 19 respondents (47.5%) adopted kaizen principles that extend to cost down practices and value engineering. Based on a face-to-face interview, the manager of Alps Electronic Sdn Bhd indicated that kaizen practices resulted in positive impact on the profit. With proper planning, do, check and action cycle in its kaizen program; Alps achieved 75% actual good production units after identifying good quality measures. Jn Alps, human factor was the main cause of the product's quality defects. Implement an effective training program resulted in production operators becoming qualified employees and eliminated major quality defects. Alps believed that a poor quality product led to increase costs.
Another company that practised kaizen through value engineering was FELDA Vegetable Oil Product Sdn Bhd (FVOP). lt had successfully implemented kaizen in its processing mills. With the use of automatic oil processing network ( computer integrated computer oil processing system) in 2001, as opposed to non-high tech process, FVOP increased its daily output from 1,880 MT to 2,250 MT; decreased its manufacturing costs by I 0%; but reduced operation staff from 248 to 208. One danger of using advanced technology is the reduction of employees. Fewer workers stationed in these factories are needed while some are retrenched. This is an issue that everyone (govemment, foreign investors' ruling, students, employees and employers) has to overcome.
Benchmarking
The Application of Modem Management Accounting Techniques: A Field Study
SBU levels, FVOP used internal benchmarking where it focused on two milling processes ofrefining and fractionation. The SBU that produced the least cost per activity became the benchmark unit that enabled the FYOP committee to discover which unit failed to do a good job. A cotTective measure was adopted by less performing SBU by imitating the best practices of the perfonning SB Us on a mandatory basis.
The automobile industries had also adopted benchmarking. For instance, the Automotive Manufacturers Malaysia AMM), a vehicle assembler applied benchmarking in its production plant by taking Thailand's automobile manufacturers as its benchmark. Information intelligence seeking strategy was implemented through good contacts from its counterparts in Thailand. Improvements in its production cycle time had been achieved, from 48 hours to 6 hours per car. However, there are other critical factors that influence the company's success such as car design and durability and quality that these car manufacturers have to overcome in making the product competitive in both local and global markets.
Value Chain Analysis (VGA)
On a question of firm's ability to identify and investigate the business activities that add value to company's wealth, the study shows that 80% of respondents applied VCA. 70% of VCA activities were devoted to the major functions in production and distribution activities. For example, the petrochemical and chemical industries, YCA led respondents to outsourcing plants' maintenance services to create better value added. In an interview with a manager in FPG Oleochemical Sdn Bhd, it was indicated that the company was highly reliant on the services provided by 600 contractors to undertake the maintenance automated plant facilities during its shut down operations. This outsourcing proved to be one of the cost saving initiatives, as maintenance activities are scheduled every 3 years. It was further indicated that the firm had lesser competency to execute in-house maintenance services. As such outsourcing is more of value-creation strategy.
Asia-Pacific Management Accounting Journal. Volume 4 Issue 2, /-27. 2009
Re-engineering (RE)
The RE rate of adoption amongst the respondents was at 12.5%. Surprisingly, it was discovered, during the field observation, that oil & gas support services, chemical, petrochemical, oleo chemical and oil palm refineries did not need any re-engineering because the existing infrastructures and production facilities had already been reengineered at the inception stage. On the other hand, most of the companies in the manufacturing sector did not have plans for re-engineering as the majority of the managers explained that capital requirement was large. ln the automobile industry, field observations indicated that RE afforded a shortened cycle time in the assembly operation through re-engineering as stated earlier. No detailed interview was conducted on this issue as managers were reluctant to spend time on this matter.
Balanced Scorecard (BS)
Research findings showed that 17.5% of the respondents had adopted BS as a strategic performance measure. Most of these firms were chemical and petrochemical (35.7 %) and automotive (66.7%). Proponents of BS were companies that had been in business for 5 to 15 years (85.71 %) and 25 years ( 14.28%). The multinational fim1s had a higher rate of BS adoption (20%) as compared to their domestic counterparts (16%). Surprisingly, companies with foreign graduates as accountants ( 42.8%) had a higher incidence of BS as opposed to those having both professional (28.6%) and local accountants. (28.6%). Also, companies with higher manufacturing assets investments had a higher rate of BS adoption.
The Application of Modern Management Accounting Techniques: A Field Study
and storage period. However, some financial and non-financial indicators are used most respondents as indicated below:
Use of Financial Performance Measures (83%)
One of the most interesting discoveries of this study is that both financial and non-financial measures are used. The local companies (68%) preferred to evaluate business performance by financial measures while the multinational firms' rate was at 32%. These financial measures include ARR or accounting profit rate (82.5%), return on fnvestment (ROI) 60%, residual Income (RJ) I 0%, and Economic Value Added (EVA) I 0%. The survey revealed that ROI (56%) was most preferred by companies with business age ranging from 5 years to 35 years and 4% by companies with age less than 5 years.
Use of Non-financial Measures
Some 52.5% ofrespondents used non-financial measures (52.5%) in evaluating companies' performances, with at least one non-financial measure. The most preferred method customer's was satisfaction (52.5%), while the rest methods included power and energy consumption (7.5%), market growth (2.5%), production volume (2.5%) and innovation (10%). Respondents with businesses of less than 5 years did not adopt any non-financial measures in evaluating the company's performance. No interview was conducted on this aspect due to some limitations.
Environmental Wastes (EW) and Costs
Out of the 40 respondents, 82.5% generated EW during the production process. 100% of companies in automobile industry had waste emission, petrochemical (85%), manufacturing (79%) and oil & gas support services (50%). The kind of EW, toxic and non-toxic,varies from industry to industry and toxic waste is common in all industries. Toxic waste emission rate by industry indicates that chemical and petrochemical ranked the highest (53%), manufacturing (20%), automobile (20%) and oil and gas support services (7%). Table 5 shows the summary of annual
Table 5: Summary of Environmental Cost and Waste Issues by Industry Type of Environmental
Waste Annual Cost Incurred 3000 (RM 000)
Disposal Program Adopted:
Absorption of Environmental costs to a product:
Toxic (45%), Non-Toxic (55%)
<RM200 (2.5%)<RM I, 300 (42.5%)<RM 2000 (30%)<RM (7.5%)
Own treatment (21 %): Sent overseas (6%): Government disposal (58%)
Asia-Pac{fic Manageme111 Acco11nti11gJour11al. Volume 4 Issue 2. 1-27.2009
environmental cost outlay, waste disposal system, environmental cost accounting treatment environmental waste management as a key performance indicator. The annual EW costs ranged from less than RM 200,000 (2.5%) to RM 3 million (7.5%) but the majority (42.5%) spent less than 1.3 million per year. The majority treated the EW costs as factory overhead costs (70%) while some treated it as raw material ( 15%) and administrative costs ( 15%).
Modern Management Accounting Practices (MMAP)
A few contemporary MAP were uncovered in this study such as activity-based costing ( 17.5%), total quality management (95%),just in time production (60%), just in time purchasing (77.5%), back flush costing ( 17 .5%), and material requisition planning (82.5%), as shown in Table 6. The subsequent section relates how these MMAP are adopted in the industries.
Table 6: MMAP Rate of Adoption
MMA Practices
Activity Based Costing Total Quality Management Just-In-Time Production Just-In-Time Purchasing Back tlush Costing
Material Requisition Planning
Activity-Based Costing (ABC)
Production Layout (N = 40) Traditional(%) Cell(%)
12.5 5.00
77.5 17.5
47.S 12.S
65.0 12.5
15.0 2.50
67.S 15.0
Total(%)
17.5 95.0 60.0 77.5 17.5 82.5
The rate of ABC usage was low 17.5%. Industry wise, ABC is predominantly used in oil & gas support services (50%), chemical and petrochemical (37.5%) and manufacturing (5%). Surprisingly the automobile industry did not adoptABC. Local companies had a higher rate of adoption (71 %) in contrast to the multinational firms (29%). Companies producing multiple product lines (5 to 8) dominated in ABC applications. This finding shows a slight increment in usage of ABC relative to the findings of M acGregor et al. ( 1997) that indicated ABC was hardly practiced.
The Application o,f Modern Managemenr Accounting Techniques: A Field Study
infrastructure and running cost centers. ln the infrastructure cost center, cost pooling by three process complexes is adopted: the butanediol, oxo/syngas and acrylic complexes. All costs, direct or indirect, incurred in each complex are considered as fixed manufacturing costs. Labour costs are considered as fixed manufacturing costs which are totally in disagreement with the theory professed by academicians. The variable manufacturing overhead costs are determined by each process complex and are called running costs. Examples are electricity / power, natural gas, cooling water, nitrogen steam, waste water, demineralized water and instrument air. Tn addition, every major manufacturing activity accumulates costs, identified as a cost pool. The total cost of each categorized activity is allocated / charged to the product based on the total activity undertaken ( cost driver). The activity cost driver can be hour used, kilowatt usage and metric ton of chemical output.
Just-in-Time Production (JITPr) and Purchasing (JITP), Back Flush Costing (BC)
The JlTPr adoption rate was 60% while JTTP was 77 .5%. The fom1er was primarily used by oil & gas support services ( 100%), petrochemical and chemical (71.4%), manufacturing (47.62%) and automobile (66.7%) while the latter was mainly by the manufacturing. Based on observation and investigation it was discovered that finns using JITP did not consider availability of raw materials locally because of the convenience of technological systems and good material requisition planning practices.
For example, the BASF PATRONAS Chemicals use JIT purchasing in the procurement of its direct materials. A JIT purchasing is built-in into the production system through the use of connecting pipel.ines from the suppliers' designated location. For instance, the propylene and natural gas can be purchased through its JIT agreement with MTBE (a subsidiary company of PETRONAS) and when the needs for these chemical arise, a designated latch keeper simply open the latch for the chemical to flow directly to the production line.
Similarly, the FYOP implements JITPr in its procurement of fresh fruit bunch on a daily basis from its parent company. The uniqueness in this JTTPr arrangement is controlled by its parent company in terms of the desired tonnage requirement and delivered punctually. Other sub-materials such as bleaching ashes or earth and phosphoric acid are purchased through JTTPr from local suppliers.
Samra Merteak Sdn Bhd implements JITP. The company receives orders from customers in USA , UK, Australia and South Africa prior to the production of
Asia-Pacific Management AccoumingJournal, Volume 4 lssue 2, 1-27, 2009
next. Based on observation, these companies have very limited space for finished goods as such excessive holding costs of finished stocks are avoided. On investigation, the average stock level of parquet is sufficient to accommodate two weeks' processing period. The quantity was not ascertained at the point of observation. Samra Merteak JTTP practices show that reasonable stock is on hand for a week or two for convenience as opposed to zero inventories as professed by many academic authors. Consequently, Out of 24 JlTPr and 3 I J ITP companies, 17 .5% used back flush costing of its finished products while the remaining 82.5% utilized the traditional product costing system.
Materials Requisition Planning (MRP)
Findings indicate that M RP practices are widely practiced (82.5%) locally where local companies (84%) have a higher rate of usage as compared with the multinational companies' practices (80%). For example, Hunstman Teoxide Sdn Bhd invested RM 1.7 million to make MRP fully operational. An interview with the purchasing manager indicated that 70% of chemical inventories are imported from Germany, Australia and Japan requires an efficient chemical inventory and planning system. These materials are critical to both production and maintenance operations as inadequate stocks levels would mean daily huge losses. The company cannot tolerate this practice. To maintain an efficient and effective MRP system, all company's plant sites in the various parts of the world (Europe, Spain, Malaysia and U.S. A.) are electronically linked to determine the availability of materials before purchase signals are made. Through the MRP system, a default procedure on the volume of purchases at specific periods makes some electronic signals to the various suppliers' network worldwide. Thus, availability of stocks can be determined through MRP.
Total Quality Management (TQM)
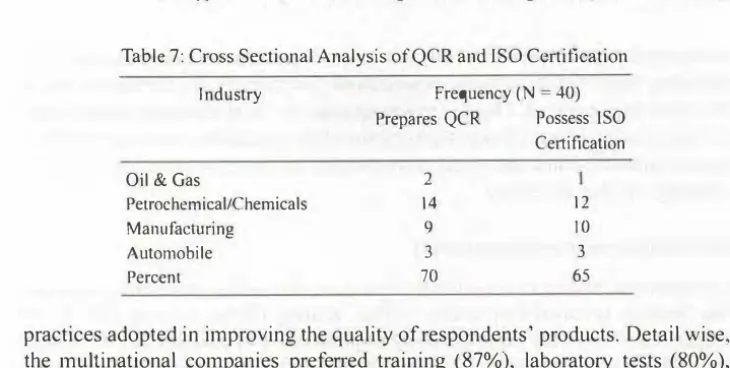
Ninety-five percent (95%) of respondents used TQM in all the four industries practices TQM except for manufacturing industries where 2 respondents preferred not to use them. Local companies had I 00% TQM affinity whilst multinationals, 87%. In adhering to TQM principles, 70% of respondents prepared Quality Cost Report (QCR) as shown in Table 7. Results of the cross sectional analysis indicates that petrochemical / chemical companies have a higher incidence of preparing the QCR as these industries need to deliver total quality to customers. An interview with the chemical company's respondent revealed that a slight non quality performance in product speci ti cation means total loss as chemical products needs no correction.
The Application of Modern Managemenl Accounting Techniques: A Field Study
Table 7: Cross Sectional Analysis ofQCR and ISO Certification
Industry
Oil & Gas
Petrochemical/Chemicals Manufacturing
Automobile Percent
Frequency (N = 40) Prepares QCR Possess JSO
Certification 2
14 12
9 10
3 3
70 65
practices adopted in improving the quality ofrespondents' products. Detail wise, the multinational companies preferred training (87%), laboratory tests (80%), inspection (77%), engineering design (60%) and warranty (33%) as strategies to product quality improvement than the local companies which preferred training (68%), laboratory test (72%), inspection (57%), engineering design (40%), and warranty 67%). The multinationals' respondents had preferences for conducting training, laboratory tests, inspection and engineering designs while the local firms preferred to give product warranties, a practice to assure potential customers that local products' quality is guaranteed. The multinationals firms, knowing that the products conform to customers' quality expectations, have fewer warranty strategies.
International Standard Organization (ISO) Certification
The survey reveals that 65% ofrespondcnts held an ISO certification, of which 42% were multinationals and 58% local companies. Companies that prepare QCR also possess ISO certification, as shown in Table 7. This shows that companies are highly balancing its incurred costs and product quality leads to higher incidence of getting through with ISO certification. Quality, to these respondents, means complying with the company's standard specifications and not quality in the point of view of customers. Interestingly, majority of the respondents are conscious of international standard recognition.
Research & Development (R & D)
Asia-Pacific Management Accoun1ingJournal, Volume 4 Issue 2, 1-27, 2009
viable products sufficient to fulfill both domestic and home country requirements including those of other subsidiaries worldwide. Surprisingly, its counterparts barely see these opportunities. There is an urgent need for local companies to use local resources to the fullest through sophisticated R & D facilities. As local companies lack of infrastructures and financial resources, the need for government R & D backing is highly necessary.
Non-Value Added Activities (NVAA)
On questions relating to existence ofNVAA, as indicated in most MA textbooks, the findings revealed that storing (85%), waiting (70%), moving (80%) and inspection (90%) were experienced by respondents. The automobile ( I 00%) and the oil & gas support service ( I 00%) industries had the highest NVAA as compared to manufacturing (87%) while petrochemical and chemical (77%) had the lowest incidence, as depicted in Table 8.
Table 8: Production Activities by Industries
Activities Types of Industries (N = 40) Total
Oil &Gas Petrochemical Manufacturing Automobile N Percent
Processing 2 14 21 3 40 100%
Storing 2 10 19 3 34 85 %
Waiting 2 7 16 3 28 70%
Moving 2 11 16 3 32 80%
Inspection 2 12 19 3 36 90%
Percent 100 77 87 100 85%
Most MA textbooks are unanimous that eliminating NVAA leads to costs reduction which is contradictory to this study's finding that the majority of the respondents failed to reduce or eliminate these activities. Interviews with three (3) managers from the petrochemical and chemical industries indicated that these activities are essential in the production process while others contended that NVAA are unavoidable as products need to be moved, stored, and inspected and tested as part and parcel oftbe companies' policies and procedures. Interestingly, all seven (7) production managers were in agreement that NVAA were continuously monitored and improved on regular basis.
Traditional ManagementAccounting Practices (TMA)
Standard Costing (SC)
The Applica1io11 of Modern Managemenl Accounling Techniques: A Field S1udy
(86. 7%) and automobile (100% ), respondents, characterized by repetitive operations with small (10,000 tons) and high (600,000 tons) monthly production outputs. SC was predominantly used among respondents with traditional production Layout (77.5%) as against by cell layout (15%). Comparatively, this finding is higher that of the Nippon University (1996) research among Japanese manufacturing firms, with 64% SC adoption rate. The finding indicates higher usage rate due to research time differences (1996 versus 2004) and the convenience it affords to users. SC is highly used by respondents as a basis for perfonnance measurement, cost assignment and decision making. The majority ofrespondents (18 or 85.7%) in the manufacturing industry use SC in the calculation of direct materials and overhead costs for the product. Interestingly, 93.5% of those respondents were using SC in the form of a rolling standard cost, where costs are reviewed every year for changes in price and usage of inputs. Despite technological development in the manufacturing sector, standard costing is still relevant to many managers in Malaysia.
Table 9: Traditional Management Accounting Practices MA Practices
Standard Costing Variance Analysis Break-even Analysis Budgeting
Variance Analysis (VA)
Producrion Layout Traditional(%) Cell{¾)
n =31 77.5 o=6 15.0 n=23 57.5 n=9 22.5 11 =22 55.0 n=5 12.5 11 = 31 77.5 n=9 22.5
Total
92.5 80.0 67.5 100
Out of the SC practitioners, further investigations were conducted on 80% or 32 respondents' to analyze its variances to determine the items that had sh011comings and caused of the variances, as a control measure, for making appropriate corrective measures. In an interview with a petrochemical respondent's manager. It was revealed the company used variance analysis as a basis for performance evaluation of managers and ultimately performance bonus. However, details of measures undertaken were beyond the scope of the study.
Budgeting and Computerized System
Asia-Pacific Managemenl Accounling Journal, Volume 4 Issue 2, 1-2 7, 2009
discovered that the majority of the respondents used historical data in budget setting and revised regularly. Budgeting was made easy by 62.5% of the respondents through the use of computerized systems while the remainders were semi computerized. Usage by industry shows 93% were chemical and petrochemical companies, manufacturing (43%), oil and gas support services (100%) and revealed 67% automobile industry. The interview with a manager from a paper manufacturing company, revealed that although budgeting had some positive impact but it was time consuming and rigid, creating much stress to the staff involved. Based on experience, budgeting is painstaking planning system which management accountant needs to find substitute planning practice that would result in better impacts on tangible and intangible resources. A suggested tool is discussed in the subsequent section.
Break-Even Point Analysis (BEPA)
Findings showed that the Adoption rate of BEPA was 67.5% of which 22 (81 %) of the respondents had multiple products lines, ranging from 2 to 10, while the remainder(l 9%) had single product lines. When the multiple products' respondents were asked about the specific usage of BEPA, the majority used it to determine the level of each product contribution, the product that provides higher profitability, while the single product firms used it for volume and profit planning purposes. Interestingly, local companies (88%), having mix product lines of 2 to I 0, had higher usage of BEPA while its multinational counterparts', with lesser product mix of2 to 5, rate was 40% as shown in Table 7. This finding shows an improved rate of adoption as manifested in the study by Tho et al. ( 1998), where 53% of 214 manufacturing firms often or always used BEPA. Other reviews indicated that Japanese firms' usage of BEPA was merely 14.8%, lower than that in Malaysia Nippon University (1996). This finding further revealed that BEPA, a traditional MA technique in planning, was found relevant among corporate managers.
Process Costing (PC)
The Application of Modern Management Accounting Techniques: A Field Study
conve1ts inputs continuously until it reaches the finished output while the latter goes througb various separate and non continued processes. One thing common in both practices is it similarly calculates average costs of output by computerized costing software. Locally, process costing is still relevant in today's costing practices despite emerging new MA practices.
Marginal Costing (MC)
The use of MC was 12.5%, predominant in automobile (33%), manufacturing industries ( 14%) as compared to pelrochemicaJ and chemical (7%). Many reviews indicate the information derived from MC is highly useful to managers in product costing for additional unit and cast tactical and sound decisions. Surprisingly, 87.5% of these respondents failed to realize the importance ofTMA in today's business competitive environment specifically in product pricing. There is a mixed view. The users of MC find it easy to use as only the variable costs are dealt with and higher amount of mark up is added and at times very slim mark up percentage is added for competitive reasons. However, managers who prefer to use other methods (full costing and own costing) contend that these systems provide them with the costs that need to be charged and covered. The excess means profit. Again the use of MC in tactical pricing and decision making is useful only to those managers who understand and have reasonable exposure to it.
Other Existing TMA
This study found that a number ofTMA techniques were adopted, ahhough the usage rate was low. Some reported finding it a useful system: job order costing JOC (5%), full costing based on actual FCbA (5%), and own costing system (2.5%) as shown in Table I 0. The JOC was mainly (I 00%) used by the oil and gas support service providers, FCbA was used by petrochemical and chemical (14%), and another 7% from the petrochemical used its own costing system. Based on observation and affirmed by the interview conducted with 5 respondents ( 12.5%), it can be concluded that companies use different types of costing systems based on the type of production process (80%), convenience and appropriateness (20%).
Economic Order Quantity (EOQ)
Asia-Pacific Management Accounting Journal. Volume 4 Issue 2. 1-2 7. 2009
Table 10: Summaiy of Product Costing Methods by Industry
Industry Total
Oil & Petrol/Chemical Manufacturing Automobile N Percent Gas
Process Costing 5 12 18 45
Marginal Costing 3 5 12.5
Job Order Costing 2 2 5
Full Costing (actual) 2 2 5
Own Costing I 2.5
The findings further indicate the adoption of EOQ is related to the number of products a company holds. Respondents with a product mix of2 to 10 had EOQ rate of adoption of 53% while single product line companies' usage was 38%. Origin wise, the multinationals had a higher usage rate ofEOQ (53%) as compared to that48% of local companies. Availability of materials' supplies is another aspect that triggers the use of EOQ. Field investigation revealed that companies with materials' availability from 70% to 100% had EOQ usage rate of 55% as opposed to those companies having less than 40% material's availability of50%.
Net Present Value (NPV) Analysis
Another technique that was measured was the NPV usage of 43%. The multinational companies had a higher NPV usage rate (47%) as compared to its local counterpart (40%). Other findings revealed that respondents with manufacturing fixed assets investments of RM I 00 million to RM I billion (57%) had a higher rate ofNPV adoption than companies with less than RMI 00 million ( 43%). This finding is similar to the previous study which indicated that large firms are most likely to use NPV than small firms, rating of 3.42 and 2.83, (Graham & Harvey, 2000). However, a study in Japanese manufacturing firms revealed a wide gap ofNPV usage rate of 15.8% (Nishimura, Nippon University 1996). In many respects, the result differs may be because they have diverse samples.
Table 11: Frequency analysis of Profit Planning Techniques by Company Origin Profit Planning Techniques Local Multinational Total
(N = 25) (N = 15) (N = 40) (Percent)
Cost-Volume Profit Analysis 88 40 67.5
Budgets 100 100 100
Material Requirement Plam1ing (MRP) 84 80 82.5
Economic Order Quantity 48 53 50
The Application o_f Modern Management Accounting Techniques: A Field Study
Respondents also used other methods in planning for capital acquisition where 17.5% used payback period (PB) and 27.5% accounting rate of returns (ARR). The usage of PB amongst respondents was significantly lower than the findings of Nishimura, Nippon University 65.5% and a rating of 2.53 or most frequently used capital budgeting technique (Graham & Harvey, 2000). Surprisingly, those using NPV techniques did not use PB and ARR to roughly screen the intended capital expenditure project as suggested by many accounting and financial practices.
Transfer Pricing (TP)
Table 12 reveals that 4 7.5% of respondents used TP system in transactions within the organization. Industry usage shows TP is highly applied in automobile industry (67%), chemical and petrochemical (64%), oil and gas (50%) and manufacturing (27%). Across industries, companies used TP system in pricing raw materials between respondents' subsidiaries. The most preferred method of TP was MPD (42.5%), followed by MP (32%), NP (21%) and least was VC+ (4.5%). Savings on transport and commission costs by the seller minimize the cost, TP, of the buying entity in the form of a discount as noted by MPD users during the interviews. This finding indicates the decentralized management system exist fairly amongst respondents due to the diversification strategies among local and multinational companies to gain competitiveness through internal capital market positioning.
Table 12: Frequency Usage Distribution of Transfer Pricing Method by Industry Industry Transfer pricing Methods
(N = 40)
MP NP MPD vc+ N
Oil & Gas
Petrochemical 2 2 5 10
Manufacturing 2 2 2 6
Automobile I I 2
Percent 32 21 42.5 4.5 19
MP= Market price; NP= Negotiated price: MPD = Market Price with Discount VC+ = Variable cost + profit
Total
Percent 50 64 27 67 47.5
Asia-Pac/fie Management Accounting Journal, Volume 4 issue 2. /-27, 2009
Management Accountant's Post (MAP)
Respondents were asked on MAP and surprisingly it did not exist amongst the respondents. The survey findings indicate that management accountants' roles in tbe corporate arena are basically assumed by a number of accounting-related posts such as finance and administrative manager (32.5%), accounts manager (22.5%), financial accountants (22.5%), senior managers ( 12.5%), cost accountant (5%) and assistant finance manager (5%) as shown in Table 13. This shows the infonnation providing service takes subservient roles in the corporate hierarchy. This suggests that most top management officials are opportunistic over their human capital. In addition, some managers willingly side step appropriate qualification of preparers as they highly value services by qualified persons who are multi-skilled. This practice in the corporate sector relegates the management accountant function tent to exploit.
Table 13: Cross Sectional Analysis of Management Accountants' Roles by Company
Gender:
Management Accountant's Role Assumed by:
Years of Service:
Male (70%); Female (30%)
Senior Manager ( 12.5%); Accounts Manager (22.5%) Finance/ Administrative Manager (32.5%); Financial Accountants (22.5%); Cost Accounting Manager (5%) Assistant Finance Manager (5%)
Less than 3 (22.5%): three to six (42.5%); more than 6 to 12 (27.5%) and more than 12 to 15 (2.5%)
In many respects, most managers perhaps are cost conscious, sometimes less concern for quality information and tend to exploit human capital, MAP barely exists as substitute personnel are available. This is supported by the findings on the educational background of those accounting staff, whose qualifications range from degrees from local tmiversities ( 47.5%), foreign universities (20%), accounting professional qualification (23%), and diploma universities (10%).
In an unstipulated analysis, respondents were asked on the staffs professional accounting affiliations, 30% of them were members of Malaysian Institute of Accountants (MIA), a regulatory body of the accountancy profession in Malaysia. Of this figure, 60% were employed by the local companies and 40% by multinational companies. As the majority of the accounting personnel are Malays, this indicates the group's interest of becoming members of a professional body.
The Application of Modern Management Accouming Techniques: A Field Study
The Field Study
During the course of the field study the following was found:
Machine start-up for automated and CNC operations were much longer ( 48 hours) than the semi-automated ( 12 hours) and manual (instantaneous). We observed that the more technologically advanced an operation became, the longer it took to start-up its production and vice-versa.
Non-Value Added Production Activities (NVAA)
In NYAA, a local company, by juridical personality, is one of the proponents of "verbund", as a transfer of inter-company communication system from Germany. Integrating this system into the local operation enables them to receive or disperse timely managerial accounting information to the various strategic business units for corrective actions and sound decision eliminating making, thus eliminating waiting time to receive the information as compared to mailing them. This approach enables them to strategically position the business and become the leading petrochemical company in the region. Above all, it suppo,ts the company's effort to pay equal attention to economic, environmental and social obligations to the local community as indicated by its managing director.
Application of Value Engineering (VE)
The plant, property and equipment were considered the major investment by all respondents in this study. The kind of facilities that could accommodate and afford production of value creating products was emphasized. Based on the field study, almost all the respondent companies had already applied value engineering either on the plant, property and equipment and to the design of the product that support the value sought by the customers. Thus, almost all of the respondents no longer needed value engineering during the life the product.
Continuous Production Process
Asia-Pacific Management Accounting Journal. Volume 4 Issue 2, 1-27. 2009
Management Accounting Techniques (MACT) as Secondary
The field study revealed that most managers were satisfied with the effectiveness of their existing MACT and replacing the ongoing technique was beyond foresight. Observation indicates that companies do not really plan the kind of MACT to be applied as opposed to the time these managers put in the production process designing and infrastructure. They give more focus on production layout first and once completed it remains perennial. Subsequently, MACT are considered only subsequent to the completion infrastnicture, production process, and human capital. The multinational firms are wholly reliant on the foreign parent companies on the application of MA CT. This corporate culture causes a slower evolution of MA CT application among industries. Moreover, the practice of MACT is still considered non-regulatory as compared with the financial accounting. However, this issue is not included in the study. Comparatively, EW observation indicates that almost all respondents in the area, regardless of industries and size they belong to have well entrenched environmental waste policies and procedures and implementations are monitored closely by related government agencies. Thus, there are lesser environmental waste disposal malpractices reported in the area. In addition, full support of top management to sustain a cleaner environment is complementary, leading these companies to achieve sustainable growth.
Conclusions and Suggestions
The main findings of this study can be summarized as: first, the use and application of MACT exists amongst large manufacturing companies although disparity exists. There was sporadic use of old fashioned-proven MACT that made integration of various techniques minimal. Second, most companies (42.5%) preferred to invest in high-tech processes rather than using sophisticated MACT. Third, the most preferred modem MACT were: 151
-TQM, 2nd -MRP, 3rd -JIT -purchasing, 4,h - Benchmarking and 6th - JIT - production. However, the least preferred were: reengineering (7.5%), and PLCC (7.5%). Fourth, the most preferred traditional management accounting techniques were: Budgeting (100%), SC (92.5%). variance analysis (80%), CVP analysis (60%), ROI (60%) and process costing (45%). And, the least preferred were Job order costing (5%) and weighted average costing (5%). Fifth, respondents' production process capabilities by industry are as follows:
I Chemical & Petrochemical Computer Controlled Machines 93%
2 Oil & Gas Support Services Automated Production Process 100% 3 Manufacturing Industry Semi-automated Production Process 90%
The Application of Modern Management Acco11111ing Techniques: A Field Study
Sixth, a higher incidence of non-value added activities during the production process existed i.e. inspection (90%), storage (85%) and moving (80%). Seventh, sixty five percent (65%) of respondents possessed ISO certification which means the majority of companies comply with operating standards. Eight, R & D activities of respondents were at 25%. Ninth, Seventy percent (70%) of respondents prepared QCR in the quest to satisfy consumers' requirements. Tenth, Forty seventy and a half percent (47.5%) of companies adopted domestic TP of which the most favored method of setting TP was market price (32%) and market price less discount (32%). Eleventh, seventy two and a half percent (72.5%) of respondents gave support to community projects and the most preferred projects were educational (23%), health, religious ( 17%) each, environmental ( 12%) and orphanage (5%).Twelfth, sixty two and a half percent (62.5%) of respondents used computerized costing systems. And, thirteenth, management accountant's position did not exist amongst respondents; however, management accounting roles were assumed and discharged by the finance & administrative manager (32.5%), accounts manager (22.5%), financial accountants (22.5%), senior manager ( 12.5%), cost accounting manager (5%) and finance manager (5%).
Asia-Pacific Management Accounting Journal, Volume 4 Issue 2, /-27, 2009
References
Abdul Rahman, I. K., Omar, N. and Sabaruddin, S.A. (2002). Japanese Management Accounting System: A Case Study if a National Automobile Supplier in Malaysia, Malaysian Accounting Review, l : 1-22.
Abdullah, N. (2003). Target Costing: An Approach to Competitive Advantage, A Colloquium Paper Presentation UiTM, Pahang, Jengka Campus.
Ahn, T. S. and Lee, C. H. (1994). Effect of Manufacturing Changes on Cost Management Practices, Korean Accounting Journal in Baydoun, N., Nishimura,
A. and Willet, R., Accounting in the Asia Pacific Region, John Wiley and Sons
1997: 228ff.
BASF PETRONAS News (2003). Reaffirming Our Commitment Towards Responsible Care, 6, 2.
BAST PETRONAS News (2003). Creating A New Benchmark In Safety, 5th Issue.
Chandler, A. D. ( 1977). The Visible Hand: The Managerial Revolution in American Business, Cambridge MA-Harvard University Press.
Graham, J. R. and Harvey, C. R. (2000). The Theory and Practice of Corporate Finance: Evidence from the Field, Duke University, Durham, U. S. A.
Johnson, H. T. and Kaplan, R. S. (1987). Relevant Lost -The Rise and Fall of Management Accounting, Boston, MA: Harvard Business School Press.
Langfield, K. S., Thorne, H. and Hilton, R. W. (2006). Management Accounting: Information for Managing and Creating Value, 4th Ed, McGraw Hill Irwin.
MacGregor, A. and M. Hossain, et al. (1997). Accounting in Malaysia and Singapore in Nishimura, A., Asian Economic Growth and Management Accounting,
Malaysian Accounting Review, I, I: 96.
Nishimura, A. (2002). Asian Economic Growth and Management Accounting. Management Accounting Review (September 2002), 1, 1: 87-l O l .