ABSTRACT
This paper investigated how management accounting (MA) was applied in a turnaround strategy to recover from a company’s fragile business position. A case study at a Malaysian company, Care, that went through a turnaround process was conducted to understand how the use of MA contributed to their turnaround process. While an economic downturn is claimed to be the major cause of poor organisational performance, Care was in a financial distress situation before the economic crisis. More importantly, Care successfully recovered their poor condition during the economic downturn with the use of MA techniques. This paper describes the way MA was utilised before, during and after the turnaround process. Prior to the economic crisis, MA was used merely to provide reports with no strategic focus. Failure to manage cost and understand the changes in the market compromised their performance. It is during the turnaround phase that MA information was used to understand the company’s current performance to devise a turnaround strategy, cost reduction and revenue generation. Concurrently, MA techniques which focused on quality was introduced. Consequently, better quality products at a lower production cost contributed towards improving their financial performance. More sophisticated MA techniques were introduced post turnaround period to sustain their performance. This paper contributes toward demonstrating how MA facilitates the turnaround process while undergoing an economic crises. Concurrently, it helps to minimise the gap between MA theory and practice by describing the application of MA in a
turnaround strategy.
Keywords: Management accounting, management accounting practice, turnaround strategy
IN A TURNAROUND STRATEGY
Adibah Jamaluddin1, Nurul Izwah Mohd Husin2 and Normah Omar3
1Universiti Teknologi MARA, Malaysia E-mail: [email protected]
2Bank Muamalat, Malaysia
E-mail: [email protected]
3Accounting Research Institute (ARI), Universiti Teknologi MARA, Malaysia E-mail: [email protected]
ARTICLE INFO
INTRODUCTION
Tikiciet al. (2011) claimed that the major external cause that contributes
to organisational decline is an economic crises. Hence, it is critical for
companies to rely on their accounting information to devise appropriate strategies and action plan to survive the crisis (Erolet al., 2011). Although issues on corporate recovery and the turnaround strategy can be traced as early as the 1980s (e.g. Hofer, 1980), empirical research is mainly focused on quantitative studies (Boyne, 2006). Consequently, practitioners find it difficult to practically apply the turnaround strategies, thereby adding the gap between MA theory and practice (Baldvinsdottir et al., 2010). Hence,
Baldvinsdottir et al. (2010) call for MA research which aims at providing
practical accounting development.
Haron et al. (2013) contend that understanding a turnaround process is vital for a company to add value and create their competitive advantage. However, for some companies, undertaking a turnaround strategy is very risky, where opening a new business may offer a better solution and be cheaper (Canda, 2002). While there are many successful turnaround stories such as Adidas, British Steel, and Chrysler, which survived their worst financial crisis (Zimmerman, 1989), a great number of firms failed to recover their financial position (Pandit, 2000). Hence, turning around a company’s position is challenging.
In Malaysia, the financial crisis and the global economic slowdown had resulted in many businesses going through bankruptcy proceedings. Many companies failed to recoup from the financial crisis due to being unaware of the possible turnaround strategies or the effectiveness of the strategies to revive their weak performance (Haron et al., 2013). Additionally, there is limited evidence of the role of MA in the implementation of a turnaround strategy (Pandit, 2000; Haron et al., 2013) especially in non-Western countries (Schoenberg et al., 2013). Therefore, the objective of this study was to examine the role of MA in turnaround strategies.
A case study was conducted at a Malaysian company, Care (a
pseudonym), which successfully turned around their position during the economic crisis period. Consistent with Haronet al. (2013), we demonstrate
in a difficult period successfully. More importantly, the turnaround process occurred during the economic downturn period where most companies were severely affected. In support of Baldvinsdottiret al. (2010) who call for a minimisation of the gap between MA theory and practice, the findings provide an understanding of the role of MA in turnaround strategies and how practitioners can use MA to turnaround their business performance.
LITERATURE REVIEW
A corporate turnaround is a situation where a firm’s economic performance has recovered from an existence-threatening decline (Balgobin & Pandit, 2001). One of the main reason for being in such a financial distress situation is the occurrence of global economic crises which has severely resulted in
production loss and unemployment (Erolet al., 2011). Hence, research on corporate turnaround tends to focus on identifying the causes, strategy, and the process to recover from such a fragile business position (Balgobin & Pandit, 2001; Haronet al., 2013).
Hofer (1980) discusses four ways to revive a company’s financial position, (1) revenue generation strategy, (2) cost-cutting strategy, (3) asset reduction strategy, and (4) combining two or all the strategies. While the revenue generation strategy aims to improve a company’s liquidity and profitability position by price-cutting and massive advertising to stimulate sales, the cost-cutting strategy aims for survival and generating sufficient cash by restructuring the organisation and financial cutbacks. Whereas, an asset reduction strategy relates to the sale of unproductive assets. Therefore, to implement any of the turnaround strategies, relying on MA information and techniques are crucial (Erolet al., 2011).
However, MA was criticised for being irrelevant (Johnson & Kaplan, 1987) which saw the development of MA research to promote accounting for strategic positioning by linking management control system and strategy (Langfield-Smith, 1997). Accordingly, the Balanced Scorecard (BSC) was introduced to bring MA to a broader perspective by linking strategy and vision, financial and non-financial measures to be used by managers across the organisation such as management, marketing, information system, and operation management (Kaplan & Norton, 1996; Kaplan & Norton, 2004). Other MA techniques introduced include Total Quality Management (TQM), Value Engineering and Zero-based Budgeting (Drury, 2008).
Nevertheless, the extent of adoption and success of MA in practice remains questionable (Langfield-Smith, 2008) particularly in the area of
a corporate turnaround (Haronet al., 2013). In response, this study aimed to contribute to the body of literature by demonstrating the role of MA in
a turnaround strategy.
RESEARCH CONTEXT AND METHOD
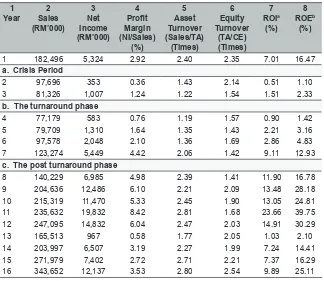
A case study was conducted at Care (a pseudonym), to explore how they used MA techniques in turning around its weak performance. Incorporated since 1972, Care was fighting an uphill battle to establish its position in the local fertiliser industry. Due to high production costs and fading customer confidence, Care’s profit level for two consecutive years, i.e. Year 2 and Year 3 had sharply declined by more than 90% as compared to Year 1 (Table 1). The weak performance was alarming considering that fertiliser consumption had been on an upward trend prior to Year 1. However, from Year 8 onwards, Care began to recover from its fragile financial position and started to progress as evidenced by the key financial indicators such as
sales, net income, return on investment (ROI) and return on equity (ROE)
Table 1: Selected Financial Ratios from Year 1 to Year 16
1
Year Sales2 (RM’000) 3 Net Income (RM’000) 4 Profit Margin (NI/Sales) (%) 5 Asset Turnover (Sales/TA) (Times) 6 Equity Turnover (TA/CE) (Times) 7 ROIa (%) 8 ROEb (%)
1 182,496 5,324 2.92 2.40 2.35 7.01 16.47
a. Crisis Period
2 97,696 353 0.36 1.43 2.14 0.51 1.10
3 81,326 1,007 1.24 1.22 1.54 1.51 2.33
b. The turnaround phase
4 77,179 583 0.76 1.19 1.57 0.90 1.42
5 79,709 1,310 1.64 1.35 1.43 2.21 3.16
6 97,578 2,048 2.10 1.36 1.69 2.86 4.83 7 123,274 5,449 4.42 2.06 1.42 9.11 12.93
c. The post turnaround phase
8 140,229 6,985 4.98 2.39 1.41 11.90 16.78
9 204,636 12,486 6.10 2.21 2.09 13.48 28.18 10 215,319 11,470 5.33 2.45 1.90 13.05 24.81
11 235,632 19,832 8.42 2.81 1.68 23.66 39.75
12 247,095 14,832 6.04 2.47 2.03 14.91 30.29
13 165,513 967 0.58 1.77 2.05 1.03 2.10
14 203,997 6,507 3.19 2.27 1.99 7.24 14.41
15 271,979 7,402 2.72 2.71 2.21 7.37 16.29
16 343,652 12,137 3.53 2.80 2.54 9.89 25.11 a= Column 4 x Column 5
b= Column 4 x Column 5 x Column 6
Source: Care’s Financial Statements from Year 1 to year 16
Care was selected as a case study for two reasons. First, Care did not
only manage to turnaround their weak performance before the occurrence of an economic downturn; it was remarkable that the company also improved their financial position during the critical time. Second, Care’s notable performance resulted in the company being selected as one of the recipients for the National Award for Management Accounting (NAfMA) Best Practice Framework. The NAfMA award was deemed appropriate to
Phase 1 of the research process involved a literature review in the area of MA and corporate turnaround. This is the phase where research questions were refined. Phase 2 was where data was collected using semi-structured and non-semi-structured interviews with the directors and managers, followed by observations at Care. The data were complemented by internal documents provided by the research participants, annual reports, web pages and media coverage. During Phase 3, the initial findings and reports were sent to the research participants for validation purposes. In particular, the interviewees provided feedback on whether the researchers correctly interpreted the interviews and observations. Accordingly, the data were analysed by classifying the case study into three stages, the crisis period (Year 2 – Year 3), the turning point (Year 4 – Year 7) and the post turnaround phase (Year 8 – Year 16).
FINDINGS
The Crisis Period (Year 2 – Year 3)
Care began its operation five years before its incorporation in 1972. In 1967, the parent company set up the first compound fertiliser manufacturing plant in Malaysia. Being the only manufacturer in producing potassium nitrate, complex compound fertilizer, Care was recognised as one of the key players in the field. One of its brand names gained popularity, and customers received the products for three consecutive decades well. Since then, Care was well-known for its superior and quality products as evidenced by a
various award received on product quality.
However, the stagnant fertiliser industry, poor commodity prices and intense competition exposed Care to new challenges as competitors began to offer cheaper products or better-quality products at affordable prices. More importantly, we found that the company faced two major problems:
(1) escalating production and administrative cost and (2) deterioration in
The second problem relates to deterioration in customer confidence. The market share had shrunk significantly from 45% in Year 1 to roughly 10% to 20% during the crisis period (Year 9). Two main reasons were identified: (1) failure to maintain product quality due to the high frequency of machine breakdown and (2) failure to innovate new products. Consequently, Care’s compound fertiliser market share had dropped from 30% in Year 1 to as low as between 10% to 20% during the crisis period (Year 9), thus hurting their bottom line.
Meanwhile, Care began to lose its competitive advantage due to (1) employees lack of cost consciousness and (2) priorities were placed on short-term performance measures. During this period, there was poor cost control. Care failed to manage its costs effectively due to (1) some operational managers not understanding the nature of the expenses in the budget; (2) it was a common practice for managers to inflate their budgets, without having to provide justification; (3) irrational expenses (transactions) were evidenced in some departments, (4) internal control was compromised; (5) incremental budgeting were used resulting in excessive budgeting amounts; and (6) it was a common phenomenon for managers to incur unnecessary spending towards the second half of the year to maintain or increase their future budget.
Additionally, the management placed too much emphasis on short-term measures by depending heavily on financial information such as profit and loss and balance sheet figures at the expense of non-financial information such as product quality, customer satisfaction and employee productivity level. Consequently, Care failed to notice the changes in the marketplace, where other market players were introducing new products at better prices. For example, merely relying on the rudimentary management accounting tools such as the application of Budgeting and Financial Statement Ratio Analysis resulted in the management being unable to detect red flags and take corrective actions accordingly. Hence, innovation was not initiated resulting in no new product introduced to maintain their market shares.
The Turnaround Phase (Year 4 – Year 7)
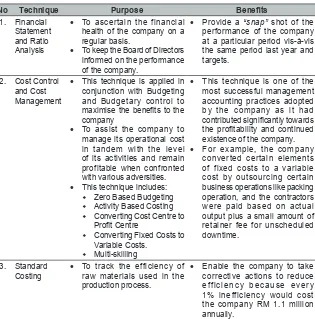
heavily on MA to make decisions. The role of MA information at this stage was to (1) understand current performance and take proper corrective action (2) motivate the employees to increase their efficiency (3) evaluate and fairly measure performance (4) assess the company’s strategic positioning (Table 2). For example, the CVP Analysis was used to determine (1) type of fertiliser to produce; (2) which customer to prioritise upon facing any constraint; (3) pricing policy. Accordingly, two strategies were devised, cost reduction and revenue generation, as the turnaround strategy.
Table 2: Management Accounting Techniques Applied
during Turnaround Period (Year 4 – Year 7)
No Technique Purpose Benefits
1. Financial Statement and Ratio Analysis
• To ascertain the financial health of the company on a regular basis.
• To keep the Board of Directors informed on the performance of the company.
• Provide a “snap” shot of the performance of the company at a particular period vis-à-vis the same period last year and targets.
2. Cost Control and Cost Management
• This technique is applied in conjunction with Budgeting and Budgetary control to maximise the benefits to the company
• To assist the company to manage its operational cost in tandem with the level of its activities and remain profitable when confronted with various adversities.
• This technique includes:
Zero Based Budgeting
Activity Based Costing
Converting Cost Centre to Profit Centre
Converting Fixed Costs to Variable Costs.
Multi-skilling
• This technique is one of the most successful management accounting practices adopted by the company as it had contributed significantly towards the profitability and continued existence of the company.
• For example, the company converted certain elements of fixed costs to a variable cost by outsourcing certain business operations like packing operation, and the contractors were paid based on actual output plus a small amount of retainer fee for unscheduled downtime.
3. Standard
Costing • To track the efficiency of raw materials used in the production process.
4. Cost-Benefit
Analysis • To seek approval for capital and operating expenditure. • Enable line managers to tabulate their proposal for capital and operating expenditure systematically and logically for management decision-making. 5. Cost Volume
Profit Analysis
• To obtain at the optimum
pricing strategy • Enable decision on pricing that would maximise the profitability of the company.
6. Total Quality Management (Quality Improvement Activities)
• To enhance the competitiveness of the company.
• To equip all personnel to undertake quality improvement activities.
• As a means to solve problems affecting the company’s operation.
7. Productivity
Analysis • To monitor the performance of the company between specific periods, and between the company and other competitors on specific areas of operation.
• Enable tracking of its performance vis-à-vis specific areas which were important in achieving the strategic objectives. 8. Relevant Costing and Decision-Making Analysis
• To provide useful information for pricing decision on compound fertilisers.
• Contribute to enhancing the company’s bottom line.
The main MA techniques that were practised during this period were:
Zero Based Budgeting (ZBB) with modified Activity Based Costing (ABC)
Total Quality Management (TQM)
The TQM activities, which started at the beginning of Year 3 was in tandem with the changing needs of the company from being a “product
driven” to “customer-driven” company. The program consisted of three
main quality programs, Awareness Workshop, Measurement and Problem Solving, and forming a Quality Improvement Team. The aim was to promote the culture of continuous improvement, towards increasing customer satisfaction. An Awareness Workshop was introduced in Year 3 to train employees on the importance of quality to the business environment and the need to improve product and services to satisfy internal and external customers. The Measurement and Problem-Solving Workshops focused on selected employees, who were coached on resolving problems affecting business performance. Following this, Quality Improvement Teams were formed to address issues that affected the efficiency of operations. Indirectly, Care empowered employees to come out with new initiatives to improve operational efficiencies while at the same time striving to achieve the company’s strategic goals.
Prior to Year 4, the productivity level was identified to be low, thus resulting in high costs. Following the turnaround strategy, the profit margin had substantially increased from Year 4 [Year 5 (115.79%), Year 6 (176.31%) and Year 7 (481.58%)] (Table 1). It indicated that the cost reduction strategies undertaken by the Managing Director began to materialise. The improved cost control, particularly through the application of ZBB with Modified ABC contributed to a higher bottom line recorded for all turnaround years under review [Year 4 (RM 0.58 million), Year 5 (RM 1.31 million), Year 6 (RM 2.05 million) and Year 7 (RM 5.45 million).
The Post Turnaround Phase
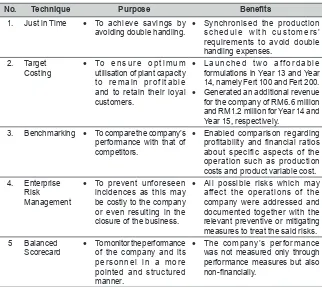
In Year 13, the slumped in the Crude Palm Oil (CPO) price below the production price, forced Care to re-examine its corporate strategies while utilising MA. The decline in product demand and an increase in fixed costs resulted in the application of an improved and more sophisticated MA techniques such as Target Costing and Just in Time. Care continued to apply several sophisticated MA techniques to manage its daily business operations as listed in Table 3.
Table 3: Additional Management Accounting Techniques
Applied After Turnaround Period (Year 8 – Year 16)
No. Technique Purpose Benefits
1. Just in Time • To achieve savings by
avoiding double handling. • Synchronised the production schedule with customers’ requirements to avoid double handling expenses.
2. Target
Costing • To e n s u r e o p t i m u m utilisation of plant capacity to remain profitable and to retain their loyal customers.
• L a u n c h e d t w o a ff o r d a b l e formulations in Year 13 and Year 14, namely Fert 100 and Fert 200.
• Generated an additional revenue for the company of RM6.6 million and RM1.2 million for Year 14 and Year 15, respectively.
3. Benchmarking • To compare the company’s performance with that of competitors.
• Enabled comparison regarding profitability and financial ratios about specific aspects of the operation such as production costs and product variable cost. 4. Enterprise
Risk Management
• To prevent unforeseen incidences as this may be costly to the company or even resulting in the closure of the business.
• All possible risks which may affect the operations of the company were addressed and documented together with the relevant preventive or mitigating measures to treat the said risks.
5 Balanced
Scorecard • To monitor the performance of the company and its personnel in a more pointed and structured manner.
• The company’s performance was not measured only through performance measures but also non-financially.
Zero Based Budgeting (ZBB) with Modified Activity Based Costing (ABC)
online budgeting process assisted the managers to control their fixed and variable costs more effectively. Moreover, the system enabled the managers to optimise the use of resources to increase the efficiency of their business
processes.
Target Costing
Given the impaired customer’s purchasing power due to the volatile CPO prices in Year 13, Care decided to adopt target costing. By focusing on two important criteria (1) customer’s affordability and (2) nutrients
requirements, Care introduced two new formulations namely, Fert A and
Fert B (pseudonyms) which were launched in Year 13 and Year 14. The new MA technique enabled Care to achieve optimum utilisation of plant capacity while maintaining their profit and retaining loyal customers.
Just-In- Time
The Just-In-Time technique was used to synchronise the production and delivery schedules to enable the loading of the fertiliser from the production line to the waiting lorries directly, thus avoiding double handling. The practice had resulted in cost savings in handling costs of approximately RM0.02 million and RM0.06 million for year Year 14 and Year 15 respectively.
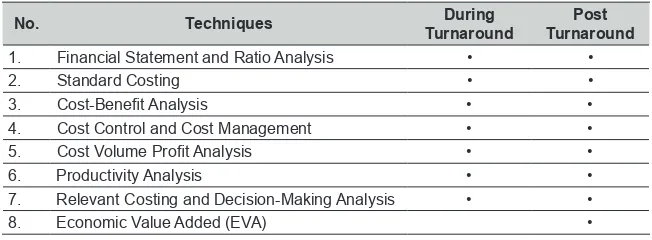
It was obvious that more sophisticated MA techniques were introduced during the post turnaround period (Table 4). The most preferred technique was Target Costing, Just in Time, Benchmarking and the Balanced Scorecard as a tool to improve Care’s business performance.
Table 4: List of All Management Accounting Techniques
during and After the Turnaround Period (Year 4 – Year 16)
No. Techniques TurnaroundDuring TurnaroundPost
1. Financial Statement and Ratio Analysis • •
2. Standard Costing • •
3. Cost-Benefit Analysis • •
4. Cost Control and Cost Management • •
5. Cost Volume Profit Analysis • •
6. Productivity Analysis • •
7. Relevant Costing and Decision-Making Analysis • •
9. Just in Time •
10. Target Costing •
11. Benchmarking •
12. Enterprise Risk Management •
13. Balanced Scorecard •
The subsequent nine years after the turnaround phase marked a significant improvement in ROI and ROE. Although, the trend fluctuated, by the end of Year 16, the ROI and ROE recorded were 9.89% and 25.11% respectively (Table 1). Hence, the application of both traditional and emergent MA practices were claimed to contributed to the improved financial health in the post turnaround period.
DISCUSSION AND CONCLUSION
The role of MA is to provide financial and non-financial information for planning, decision-making, controlling and performance evaluation (Drury, 2008). Our findings support the argument by demonstrating how the use of MA was critical in reviving Care’s weak organisational performance.
The Crisis Period (Year 2 – Year 3)
The role of MA in this phase was quite insignificant. The reason is Care’s management relied heavily on financial statement figures instead of understanding cost information. Consequently, non-financial information indicators such as efficiency and quality were neglected. Moreover, the emphasis was on the short-term measures, instead of long-term ones. Thus, there were no proper strategies or action plan taken to ensure the company remained competitive. At this point, MA information was not utilized for the strategic process. For example, although basic MA techniques such
as Financial Statement Analysis, Ratio Analysis and Budgeting was used,
The Turnaround Phase (Year 4 – Year 7)
Under the new management, there had been a lot of improvement in the implementation of MA techniques and the use of MA information. First, the budgeting process was improved by adopting ZBB with modified ABC to control and manage costs. By emphasising on cost consciousness and cost reduction, Care’s head of departments became more alert and aware of the costs incurred. Second, Care began to pay more attention to qualitative indicators by aiming to inculcate a quality culture among its employees. The program focused on producing quality products to customers. The MA practice at this period focusseds on the reduction of waste in resources used in the business process and the creation of value to its employees, customers and shareholders. Meanwhile, the MA techniques used such as Financial
Statement Analysis and Ratio Analysis, Standard Costing and Cost Volume
Profit Analysis continued to be used with a more strategic focus.
Proper execution of MA techniques resulted in an improvement in Care’s bottom line, subsequently delivering higher returns to shareholders. The MA practices had enabled Care to recoup from a financially distressed position and regained its market position in the industry. Care’s marketing strategies and quality efforts began to materialise as the sales figures continued to soar each year, signalling an increase in product demand. Meanwhile, the employees began to record a higher productivity level, reducing both labour and administrative costs. By Year 7, the company had successfully recorded a ROI of 9.11%, which was higher than the ROI posted in Year 1, i.e. 7.01% (Table 1).
More importantly, the role of MA extended by providing a link between management and employees, between the company and customers and finally between the management and shareholders. In turning around the declining performance, the management focused on improving the productivity of the plant and the workers. For such purposes, the management depended heavily upon the information generated from the MA system to provide both financial and non-financial reports such as financial statement analysis, production report, plant efficiency report and profitability report to measure
and evaluate past performance. Accordingly, a more informed decision was
new ones. Additional machines were also purchased to increase productivity. For such a purpose, relying on the Productivity Analysis and Cost and Benefit Analysis helped in determining whether the existing resources were used optimally. What was more important is, this occurred when the economic environment began to deteriorate where the economic financial crisis happened in Year 9.
Another profound aspect is the use of advanced manufacturing technologies. These had successfully changed the production process to meet Care’s objectives. The shift from being labour-dependent to machines had affected the cost structure. During this period, the overhead formed the largest component of Care’s costs. Realising this, Care deployed a modified version of ABC, which was used together with ZBB. All operational managers had to understand the nature of the costs incurred in their departments. Thus, using MA information to arrive at the optimal budget had effectively supported the planned level activities. The MA techniques allowed the current activities to be consistently controlled and monitored.
To increase market share, Care introduced TQM programs aimed at improving product quality to meet customers’ expectations. Employee involvement in this program had resulted in the improvement of internal communication between the management and employees. In particular, the employee’s input or suggestions were taken into consideration by the management. In tandem with the quality efforts, Care managed to change its marketing strategy to accommodate its customer-oriented approach. Here, MA information played a significant role in providing the information on cost, volume and profitability of each product lines to meet customer needs while ensuring that both price and volume can cover the costs incurred.
The Post Turnaround Phase (Year 8 – Year 16)
The use of multiple MA techniques such as ZBB with a modified ABC, Cost Volume Profit Analysis, Ratio Analysis, Profitability Analysis, Target Costing, Just in Time and Total Quality Management was to complement the shortcomings of each technique. For instance, ZBB with a modified ABC was used as the cost control mechanism while Ratio Analysis was applied to measure financial performance like sales, gross profit and net profit. Thus, the usage of various MA techniques had become a comprehensive tool for Care to sustain its position in the industry.
The limitation of this study is a generalization to other settings may be difficult as the sample size is limited to one particular company. However, we argue that the findings can be internalised by other practitioners seeking to recover their weak financial performance and be able to respond appropriately and promptly to unfavourable circumstances. Meanwhile, future studies may consider extending this type of research to other companies in different industries to examine whether there are similarities in the application of MA techniques. More importantly, while this paper offers the lessons that can be drawn from the body of work on organisational recovery in the private sector, future studies may explore how public service turnaround should be analysed and achieved. By using the same research method, i.e. a case study approach; further observations can be made with regard to the relationship between turnaround strategies and MA practices.
REFERENCES
Ahrens, T. & Chapman, C. S. (2006). Doing qualitative field research in management accounting: Positioning data to contribute to theory.
Accounting, Organizations and Society, 31(8), 819-841.
Baldvinsdottir, G., Mitchell, F. & Nørreklit, H. (2010). Issues in the relationship between theory and practice in management accounting.
Management Accounting Research, 21(2), 79-82.
Balgobin, R. & Pandit, N. (2001). Stages in the turnaround process: The
Case of IBM UK. European Management Journal, 19(3), 301-316.
Bromwich, M. (1990). The case for strategic management accounting: The role of accounting information for strategy in competitive markets.
Accounting, Organizations and Society, 15(1), 27-46.
Burchell, S., Clubb, C., Hopwood, A., Hughes, J. & Nahapiet, J. (1980). The roles of accounting in organizations and society. Accounting,
Organizations and Society, 5(1), 5-27.
Canda, P. (2002), Corporate turnaround: Strategies for renewal. McGraw-Hill Publishing Company Limited: New Delhi.
Drury, C. (2008), Management and cost accounting. CENGAGE Learning:
Bath, UK.
Erol, M., Apak, S., Atmaca, M. & Öztürk, S. (2011). Management measures to be taken for the enterprises in difficulty during times of global crisis:
An empirical study. Procedia-Social and Behavioral Sciences, 24,
16-32.
Haron, N. H., Kamal Abdul Rahman, I. & Smith, M. (2013). Management accounting practices and the turnaround process. Asian Review of
Accounting, 21(2), 100-112.
Hofer, C. W. (1980). Turnaround strategies. Journal of Business Strategy, 1(1), 19-31.
Johnson, H. T. & Kaplan, R. S. (1987). Relevance lost: the rise and fall of
management accounting, Harvard Business School Press: Boston, MA.
Kaplan, R. S. & Norton, D. P. (1996). Using the balanced scorecard as a
strategic management system. Harvard Business Review, 74(1), 75-85.
Kaplan, R. S. & Norton, D. P. (2004). Strategy maps: Converting intangible
assets into tangible outcomes. Harvard Business Press: Boston, MA.
Langfield-Smith, K. (1997). Management control systems and strategy: A
Langfield-Smith, K. (2008). Strategic management accounting: How far have we come in 25 years?. Accounting, Auditing & Accountability
Journal, 21(2), 204-228.
Pandit, N. R. (2000). Some recommendations for improved research on
corporate turnaround. Management, 3(2), 31-56.
Robbins, D. K. & Pearce, J. A. (1992). Turnaround: Retrenchment and
recovery. Strategic Management Journal, 13(4), 287-309.
Schoenberg, R., Collier, N. & Bowman, C. (2013). Strategies for business turnaround and recovery: A review and synthesis. European Business
Review, 25(3), 243-262.
Tikici, M., Omay, E., Derin, N., Seçkin, S. N. & Cüreoğlu, M. (2011). Operating turnaround strategies during crisis periods: A research on manufacturing firms. Procedia-Social and Behavioral Sciences, 24,
49-60.
Zimmerman, F. M. (1989). Managing a successful turnaround. Long Range