Published online February 6, 2015 (http://www.sciencepublishinggroup.com/j/ajce) doi: 10.11648/j.ajce.s.2015030202.13
ISSN: 2330-8729 (Print); ISSN: 2330-8737 (Online)
The study of different geometrical parameter effects for
single grid layers of space structure on performance level
for vertical load of earthquake
Hamid Shahrabadi
Department of Civil Engineering, Chabahar Maritime University, Chabahar, Iran
Email address:
To cite this article:
Hamid Shahrabadi. The Study of Different Geometrical Parameter Effects for Single Grid Layers of Space Structure on Performance Level for Vertical Load of Earthquake. American Journal of Civil Engineering. Special Issue: Research and Practices of Civil Engineering in Developing Countries. Vol. 3, No. 2-2, 2015, pp. 10-17. doi: 10.11648/j.ajce.s.2015030202.13
Abstract:
Acceptance and popularity of space structure among architectures and designers is due to reasons such as: great spans covering, magnificent architecture, extremely low weight, the ease of building process, speed in installation, quality of response to earthquake, etc. Considering that usually large population live in space structured buildings, resistance and safety of the structures against destructive factors such as earthquake is very important. In this paper, we examine the effects of different geometrical parameters such as: type and shape of support on performance level of single grid layer of space structures and their performance at different risk stages are examined based on the regulations stated in Iranian Standard for Retrofitting of Existing Buildings. Since there is no acceptance criteria in international codes defined for determination of performance level (among Iranian code) in space structures, these criteria are suggested primarily. Finally performance points and levels of these structures are obtained by illustrating the capacity curves. Nonlinear static analyses (pushover) are carried out on the selected models using SAP and ANSYS software. Performance levels and capacity spectrums are obtained by FEMA and ATC40 bylaw.Keywords:
Single Grid Layer Space Structure, Performance Level, Capacity Spectrum, Nonlinear Static Analysis, Pushover Analysis1. Introduction
Space structures have three-dimensional behavior and cannot be analyzed in plane state. These structures are very regular in geometry and are repeated by a specific pattern next to each other. Steel is the most frequent material in space structures, but aluminum; and wood could also be used.
Space structures have high degree of indeterminacy. The configuration and connections type prevent total failure in the system due to elimination of one element of the structure. Thus, if some elements in a grid lose their functionality due to the applied loads, other elements can corporate in tolerating the loads and can distribute the forces tolerated by the lost elements. Thus, in these structures, extreme damages do not cause sudden collapses. In recent years the use of these structures is increasingly expanding because of improvements in civil and architecture engineering, the software, welding, casting and forging industry, advanced
machinery for product and assembly of prefabricated units. Different types of space structures are:
Plane Grids: The construction of these structures is 2-sided, 3-sided, 4-sided, single layer, double layer, triple layer or multi layer. Single layer plane grids are usually used for roofing small spans. For bigger spans double, triple or multi layer grids are used. Connections in single layer plane grids are rigid for stability of the structures. In double, triple or multi layer grids connections can be rigid, semi rigid or hinged.
Barrel Vaults: Barrel vault is a structure shaped by curving a grid to one single direction. Barrel vaults can be used in the form of single layer or double layer in different structures. In some structures barrel vaults are constructed without columns. They are placed in their corner edges connected to the supports.
two different directions. A dome's surface is usually a part of a sphere, cone or connection of multiple surfaces. Domes can be constructed in form of single layer, double layer or multi layer. The connections of domes are rigid, semi rigid or hinged.
Other Space Structures including: air field structures, folding structures, bridges, etc. [1, 2]
2. Capacity and Reflection Spectrum
2.1. Capacity
Total capacity of a structure depends on deformation capacity and strength of every single element of structure. To determine the post yield capacity of structure, nonlinear analysis such as pushover analysis is used. In this method, a series of consecutive elastic analysis is used to draw load-total displacement curve. In each step, the mathematical model is revised in a manner that the strength loss due to yielded elements is considered in the calculations. Vertical load distribution is increased repeatedly until one of the predefined limitations is reached.
2.2. Demand
Ground motion during an earthquake generates a complicated pattern which varies by time. It is not possible to consider these motions in each step to determine the demands of structural of design. The term "demand" usually mentioned as displacement demand, is the maximum expected response of a structure during an earthquake.
2.3. Performance
Having determined the capacity curve and displacement demand of structure, performance control is done. Performance control is carried out to assure that no damage is occurred in structural and nonstructural elements until achieving acceptable limitations of performance goal. [2, 3, 4]
3. Structural Capacity Determination
and Capacity Spectrum Method
The nonlinear static analysis is used for determination of the structures capacity which is shown as a curve. In the capacity curve of a structure the vertical axis is structure's base shear and the horizontal axis is roof displacement. In this article this diagram is constructed of the structure's vertical earthquake force (vertical axis) versus the structure's vertical displacement (horizontal axis). It should be noted that capacity curve (which is usually generated to indicate the structure response in the first mode) is based on this assumption that the structure's main vibration mode is the dominant mode of response. This assumption is valid for the structures with one second main vibration mode or less, but with longer periods in very soft structures, the effects of next vibration modes should also be considered in analysis. [5, 6]
In this method, performance point of structure is
determined by crossing the capacity spectrum and suitable demand response spectrum which is decreased due to nonlinear effects. [3, 4]
4. Determination of Performance Point
Using Capacity Spectrum Method
Performance point indicates a condition in which structure capacity and seismic demand are equal. On this basis, the best method to determine performance point is crossing the capacity curve and the demand curve in which nonlinear effects are considered. The performance point is the crossing point of these two curves. It should be notice that the capacity curve is the base shear versus roof displacement and the demand curve is the spectral acceleration versus vibration period of the structure. In this paper the capacity curve is constructed by the vertical force of the earthquake versus the vertical maximum displacement and the demand curve is the spectral acceleration versus vibration period of the structure. Thus these two curves cannot be crossed in the same coordination system. Thus the demand and capacity curves
are converted to acceleration response
spectrum-displacement (ADRS) format. Then the curves are graphed in (Sa-Sd) coordinates to calculate the performance
point. The calculation of performance point consists of the following steps:
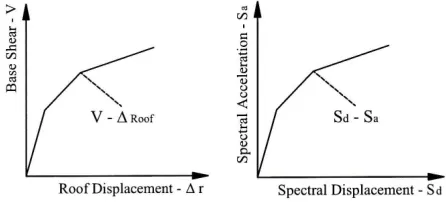
4.1. Converting Capacity Curve to Capacity Spectrum
The capacity curve is constructed of the base shear axis versus roof displacement axis. The capacity spectrum expresses the capacity curve of the structure as the acceleration displacement-response spectrum (ADRS). This is shown as a diagram of Sa axis versus Sd axis. Each point on
the capacity curve with (∆roof,V) coordination is
corresponded to (Sa,Sd) coordination on the capacity
spectrum.
Figure 1. Conversion of Structure's Capacity Curve to Demand Curve
1
a W
V S
α
= (1)
1 , roof 1
roof
d PF
S
φ ∗ ∆
= (2)
∆roof: the displacement in roof level.
Φroof,1: the value of first mode shape in roof level.
α1: the mode mass coefficient for the first natural mode of
the structure.
PF1: the mode collaboration coefficient for the first natural
mode of the structure.
φ φ =
∑
∑
= = N 1 i il 2 i N 1 i il i 1 g / ) W ( g / ) W (PF (3)
φ φ = α
∑
∑
∑
− − = N 1 i il 2 i N 1 i i 2 N 1 i il i 1 g / ) W ( g / W g / ) W ( (4)Wi/g: mass of the first mode in ith level.
Φi1: the value of first mode shape in the ith level.
N: the total storey of the building. i: the storey number building.
In this article the capacity curve is drawn by the vertical force of the earthquake versus the vertical displacement of the structure's center. Thus, the base shear force is transformed to the vertical displacement of the earthquake. The roof displacement is the vertical displacement of the structure's center, that is:
V → → Pvertical (5)
∆roof → → ∆vertical (6)
Each point on the capacity curve with (∆roof,V)
coordination is converted to (∆vertical,Pvertical) and the
corresponding point of (Sa,Sd) can be calculated using the
formulas of next section.
(∆vertical-Pvertical) → → (Sd-Sa) (7)
Concerning the related references to this subject and the accepted calculations in space structures we have:
α1=1 PF1=1 Φroof,1=1
Placing the coefficients and converting the parameters, the formulas in previous section are converted as below:
t ) i ( vertical a W P
S = (8)
vertical d
S =∆ (9)
Pvertical(i): the total applied force of vertical earthquake in
each loading step.
Wt: the summation of the structure's total weight and the
Dead and Live (Snow) forces applied to the structure. ∆vertical: structure's middle vertical displacement due to
total earthquake subjected to the structure.
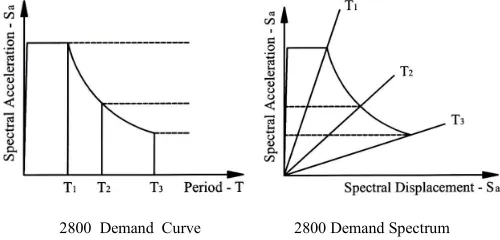
4.2. Converting Demand Spectrum to ADRS Format
Standard response spectrum is drawn by spectrum acceleration (Sa) versus the structure's period and needs to be
converted to the ADRS format. For each point of (T,Sa) on
the standard spectrum, the spectrum displacement of the corresponding point on the demand spectrum in ADRS format is equal to:
a 2 d S 2 T S π
= (10)
(T-Sa) → → (Sd-Sa) (11)
Since there are not international valid codes for space structure based on available references, the 2/3 or 0.667 coefficient in earthquake codes components for frame structures can be used to define the demand spectrum. For this purpose, no changes are made to the horizontal axis components but the vertical components obtain by the code's terms is multiplied by 0.667 and then the result number is shown on the diagram.
2800 Demand Curve 2800 Demand Spectrum
Figure 2. Conversion of Structure's Demand Curve to Capacity Curve in 2800 Code
To convert the earthquake acceleration response spectrum of 2800 standard design into ADRS format, the following formulas can be used:
π + = + = ⇒ ≤ ) ) 2 / T )( T / T ( S 1 ( AIg S )) T / T ( S 1 ( AI g S T T 0 2 0 d 0 a 0
≺ (12)
π + = + = ⇒ ≤ 2 d a S 0 ) 2 / T )( S 1 ( AIg S ) S 1 ( AI g S T T
T ≺ (13)
π + = + = ⇒ ≤ 2 3 / 2 S d 3 / 2 S a S ) 2 / T ( ) T / T )( S 1 ( AIg S ) T / T )( S 1 ( AI g S T
T (14)
4.3. Making a Bilinear Form for Capacity Spectrum
To generate a bilinear form of capacity spectrum, first a straight line with a slope equal to the structure's elastic stiffness is drawn so that passes the origin. The second line is drawn from (dpi,api) point so that crossing the first line at the
point (dpi,api), two approximately equal areas are generated
between these lines and the capacity spectrum.
Figure 3. Bilinear Form for Capacity Spectrum
4.4. Approximating the Equivalent Damping and Equivalent Viscous
When a structure enters the nonlinear region due to earthquake force, its damping can be defined by a combination of natural viscous damping and hysteresis damping. Hysteresis damping is proportional to the area under curve of structure force-displacement curve. This damping can be stated in the equivalent viscosity damping (βeq).
05 . 0
0 eq=β ±
β (15)
β0: the stated hysteresis damping as the equivalent
viscosity damping is 5 percent of the structure's natural viscosity damping and is constant to the end of analysis.
π = β 0 S D 0 E E 4 1 (16)
ED: the amount of energy absorbed.
ES0: the maximum strain energy.
(
y m y pi)
D 4 a d d a
E = ∗ − (17)
2 / d a
ES0= pi m (18)
pi pi pi y pi y 0 d a ) a d d a ( 7 . 63 − =
β (19)
5 d a ) a d d a ( 7 . 63 5 pi pi pi y pi y 0 eq + − = + β =
β (20)
The ideal hysteresis curve (parallelogram) is an acceptable estimation of the actual hysteresis curve of a flexible building that has been affected by the relatively short term earthquakes and has an equivalent viscosity damping less than 30 percent. For other conditions the ideal hysteresis curve results in over estimations for equivalent viscosity damping. This is because of that the actual hysteresis loops are practically incomplete due to phenomena such as buckling, fatigue, resistance drop or stiffness. The confined areas by these loops decrease in consequent cycles. By applying the concept of effective viscosity damping, we use damping modification factor (K) to enable damping coefficients (β) for simulating the incomplete hysteresis loops. 5 d a ) a d d a ( 7 . 63 k 5 K pi pi pi y pi y 0 eff + − = + β =
β (21)
K: the modification factor that is used for converting equivalent viscosity damping in the ideal hysteresis curve to the corresponding equivalent viscosity damping in actual hysteresis curve.
K factor depends on the structure's actual behavior which in turn depends on quality of building lateral resistant system and the duration of earthquake. Three different type of structure behavior is concerned in ATC40 code:
Structure behavior type A: Indicates stable hysteresis loops. In this behavior the hysteresis loops are stable in all cycle and are very similar to ideal shape (parallelogram).
Structure behavior type B: Indicates relatively incomplete hysteresis loops. In this behavior the average area of hysteresis loops decrease.
Structure behavior type C: Indicates incomplete hysteresis loops. In this behavior involves significant decrease in the loops area in the consequent cycles.
Base on the above descriptions, the space structures behavior belongs to type B.
Table 1. Modification Coefficients of Structural Behavior
Structure Behavior Type
0 β K A % 25 . 16 % 25 . 16 ≻ ≤ 0 008 . 0 130 . 1 00 . 1 β − B % 25 % 25 ≻ ≤ 0 007 . 0 845 . 0 67 . 0 β − C Other 0.33
4.5. Reduction of Demand Spectrum of 5% Damping
We consider βeff as the effective viscous damping
equivalent to the energy dissipation due to 5% structure's natural viscous damping and permanent plastic deformations (hysteretic deformations) up to the performance point. Therefore, the design elastic spectrum of 5% damping is decreased to the demand spectrum corresponding to βeff
damping. According to ATC40 bylaw, these portions are specified by SRA and SRV factors respectively which are
min A eff
A (SR )
12 . 2
) ( Ln 68 . 0 21 . 3
SR = − β ≥ (22)
min V eff
V (SR )
65 . 1
) ( Ln 41 . 0 31 . 2
SR = − β ≥ (23)
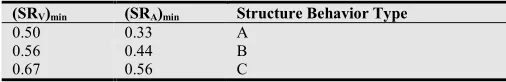
(SRA)min and (SRV)min, the minimum permissible values of
spectrum decrement factor, are:
Table 2. Permissible Values of Spectrum Decrement Factors
Structure Behavior Type (SRA)min
(SRV)min
A 0.33
0.50
B 0.44
0.56
C 0.56
0.67
In most of space structures the spectrum reduction factors in both cases is more than 1 or so close to 1. Therefore, it can be concluded that spectrum reduction for most of space structures is not necessary and the crossing point of the demand spectrum and the capacity spectrum is the structure's performance point.
4.6. Standard Design Spectrum of Decreased New 2800 Standard in ADRS Format
If the space reduction factors are less than 1, it is necessary to apply damping effects on the structure. Based on the spectrum reduction factors SRA and SRV, the standard
reduced design spectrum of Iran 2800 code is equal to:
≥ ⇒ ⇒ × =
S V
S A
a a
T T SR
T T SR S
S ≺ (24)
Based on Euro code 8, in absence of precise studies in a region, the horizontal response spectrum and the horizontal earth acceleration are multiplied by 2/3 or 0.667 to calculate the corresponding vertical values.
4.7. Determination of Structure Performance Point
The most basic method to determine performance point position is to assume a performance point on the capacity spectrum. The structure's hypothetical βeff is calculated based
on the effective viscosity damping of the structure's natural viscosity. Then SRV and SRA are obtained. Finally the 5%
damping elastic demand spectrum is reduced. This hypothetical point is the performance point if in an acceptable tolerance is passed by the reduced demand spectrum. If the spectrum acceleration on reduced demand spectrum is less than the spectrum acceleration on capacity spectrum, for spectral displacement of the hypothetical performance point, then the demand is more than the capacity of the structure. Therefore, the spectral displacement has not reached to its maximum level. For another try a performance point with a spectral displacement less than the previous assumed spectral displacement is chosen. This try and error is repeated until the reduced demand spectrum affected by the effecting viscosity damping of the hypothetical performance point passes the hypothetical performance point by an acceptable tolerance. In this case hypothetical performance
point is the actual performance point of the structure. If the crossing point of the demand spectrum and the capacity spectrum is placed in the linear region of the spectrum, the displacement indicates the actual displacement of the structure. The acceptable tolerance of the performance point based on ATC40 code is 5%. It means that if the differences between the primary assumed point in the first steps with the crossing point is less than 5%, then obtained point is the structure performance point. Elsewhere try and error is continuously repeated. [3, 4, 6, 7, 8, 12, 13, 14, 15]
5. Different Levels of Structure
Performance
To define the structure's performance, it is necessary to determine the allowable amount of damage caused by the earthquake level. The building behavior level is a combination of the behavior level of structural elements (beam, column, etc.) and non-structural elements (partition wall, interior finishing, windows, glasses and …). According to this, a number of major performance levels are defined in FEMA and ATC40 codes:
1. Performance level of Immediate Occupancy (continuous use) (IO)
2. Life Safety Performance Level (LS)
3. Structural Stability Performance Level or Collapse Prevention (CP)
In seismic retrofitting of existing buildings code in Iran, Performance Levels are classified as below:
1. Continuous Service Performance Level (A-1) 2. Continuous Usability Performance Level (B-1) 3. Life Safety Performance Level (C-3)
4. Collapse Threshold Performance Level (E-5)
6. Acceptance Criteria in the Life Safety
Performance Level
Two quantities are controlled to evaluate life safety performance level of the structures:
A) Plastic Deformation (resistance and flexibility control to study structural damages)
B) Story's Displacement (stiffness control to evaluate non-structural damages)
Allowed values for mentioned quantities are defined for steel and concrete structures and generally for all frame structures as boundaries of different performance levels in FEMA273 and ATC40 codes. In space structure, there is not a valid international code for desired problems. Thus, we cannot refer to any source for boundaries of different performance levels to be comparing the performance points with. In this paper, we have used a series of suggested definitions, some of which are extracted from international codes and some are used by changes in their application.
1. Displacement between 0 to 1/300 of span's length as non-stop use boundary
first plastic hinge as life safety boundary
3. From the first plastic hinge to 0.02 span's length as collapse threshold boundary
4. From 0.02 span's length afterwards as collapse boundary Displacement for non-stop use
boundary is: 300
L 0≤∆ver≺
Displacement for life safety
boundary is: L300≤∆ver≺∆P1
Displacement for collapse threshold
boundary is: ∆P1≤∆ver≺0.02L
Displacement for collapse
boundary is: 0.02L≤∆ver
L: structure's total length.
∆ver: maximum vertical displacement of structure's middle
subjected to vertical earthquake load.
∆PI: first vertical displacement of plastic hinge subjected to
vertical earthquake load. [13, 14, 15]
7. Examination of Studied Samples
The analyzed models are single layer grid structure that plane elements shape of which are square (Shape A & B) or square-diagonal (Shape C & D). The length of every square members are assumed 1 meter. All connections are supposed rigid to maintain the stability structures.
In order to transmit the roof forces into foundation of structure, 2 kinds of supports are used which are actually the connection of column and roof.
Considering two 1 meter consul at each side, the total length of structure is supposed between 10 to 15 meters. The reason of selecting these spans is that single layer plane structures are usually used in structures with 10 to 15 meters span length and it is also economically reasonable. Since it is important in space structures to maintain their stability, all the connections in these structures are assumed to be rigid. Also, pipe shaped sections are used in these structures.
However the applied loads subjected to the space structures studied in this paper are:
Figure 4. Shape (A)
Figure 5. Shape (B)
Figure 6. Shape (C)
Figure 7. Shape (D)
7.1. Dead Loads
Surface unit weight of dead load for these structures is 50 kilograms per square meter and for applying it to the structure it should be converted to point load.
7.2. Live Loads
Since this type of structures is usually without roof or has a light non-structural coverage, the only live load subjected to these structures is snow load. Its load amount is extracted from the code according to the type of structure and place of project. In this paper live load (snow load) is assumed uniform and equal to 150 kilograms per square meter which should be applied to the structure as pint load in nodes.
7.3. Vertical Earthquake Load
This load is obtained by product of a coefficient by the structure's weight. It is applied to the structure locally in the structure's nodes. In this paper the structure's weight is assumed as the summation of dead loads and total live load.
After analysis, designing and optimizing the structures using SAP2000, we can have the following results to use in ANSYS software:
1. Structure's total weight
2. Structure's different sections specifications
structure in ANSYS software, we take none linear static analysis. In ANSYS software, three node BEAM189 elements are used for modeling the structures.
These elements have the rigidity condition of structure's connection elements. This analysis may be ended in one of these two ways:
1. Repeat the force increment until first point of destruction or instability of the structure.
2. Repeat the force increment until a point with specific condition.
In this paper we use the first way (point of destruction or instability of the structure) because collapse point or destruction point of the structure must be determined and we should find the maximum vertical displacement of the structure.
In this section, the diagrams and calculation steps for determining the performance point of a single-layer structure of size 10*10 meters is presented for instance. Since the parameters such as A (design base acceleration), I (structure importance factor), S (depends on the soil and condition of the region) are very important in determination of Sa, these
parameters are assumed to be constant in all of the models. In this manner, the response of structure analysis is only depends on the structure itself. In below diagrams, the process of determining the performance point is presented. It is assumed that A=0.3, I=1.2 and region type=2)
Figure 8. Capacity Curve–Vertical Load
Figure 9. Sd–Sa/g for Capacity Spectrum
Figure 10. Sd–Sa/g for 2800 Spectrum
We hold the process for all considered structures with length of 10 to 15 meters and finally we find their performance points after drawing the needed diagrams.
Figure 11. Sd–Sa/g for ADRS format
8. Discussion and Conclusion
Using the curves and the results of single layer plane space structure analyses, it can be concluded that the performance point in spans of about 15 meters are placed in life safety level and in small spans are placed in immediate occupancy level. In these structures, Sd is increased slightly by
increasing the span length.
Figure 12. Performance point for shape (A, B)
0.0 0.5 1.0 1.5 2.0 2.5
0 2 4 6 8 10 12 14 16 18 20
Sd
Spectrum 2800 Reduced Curve 2800 2 Line Curve Capacity Spectrum 2800 Spectrum
0.0 0.1 0.2 0.3 0.4 0.5 0.6 0.7
0 20 40 60 80 100 120 140 160 180 Sd
Capacity
0.0 0.2 0.4 0.6 0.8 1.0 1.2 1.4 1.6 1.8 2.0 2.2
0 1 2 3 4 5 6 7 8 9 10 11 12 13 14
Sd
Capacity Curve
0 5000 10000 15000 20000 25000 30000 35000 40000 45000 50000
0 1 2 3 4 5 6 7 8 9 10 11 12 1 3
Figure 13. Performance point for shape (C, D)
Single supports in structure with square elements can perform better and stronger than in quadrate supports shape.
In structure with square-diagonal elements, excluding 10 and 15 meters spans, structure with single supports can perform better and stronger than structure with quadrate supports.
It seems that the performance can be better with fewer and smaller supports in single layer plane structure applying this type of connection and short length of spans.
References
[1] H. Nooshin, “Space Structure and Configuration Processing,” Structural Engineering and Material, Vol. 1, No. 3, pp. 329-336, 1998.
[2] H. Nooshin, Z.S. Makowski, “Some Aspects of the Behavior of Square Diagonal Grids,” International Journal of Building Science, pp. 267-275, Des 1974.
[3] M. Layegh Rafat, D. Layegh Rafat, M. Ghalehnovi, “The Examination of Performance Level of Barrel Vaults Space Structure by Capacity Spectrum Method,” 1st International Conference on Seismic Retrofitting, Iran, Tabriz, 2008.
[4] P. Faifar, “Capacity spectrum method based on inelastic demand spectra,” Earthquake engineering and structural dynamics, Vol. 28, pp. 979-993, 1999.
[5] A.K. Chopra, R.K. Goel, “A model pushover procedure to estimate seismic demands for building,” Report No. PEER-2001/03, 1999.
[6] R.B. Malla, L. Serret, “Double Layer Grids: Review of Static and Thermal Analysis Methods,” Journal of Structure Engineering, Vol. 122, NO. 8, 1996.
[7] R.B. Malla, L. Serret, “Double Layer Grids: Review of Dynamic Analysis Methods,” Journal of Structure Engineering, Vol. 122, NO. 8, 1996.
[8] H.A. Moghaddam, “Seismic Behavior of Space Structure,” International Journal of Space Structure, Vol. 15, No. 2, pp. 119-134, 2000.
[9] Sh. Malek, S.M. Ardakani, “Study Seismic Behavior of Double Layer Barrel Vaults Space Structure,” 1st International Conference on Seismic Retrofitting, Iran, Tabriz, 2008. [10] R. Kamali Salehabad, E. Salajegheh, “The Provision of Vertical
Reflection Spectrum and Usage of them for Space Structure,” 2nd National Conference on Spatial Structure, Iran, Tehran, 2007.
[11] G. Victor, “Instability Problems in Space Structure,” Elsevier Applied Science Publisher, Vol. 7, No. 4, pp. 321-331, 1985. [12] “Euro Code8: Design Provision for Earthquake Resistance of
Structure – Part 1-1: General Rules-Seismic Action and General Requirements for Structure,” European Committee for Standardization (CEN), 2002.
[13] FEMA273 (Federal Emergency Management Agency), Washington D.C, USA, Oct 1997.
[14] ATC40 (Applied Technology Council), Redwood City, California, USA, Nov 1996.