*Corresponding author. Shruti Sethi is a research scholar at the Department of Commerce, Delhi School of Economics, University of Delhi, India, email: shrutisethi0906@gmail.com. **Dr. Vanita Tripathi is an assistant professor in the field of finance at the Department of Commerce, Delhi School of Economics, University of Delhi, India, e-mail: vanitatripathi1 @yahoo.co.in.
The authors are thankful to two anonymous reviewers for their useful suggestions and guidance.
Integration of Indian Stock Market with
Major Global Stock Markets
Vanita Tripathi** and Shruti Sethi*
Abstract
This paper examines the integration of the Indian stock market with the stock markets of Japan, the United Kingdom, the United States and China over the period ranging from 1 January 1998 to 31October 2008 using Johansen and Engle-Granger co-integration tests and Granger’s causality test. The analysis of daily data shows that the Indian stock market is integrated with the US stock market, but not with that of Japan, the UK and China. Unidirectional causality is found in most cases. The findings have important implications for investment and speculative decisions.
Keywords: Engle–Granger Co-integration Test, Financial Integration, Investment Decision,Johansen Co-integration Test, Portfolio Diversification, Stock Market Integration
JEL classification: G10, G11, G14, G15, G19
1. Introduction
Stock market integration has crucial implications for investment decisions, the macroeconomic policies of a country and efficiency of the markets. The modern portfolio theory, propounded by Markowitz (1952), states that the benefits of diversification of portfolio can be reaped when the return on assets in which the funds are invested have low correlation. If two (2) stock markets have low correlation, making investment in them can lead to reduction of the systematic risk of the portfolio. In 1960’s and 1970’s, there were international barriers to trade and capital flows. During these two (2) decades, Hilliard (1979), and Grubel and Fadner (1971) found that the stock markets had low correlation. Therefore, in that time, it was a profitable proposition to diversify the portfolio across different countries. Over time, as economies opened up, and became more liberalised, integration of global economies becomes unavoidable (Bekaert, Harvey, & Lumsdaine, 2002). Thus, it is important to study whether there is a change in the relationship of the Indian stock market with the other major global markets. If integration exists, the strategy of diversifying one’s portfolio may no longer apply.
Further, the liberalisation of the economies may lead to increased integration among stock markets which have an effect on the macroeconomic policies of a nation as well. It therefore, becomes imperative to look at the impact of such policies as they influence the foreign exchange reserves and the exchange rate which in turn affects the foreign trade and the balance of payment position of an economy. As an economy is vulnerable to the external shocks and crisis, the knowledge of this area of finance can equip the policy makers to make better decisions.
Another critical area is the efficiency of the markets. If the markets are found to be integrated then the speed with which the information in one (1) market is absorbed as compared to the others, determines the informational efficiency of the market. Eun and Shim (1989) found that the dynamic response pattern of the stock markets is consistent with the notion of informational efficiency.
Factors leading to the integration of the stock markets have also been empirically tested by researchers. Janakiramanan and Lamba (1998), for example, report that the presence of a dominant economy, common investor group in the stock markets and multiple stock listings are some of the explanations for increased inter-linkages among the stock markets. Pretorious (2002) divides the possible reasons for the stock market integration into three (3): contagion effect; economic integration; and stock market characteristics.
the trade relationship and the co-movement of the economic indicators of the economies that impact the stock market returns. Higher level of economic integration between two (2) economies may lead to the integration of their stock markets as well. The third reason is the stock market characteristics, namely, market size, volatility and industry similarity. Market size reflects the stage of development of the stock market: the higher the market size differential between the two (2) stock markets, the lower is the co-movement of the stock markets. Volatility is the measure of risk: higher volatility indicates higher expected return. To the extent that the volatilities of the two (2) stock markets converge so will the stock prices. Industry similarity applies where two (2) stock markets have similar industrial composition, leading to co-movement of the stock markets.
Financial integration has been defined differently by various researchers. Kearney and Lucey (2004), for example, report that there are three (3) approaches for defining international market integration: equalisation of the rates of returns; international capital market completeness; and sourcing the domestic investment. The first approach is the direct approach which is based on the law of one (1) price; that is financial assets which have the same risk characteristic should command similar return under the condition of unrestricted international capital flows.
The indirect approaches are the international capital market completeness approach and sourcing the domestic investment approach. According to Stockman (1988, as cited in Kearney & Lucey, 2004), there is international capital market completeness only when there exists a complete set of international financial markets that allows economic and financial market participants to insure against the full set of anticipated states of nature. Only then, the financial integration is said to be perfect. The third approach is to source the domestic investment proposed by Feldstein and Horioka (1980, as cited in Kearney & Lucey, 2004). A small country in the world financial market can finance the exogenous changes in the national savings from abroad without a change in real interest rate.
The present study examines the integration of the Indian stock market with the major global stock markets. This study is based on the aforementioned direct approach that uses the law of one (1) price to define the financial integration. The operational definition of financial integration is the unification of the various financial markets leading to convergence of risk adjusted returns (Reserve Bank of India, 2007).
Consequently, it gradually opened the economy to the outside world. The rules relating to Foreign Direct Investment (FDI) and Foreign Portfolio Investment (FPI) were relaxed in a phased manner inviting the much needed foreign capital. At the same time the approach was cautious so as to protect the economy from any contagion effect of an outside crisis. This approach was successful as it protected India from the repercussions of the South East Asian financial crisis in the late 1990’s. In fact, the Indian economy has moved from the era of financial repression to prudential regulation.
The major steps taken to reform the stock markets included the setting up of the National Stock Exchange (NSE), the dematerialisation of the securities, the banning of the badla transaction and the introduction of derivative trading (options and futures for both index and stock). The stock market in India has seen rapid transformation as a consequence of these reforms, which are still being carried out on a continuous basis. Further, it has become an important avenue for investment by the Foreign Institutional Investors (FIIs) who were allowed to enter India since 1993. The number of FIIs registered with the Securities and Exchange Board of India (SEBI) has increased from four hundred eighty nine (489) as at 1 January 2003 to one thousand seven hundred thirty (1,730) as at 21 September 2010.1
As discussed earlier, the main factors which cause stock market integration are bilateral trade relations, interest rate differential, inflation differential, and stock market characteristics like size and volatility. In 2007, the USA was ranked first in terms of market capitalisation, China was second and Japan occupied the third position. Further, they appeared in the list of top ten (10) trading partners of India. According to the economic survey 2008-9, the USA was the most important trading partner with 10.1 per cent share in total trade in 2007-8, followed by China with 9.2 per cent share. The UK and Japan occupied the 7th and 8th positions respectively. Moreover, in terms of the capital inflows, the USA, the UK and Japan are the major sources for FDI equity inflows. Given their economic linkages with India, examining the Indian stock market integration with the stock markets of these countries is pertinent not only for the purpose of policy making but it is also in the interest of the international investors.
Thus, this paper examines the integration of the Indian stock market with the stock markets of the USA, the UK, Japan and China which have large market capitalisation and enjoy bilateral trade relations with India. This study comprises five (5) sections including this introduction. Section two narrates the review of literature, followed by this study’s research objectives, data and methodology. Section four of this study examines the
empirical results and section five summarises and presents the concluding remarks.
2. Literature review
The research in the area of integration among world stock markets began in 1968 with Grubel’s seminal paper (1968). It was followed by Agmon (1972), Hilliard (1979), Becker, Finnerty, and Gupta (1990) and Hamao, Masulis, and Ng (1990), to name a few. Their work focused on the correlation among the then developed markets, namely, the USA, the UK, Germany and Japan. The objective initially was to ascertain whether international diversification of portfolio would be beneficial or not. The results broadly indicated that the markets did have some integration but the correlation was low. Developments in stock markets led to more research in this area using more sophisticated techniques of analysis. Not only the correlation and co-movement were studied but also the focus was expanded to the structure of the inter-linkages (Eun & Shim, 1989).
The USA was found to be the most influential stock market (Hamao et al., 1990; Becker et al., 1990; Liu, Pan, & Shieh, 1998; Eun & Shim, 1989). Ammer and Mei (1996) attempted to develop the framework for measuring the real and financial integration. They found that there was a lag in international transmission of economic shocks.
Research was also conducted to see the impact of financial and other crises on the financial integration. Arshanapalli, Doukas, and Lang (1995) and Liu et al. (1998) discovered an increase in the degree of integration among the stock markets after the 1987 crash. A decade later, Janor, Ali, and Shaharudin (2007) concluded that the 1997 crisis had an impact on the regional and global integration of the five (5) major ASEAN2 nations. Several researchers (see Arshanapalli et al., 1995; Liu et al., 1998; Lee, 2004; Bose & Mukherjee, 2006; Click & Plummer, 2005; Janor et al., 2007) studied integration among various Asian emerging stock markets and with those of the developed markets. Results broadly indicated that the Asian markets were regionally integrated. Click and Plummer (2005) observed that although the original five (5) ASEAN nations, namely, Malaysia, Singapore, Thailand, the Philippines and Indonesia, were co-integrated in the economic sense, the integration was far from being complete. These findings were not affected by the frequency of the data, the currency denomination and the lag lengths chosen. Janor et al. (2007) studied the equity market integration among the said five (5) ASEAN countries
vis the USA and Japan markets. Their results evidenced towards the regional integration across some of the countries, but they were not consistent between the full sample and the two (2) sub periods (pre and post 1997 South East Asian crisis) indicating that the crisis had an impact on the integration structure. Compared to the USA, Japan had a relatively greater influence on these ASEAN markets, especially in the post crisis period. Further, they established that the exchange rate did have an impact on the integration.
Mixed evidence is found for the integration of the Indian stock market with the developed nations. Wong, Agarwal, and Du (2005) using weekly data found that the Indian stock market was integrated with the USA, the UK and Japan for the post liberalisation period. On the contrary, Nath and Verma (2003) found there was no co-integration between the Indian stock market with those of Taiwan and Singapore. Mukherjee and Mishra (2005) using daily data also reported that the Indian stock market was not integrated with the above mentioned developed nations.
Similarly, other researches on the integration of the Indian stock market with that of the emerging markets also provided confusing or mixed results. Mukherjee and Mishra (2005) discovered that the Indian stock market was integrated with the emerging Asian markets of Indonesia, Malaysia, Philippines, Korea and Thailand. However, Bose and Mukherjee (2006) could not prove the integration of the Indian stock market with that of the seven (7) Asian markets (Japan, Hong Kong, Malaysia, South Korea, Singapore, Taiwan and Thailand) and the USA. They applied the Johansen co-integration test on the Asian group of countries including India and excluding India. By including India, one (1) co-integrating equation was found and when India was excluded, no co-integration was found indicating that the Indian stock market plays a unique role in the integration of Asian markets.
3. Research objectives, data and methodology
This study has two (2) main objectives:
1) To examine whether the Indian stock market is integrated, i.e. to determine whether there is a statistically significant relationship (integration) between the Indian stock market and four (4) major global stock markets, namely, China, the USA, the UK and Japan.
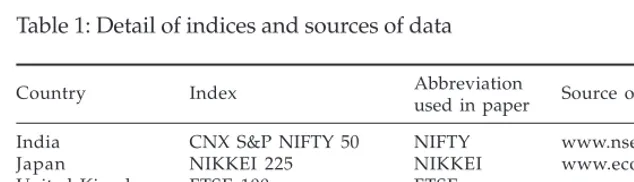
Daily closing index values of the six (6) leading indices of the five (5) stock markets, namely, India, the USA, the UK, Japan and China for the period ranging from the 1 January 1998 to the 31 October 2008 were analysed. Dates from earlier years were not taken into consideration as the reformation was initiated only in the year 1991 and its impact could only be felt a few years later.3 The dates for which the data for any market(s) were not available were excluded. The total number of observations is two thousand two hundred seventy three (2,273). The log of the closing index values was taken to smoothen out the fluctuations in the data before the return was calculated. The details regarding the selected indices and the source of the data are summarised in Table 1.
Table 1: Detail of indices and sources of data
Country Index Abbreviation Source of data
used in paper
India CNX S&P NIFTY 50 NIFTY www.nseindia.com
Japan NIKKEI 225 NIKKEI www.econstats.com
United Kingdom FTSE 100 FTSE www.econstats.com
China SSE Composite SSE www.econstats.com
United States S&P 500 S&P 500 www.econstats.com
United States DJIA DJIA www.econstats.com
Correlation analysis was used for short term linkages and Granger Causality test was employed for finding the cause and effect relationship among stock markets. To examine the existence of long run relationship between the markets, two (2) co-integration techniques, namely, Engle-Granger test and Johansen co-integration test were used. Most of the previous studies have also used the above mentioned techniques (Arshanapalli et al., 1995; Wong et al., 2005; Click & Plummer, 2005; Bose & Mukherjee, 2006; Janor et al., 2007).
Prior researches have been conducted on the integration of the Indian stock market. Integration of the stock markets is a time varying concept (Bekaert et al., 2002). Thus, longitudinal studies should be undertaken. This research contributes to the literature as follows: it analyses the data of the past decade when two (2) crises happened in 2001and 2007-8. Daily data is used for the analysis. Further, this study includes an analysis of the relationship between the Indian stock market with the Chinese stock market. Moreover, this study adopted two (2) co-integration techniques: Engle-Granger test and the Johansen co-integration test. Both techniques produced similar results; thus indicating the robustness of the findings.
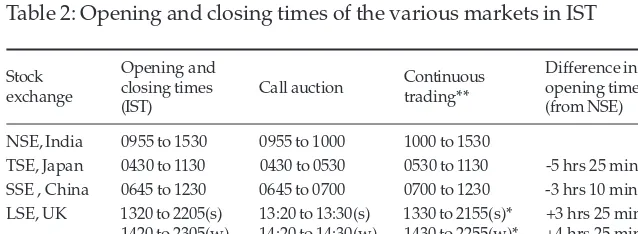
The markets taken into consideration are geographically spread out and hence, there are differences in the time zones. For analysing the relationship among markets it is imperative to convert the opening and closing times into a common time zone. Since the objective of this study revolves around the Indian stock market, the opening and closing times were converted into the Indian Standard Time (IST i.e. GMT + 5.5).
Table 2 presents the opening and closing times of the leading stock exchange of each country. For the purpose of this study, the National Stock Exchange (NSE) for India, the Tokyo Stock Exchange (TSE) for Japan, the Shanghai Stock Exchange (SSE) for China, the New York Stock Exchange (NYSE) for the USA and the London Stock Exchange (LSE) for the UK were selected.
Table 2: Opening and closing times of the various markets in IST
Stock Opening and Continuous Difference in
exchange closing times Call auction trading** opening times
(IST) (from NSE)
NSE, India 0955 to 1530 0955 to 1000 1000 to 1530
TSE, Japan 0430 to 1130 0430 to 0530 0530 to 1130 -5 hrs 25 minutes SSE , China 0645 to 1230 0645 to 0700 0700 to 1230 -3 hrs 10 minutes LSE, UK 1320 to 2205(s) 13:20 to 13:30(s) 1330 to 2155(s)* +3 hrs 25 minutes
1420 to 2305(w) 14:20 to 14:30(w) 1430 to 2255(w)* +4 hrs 25 minutes NYSE, US 1900 to 0130 (s) ________ 1900 to 0130 (s) +9 hrs 45 minutes 2000 to 0230(w) 2000 to 0230(w) +10 hrs 45 minutes
Notes: + indicates opens after NSE; - indicates opens before NSE; (s) indicates summer; (w) indicates winter
NYSE is a continuous market, whereas TSE, NSE, SSE and LSE use a combination of call auction and continuous trading system. TSE starts accepting orders at 8 a.m. (Japan time and the opening price is determined and continuous trading starts at 9 a.m.)
To analyse a time series, it is important to check for stationary properties. Granger’s causality test can be applied for a stationary time series only. A time series is said to be (weakly) stationary if its mean and variance are constant over time and the value of the covariance between the two (2) time periods depends only on the distance or gap or lag between the two (2) time periods and not the actual time at which the covariance is computed (Gujrati & Sangeetha, 2007).
To check whether the index series is stationary, the unit root tests, Augmented Dickey Fuller (ADF) Test and the Phillip Perron (PP) Test, are applied. All the series are found to be integrated of order 1 [I (1)]. Phillips and Perron (1988) use nonparametric statistical method to consider the serial correlation in the error terms without adding lagged difference terms. The results of the PP test are similar to those of the ADF test. As the series are found to be integrated of order one (1), Granger causality test can be applied to the stock return series (which is stationary).
A time series Xt Granger-causes another time series Yt if the latter can be predicted with better accuracy by using past values of Xt rather than by not doing so, other information being identical. Testing causal relations between two (2) stationary series ΔXt and ΔYt is based on the following two (2) equations:
Where Δ is the difference operator, Yt-k and Xt-k represent the lagged value of Yt and Xt, µt and υt are disturbance terms assumed to be white noise. The lag length (k = 1, 2, ...., p) have been chosen arbitrarily with a maximum of six (6) lags. The null hypothesis that Xt does not Granger-cause Yt is not accepted if the βk’s (k>0) are significantly different from zero using standard F test (the statistic is for the joint hypothesis β1= β2 =...= βk = 0). Similarly, Yt Granger-causes Xt if the Φk’s, k>0, are jointly different from zero (0).
Now, if the residual series of this regression is subject to unit root test and the results show that it is stationary i.e. [I (0)], it means that Xt and Yt are integrated. Economically speaking, the two (2) variables will be co-integrated if they have a long-term or equilibrium relationship between them. Although Xt and Yt are individually I (1), that is, they have stochastic trends, their linear combination is I (0). Therefore, the linear combination cancels out the stochastic trends in the two (2) series. To perform the co-integration analysis, the index for the Indian Stock Exchange, NIFTY, is regressed on other indices (taking one at a time) and ADF and PP tests are applied on the residual series.
In addition to the Engle-Granger test, the existing related literature in this area also extensively uses the Johansen co-integration test (Arshanapalli et al., 1995; Wong et al., 2005; Click & Plummer, 2005; Bose & Mukherjee, 2006) which is a likelihood ratio test for the co-integration and specifies the number of co-integrating relationships.
4. Empirical results
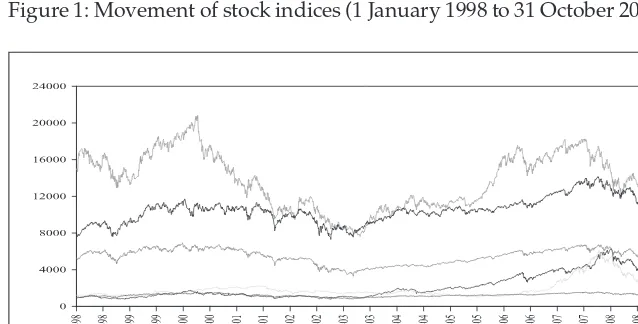
A graphical presentation of the indices values over the period of the study is given in Figure 1. It can be seen that the indices are broadly moving together.
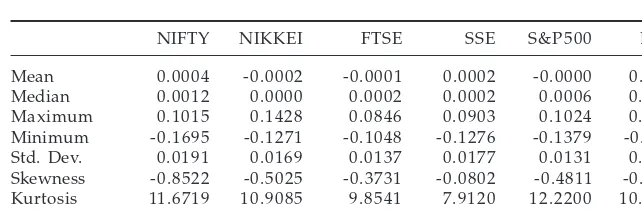
Table 3 gives the summary statistics of the index returns of all the indices. It can be observed that the NIKKEI, FTSE and S&P500 indices have provided negative daily average returns while NIFTY, SSE and DJIA have provided positive average daily returns during the study period.
Table 3: Summary statistics of the daily returns
NIFTY NIKKEI FTSE SSE S&P500 DJIA
Mean 0.0004 -0.0002 -0.0001 0.0002 -0.0000 0.0001
Median 0.0012 0.0000 0.0002 0.0002 0.0006 0.0004
Maximum 0.1015 0.1428 0.0846 0.0903 0.1024 0.1033
Minimum -0.1695 -0.1271 -0.1048 -0.1276 -0.1379 -0.1126
Std. Dev. 0.0191 0.0169 0.0137 0.0177 0.0131 0.0127
Skewness -0.8522 -0.5025 -0.3731 -0.0802 -0.4811 -0.2963
Kurtosis 11.6719 10.9085 9.8541 7.9120 12.2200 10.8452
Observations 2272 2272 2272 2272 2272 2272
4.1 Results of correlation analysis
Table 4 (Karl Pearson’s correlation among various indices) tabulates the cross correlation matrix showing the correlation coefficient between NIFTY and other indices. NIFTY is highly correlated with DJIA with the correlation coefficient equal to 0.82 indicating towards a strong relationship between the two (2) indices. The least correlation of NIFTY is found with NIKKEI (r = 0.34). SSE, S&P500 and FTSE lie in between in the given order.
Table 4: Karl Pearson’s correlation among various indices
NIFTY NIKKEI FTSE SSE S&P500 DJIA
NIFTY 1.0000 0.3431* 0.3580* 0.6377* 0.5836* 0.8234*
Note: * Significant at 1% level
4.2 Results of co-integration analysis
have a long run equilibrium relationship among them and they are co-trending.
The two (2) unit root tests, the Augmented Dickey Fuller test and the Phillip Perron test, were applied on the residual series generated by regressing NIFTY on other indices (taking one at a time) till six (6) lags. Tables 5a and 5b represent Panels A and B showing the ADF test statistics and PP test statistics respectively.
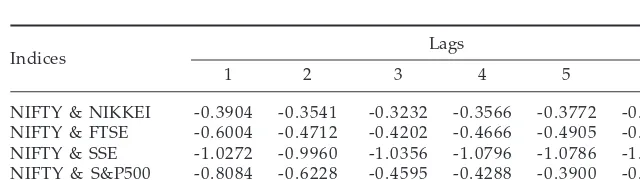
Table 5a: Panel A: ADF test statistics for the residual series
Indices Lags
1 2 3 4 5 6
NIFTY & NIKKEI -0.3904 -0.3541 -0.3232 -0.3566 -0.3772 -0.3225 NIFTY & FTSE -0.6004 -0.4712 -0.4202 -0.4666 -0.4905 -0.4059
NIFTY & SSE -1.0272 -0.9960 -1.0356 -1.0796 -1.0786 -1.0329
NIFTY & S&P500 -0.8084 -0.6228 -0.4595 -0.4288 -0.3900 -0.1938 NIFTY & DJIA -2.8087* -2.5668* -2.4727 -2.5290 -2.4222 -2.1628
Table 5b: Panel B: PP test statistics for the residual series
Indices Lags
1 2 3 4 5 6
NIFTY & NIKKEI -0.4043 -0.3809 -0.3537 -0.3394 -0.3292 -0.3127 NIFTY & FTSE -0.6296 -0.5736 -0.5266 -0.5132 -0.5061 -0.4861
NIFTY & SSE -1.0187 -1.0079 -1.0118 -1.0220 -1.0266 -1.0262
NIFTY & S&P500 -0.8966 -0.7993 -0.7114 -0.6586 -0.6203 -0.5623 NIFTY & DJIA -2.8948** -2.7825* -2.7075* -2.6702* -2.6387* -2.5840*
Notes: *: Significant at 1% **: Significant at 5%
The hypothesis which posits that the residual series is non stationary is accepted in most cases i.e. NIFTY & NIKKEI, NIFTY & FTSE, NIFTY & SSE and NIFTY & S&P500 at all lags. Hence, it can be inferred that the Indian stock market is not integrated with the other markets and does not have a long run equilibrium relationship with them.
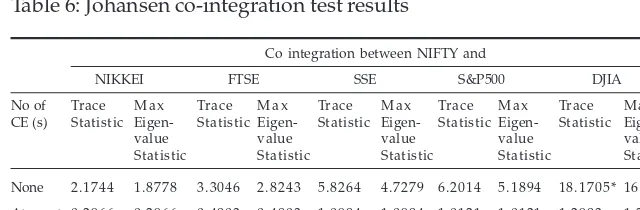
integration is found only till two (2) lags at 10 per cent level of significance. These indicate a weak co-integration between NIFTY and DJIA. The same results are confirmed by the Johansen co-integration test (Table 6). This, therefore, ascertains the robustness of the findings in this study.
NIFTY and DJIA are co-integrated to some extent in the long run and it can be concluded that the Indian stock market has a long run equilibrium relationship, albeit a weak one, with the USA stock market. This can be attributed to the economic and the financial ties India has with the USA which is India’s top trading partner in terms of the share in the total trade (10.1 per cent as per the economic survey 2008-9). An interesting point to mention is that the integration is found with the USA stock market where the time lag between the opening times of the two (2) markets is approximately ten (10) hours. With the other markets in the UK, Japan and China, the time lag is less than five (5) hours. It is possible that this time lag between the timings of the USA stock market and the Indian stock market might have played an important role in the information transmission leading to the integration of the markets. The longer time lag provides the market with more time to absorb the new information.
Table 6: Johansen co-integration test results
Co integration between NIFTY and
NIKKEI FTSE SSE S&P500 DJIA No of Trace M a x Trace M a x Trace M a x Trace M a x Trace M a x CE (s) Statistic Eigen- Statistic Eigen- Statistic Eigen- Statistic Eigen- Statistic
Eigen-value value value value value
Statistic Statistic Statistic Statistic Statistic
None 2.1744 1.8778 3.3046 2.8243 5.8264 4.7279 6.2014 5.1894 18.1705* 16.8721* At most 0.2966 0.2966 0.4803 0.4803 1.0984 1.0984 1.0121 1.0121 1.2983 1.2983 one
Notes: *: 5% level of significance **: 1% level of significance
4.3 Results of Granger causality test
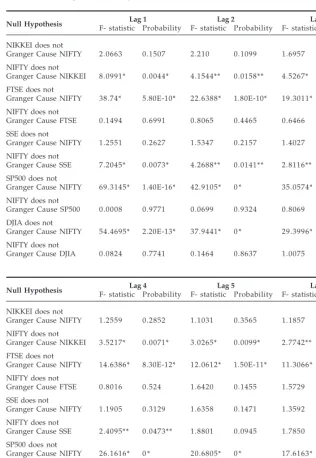
Table 7: Granger causality test results
Null Hypothesis Lag 1 Lag 2 Lag 3
F- statistic Probability F- statistic Probability F- statistic Probability
NIKKEI does not
Granger Cause NIFTY 2.0663 0.1507 2.210 0.1099 1.6957 0.1658 NIFTY does not
Granger Cause NIKKEI 8.0991* 0.0044* 4.1544** 0.0158** 4.5267* 0.0036* FTSE does not
Granger Cause NIFTY 38.74* 5.80E-10* 22.6388* 1.80E-10* 19.3011* 2.30E-12* NIFTY does not
Granger Cause FTSE 0.1494 0.6991 0.8065 0.4465 0.6466 0.5850 SSE does not
Granger Cause NIFTY 1.2551 0.2627 1.5347 0.2157 1.4027 0.2401 NIFTY does not
Granger Cause SSE 7.2045* 0.0073* 4.2688** 0.0141** 2.8116** 0.0380** SP500 does not
Granger Cause NIFTY 69.3145* 1.40E-16* 42.9105* 0 * 35.0574* 0 * NIFTY does not
Granger Cause SP500 0.0008 0.9771 0.0699 0.9324 0.8069 0.4899 DJIA does not
Granger Cause NIFTY 54.4695* 2.20E-13* 37.9441* 0 * 29.3996* 0 * NIFTY does not
Granger Cause DJIA 0.0824 0.7741 0.1464 0.8637 1.0075 0.3883
Null Hypothesis Lag 4F- statistic Probability Lag 5F- statistic Probability Lag 6F- statistic Probability
NIKKEI does not
Granger Cause NIFTY 1.2559 0.2852 1.1031 0.3565 1.1857 0.31082 NIFTY does not
Granger Cause NIKKEI 3.5217* 0.0071* 3.0265* 0.0099* 2.7742** 0.0108** FTSE does not
Granger Cause NIFTY 14.6386* 8.30E-12* 12.0612* 1.50E-11* 11.3066* 1.80E-12* NIFTY does not
Granger Cause FTSE 0.8016 0.524 1.6420 0.1455 1.5729 0.1509 SSE does not
Granger Cause NIFTY 1.1905 0.3129 1.6358 0.1471 1.3592 0.2274 NIFTY does not
Granger Cause SSE 2.4095** 0.0473** 1.8801 0.0945 1.7850 0.0982 SP500 does not
Granger Cause NIFTY 26.1616* 0 * 20.6805* 0 * 17.6163* 0 * NIFTY does not
Granger Cause SP500 1.7721 0.1316 1.875 0.0954 2.4289** 0.0241** DJIA does not
Granger Cause NIFTY 21.8805* 0 * 17.2735* 0 * 14.5769* 2.20E-16* NIFTY does not
Granger Cause DJIA 2.1153 0.0764 2.0434 0.0697 2.6386** 0.0149**
(till 4 lags). These imply that the developments in the Indian stock market do impact the Japanese and Chinese stock markets on the days following the very first day.
FTSE Granger causes NIFTY. S&P500 and DJIA also Granger cause NIFTY. This relationship is converted into bidirectional causality at the sixth (6th) lag for S&P500 and DJIA at 5 per cent level of significance. The strength of causality flowing from the USA to India is stronger than that flowing from India to the USA.
5. Conclusions
This paper examined the integration of the Indian stock market with four (4) other major stock markets in the world, namely, the USA, the UK, Japan and China over the period 1 January 1998 - 31 October 2008 using daily data. The results show that NIFTY movements are highly correlated with DJIA and least with NIKKEI. The Indian stock market is not found to be individually integrated in the long run with any of the markets analysed in this study except for the USA. This could be due to two (2) reasons: increasing economic and financial ties between the USA and India as well as the time lag between the market timings. Unidirectional causality is observed in all cases (FTSE, DJIA and S&P500 Granger cause NIFTY) implying that the developments in the USA and the UK are transmitted to the Indian stock market. Further, the Indian stock market is found to lead the Japanese and Chinese stock market.
The results of this study contradict the earlier findings by Mukherjee and Mishra (2005) and Bose and Mukherjee (2006) which showed that the Indian stock market is not integrated with the US stock market. These results are also in contrast with those of Wong, Agarwal, and Du (2005) which were based on weekly data, and reported that India is integrated with the UK and Japan. Contradiction is also found in the causality results wherein they found that the Japanese market Granger causes the Indian stock market and is not caused by the UK stock market (in our findings India Granger causes Japan and is Granger caused by the UK). This indicates that the integration may be a time varying concept and the results may depend on the frequency of the data used.
portfolio by investing funds in these markets. In the short run, as unidirectional causality is found in all cases, this information can be used for speculative purposes.
Like any other research conducted in this area, the present work is not free from limitations. Firstly, the analysis of this study is done on a local currency basis. Secondly, the present technique used does not allow us to derive any conclusion regarding market efficiency.
In the present study, the focus has been on the Indian stock market and its relationship with other major stock markets. However, to expand this line of research it is recommended to investigate integration with more markets in different regions. To achieve this goal, researchers can also employ more sophisticated statistical techniques such as Error Correction Model (ECM) and Vector Auto Regression (VAR).
References
Agmon, T. (1972). The relations among equity markets: A study of share price co-movements in the United States, United Kingdom, Germany and Japan. The Journal of Finance,27(4), 839-855.
Ammer, J., & Mei, J. (1996). Measuring international economic linkages with stock market data. The Journal of Finance, 51(5), 1743 – 1763. Arshanapalli, B., Doukas, J., & Lang, L. H. P. (1995). Pre and post October
1987 stock market linkages between US and Asian markets. Pacific Basin Finance Journal, 3, 57-73.
Bekaert, G., Harvey, C.R., & Lumsdaine, R. L. (2002). Dating the integration of the world equity markets. Journal of Financial Economics, 65, 203-247.
Becker, K. G., Finnerty, J. E., & Gupta, M. (1990). The intertemporal relation between the US and Japanese stock markets. The Journal of Finance, 45, 1297- 1306.
Bose, S., & Mukherjee, P. (2006). A study of interlinkages between the Indian stock market and some other emerging and developed markets. Paper presented at the 9th Capital Markets Conference, Indian Institute of Capital Markets, Mumbai, India.
Click, R.W., & Plummer M. G. (2005). Stock market integration in ASEAN after the Asian financial crisis. Journal of Asian Economics, 16, 5 –28. Eun, C., & Shim, S. (1989). International transmission of stock market
Gujrati, D. N., & Sangeetha. (2007). Basic econometrics. New Delhi: Tata McGraw Hill.
Grubel, H. (1968). Internationally diversified portfolios: Welfare gains and capital flows. The American Economic Review, 58, 1299- 1314.
Grubel, H., & Fadner, K. (1971). Interdependence of international equity markets. Journal of Finance, 26, 89-94.
Hamao, Y., R., Masulis, & Ng, V. (1990). Correlations in price changes and volatility across international stock markets. Review of Financial Studies, 3, 281-307.
Hilliard, J. (1979). The relationship between equity indices on world exchanges. The Journal of Finance, 34, 103- 114.
Janakiramanan, S., & Lamba, S. A. (1998). An empirical examination of linkages between Pacific-Basin stock markets. Journal of International Financial Markets, Institutions and Money,8, 155-173.
Janor, H., R. Ali, & Shaharudin, R. S. (2007). Financial integration through equity markets and the role of exchange rate: Evidence from ASEAN-5 countries. Asian Academy of Management Journal of Accounting and Finance, 3(1), 77-92.
Kearney, C., & Lucey B. M. (2004). International equity market integration: Theory, evidence and implications. International Review of Financial Analysis, 13, 571-583.
Lee, H.S. (2004). International transmission of stock market movements: A wavelet analysis. Applied Economics Letters, 11, 197-201.
Liu, Y.A., Pan, M. S., & Shieh, J. C. P. (1998). International transmission of stock price movements: Evidence from the U.S. and five Asian Pacific markets. Journal of Economics and Finance, 22, 59-69.
Markowitz, H. (1952). Portfolio selection. Journal of Finance,7, 77- 91. Mukherjee, K., & Mishra, R. K. (2005). Stock market interlinkages: A study
of Indian and world equity markets. Indian Journal of Commerce, 58, 17-42.
Nath, G. C., & Verma, S. (2003). Study of common stochastic trend and cointegration in the emerging markets: A case study of India,
Singapore and Taiwan. NSE Research Paper. Retrieved from
http://www.nseindia.com
Phillips, P. C., & Perron, P. (1988). Testing for a unit root in time series regression. Biometrika,75, 335–346.