Work Value Congruence and Satisfaction
at Work: Is this Western Concept Applicable
to a Developing Country such as Malaysia?
Kamarul Zaman Ahmad*
Abstract
This study aims to fulfil two literature gaps in the person-environment fit theory, in particular the supply-value fit or S-V fit relating to work congruence. Firstly, previous research in S-V fit tended to look mainly at autonomy and supervision style. However, there appears to be no reported research that has simultaneously investigated, in a single study, the effects of the discrepancy between the perceived and desired levels of work quantity, variety, power, responsibility and concentration required for the job and its relationship with satisfaction at work. Secondly, the S-V fit theory has been relatively established in developed countries such as America and Britain. However, it would be interesting to discover whether the theory is also applicable among workers in small isolated towns in a developing country such as Malaysia. Questionnaires were distributed and collected from two hundred and eighty respondents working in small towns in Peninsular Malaysia. Support for the S-V fit theory was obtained, as results suggested that the greater the discrepancy between the supplies and values of work quantity, variety, power, responsibility and concentration required at work, the lesser was the satisfaction. Key Words: Job Satisfaction, Person-Environment Fit, Supply-Value Fit
JEL classification: M12, M51, M54
1. Introduction
Parsons’ (1909) seminal work appears to be the first to have stressed the importance of both person and environment variables in vocational choice. There is an abundance of research that examined the degree of fit between the person and the environment i.e. person-environment fit or P-E fit and how that is associated with satisfaction. Buboltz, Ebberwein, Watkins &
`
Savickas (1995) discovered that in the 20 years preceding their article, a total of 229 articles on P-E fit appeared in the Journal of Vocational Behavior and 75 articles appeared in the Career Development Quarterly. They also noted that, about 63 of the 229 articles on P-E fit in the Journal of Vocational Behavior and 22 out of the 75 in the Career Development Quarterly appeared during the five years preceding their article. In addition, there were other studies involving P-E fit reported in other journals. The concept of P-E fit has been described as, “so pervasive as to be one of, if not the dominant conceptual forces in the field” (Schneider, 2001, p.142). This constitutes evidence that the subject matter of P-E fit has not only been well established and extensively researched, but also remains a current area of interest (Kristof et al 2005).
E fit was summarised by Edwards (1996) as follows: “In essence, P-E fit embodies the premise that attitudes, behaviour and other individual level outcomes result not from the person or environment separately, but rather from the relationship between the two (Lewin, 1951; Murray, 1938; Pervin, 1989)” (p. 292). P-E fit is also of practical importance to managers. The environmental-demands and person-abilities fit underlies most models of personnel selection, in which the generally accepted paradigm is to analyse job demands, define abilities required to meet these demands and hire individuals with the requisite abilities (Schneider, 1978). Osipow (1987) aptly summarises the issues associated with person-environment in the following three main questions: 1) How do we assess people? 2) How do we measure their environment? 3) How do we compare the two regarding degree and quality of fit? Thus the topic of P-E fit warrants further research.
This study has two objectives. The first objective is to examine the degree of fit between the person and the environment and how that is associated with job satisfaction. More precisely, it examines the fit between desired or preferred job characteristics (person) and perceived job characteristics (environment) and how that is associated with job satisfaction. Previous research (cited in the Literature review) examined only autonomy and supervision style as components of the environment. However, there appears to be no reported study that has simultaneously investigated in a single study, the fit between desired and perceived levels of work quantity, variety, power, responsibility and concentration required for the job.
2. Literature Review
A review of the studies of P-E fit revealed that prior to 1987, most studies did not distinguish between the different forms of fit and did not expressly state which category of fit they were investigating. According to Muchinsky & Monahan (1987), who appeared to be the first people to categorise the different forms of fit, there are basically two categories of fit: complementary fit and supplementary fit. They summed up the core difference between the two as follows:
“An essential difference between the complementary and supplementary models is in the definition of the environment. The environment in the supplementary model is described according to the people who inhabit it. In the complementary model, the environment is defined apart from its inhabitants. Instead, it is described according to its demands and requirements, which are discerned, for example, in a work context through a job analysis. A person’s abilities and characteristics are matched to the environment’s (job’s) needs.” (p. 272).
Muchinsky & Monahan (1987) explained that complementary fit, occurs when there is a “match between an individual’s talents and the corresponding needs of the environment” (p. 268). By complementary, they meant that the “characteristics of an individual serve to make whole or complement the characteristics of an environment. The environment is seen as either deficient in, or, requiring a certain type of person in order to be effective” (p. 271). Supplementary fit, on the other hand, was said to exist when “a person fits into some environmental context because he or she supplements or embellishes or possesses characteristics which are similar to other individuals in this environment” (p. 268).
needs, desires or preferences (Kristof 1996). From the D-A fit perspective, organisations demand contributions from their employees in terms of their time, effort, commitment, knowledge, skills and abilities (French et al, 1982; Livingstone et al, 1997). Fit occurs when an individual has the abilities required to meet organisation demands (Kristof, 1996). In short, D-A fit focuses primarily on meeting the needs of others, while S-V fit focuses primarily on meeting one’s own needs (Caplan, 1987; Livingstone et al, 1997). Figure 1 taken from Kristof (1996) represents the relationship between S-V and D-A fit.
Figure 1: Various Conceptualisations of Person - Organisation Fit
It can be seen from Figure 1 that S-V and D-A fit are entirely different constructs. Previous researchers are often confused between S-V and D-A fit (Edwards & Cooper, 1990; Livingstone et al, 1997). It is important to distinguish between them because in addition to their nature, they have also been shown to have different outcomes (Livingstone et al, 1997). S-V fit has been found to be related to dissatisfaction (Locke, 1969, 1976; Livingstone et al, 1997) whereas D-A fit has been found to be related to performance (Hackman & Oldham, 1980; Naylor, Pritchard & Ilgen, 1980; Porter & Lawler, 1968; Livingstone et al, 1997). The confusion between S-V and D-A fit is evident in Mackowiak, Mackowiak and Schulz (1990). They expected to find a relationship between P-E fit and pharmacist job performance. They actually looked at S-V fit (they defined P-E fit as “the extent to which personal needs are supplied in the work environment”) when in fact they should have examined D-A fit. Not surprisingly, they either found no relationship or a weak relationship between S-V fit and performance. In view of this, the stand taken in the current research is that job satisfaction is the appropriate dependent variable since S-V fit is being examined.
Another critical issue is that of the need for commensurability of scales that measure the person and the environment. Commensurate measurement is the measurement of both the person and environment with the same content dimensions and graded on the same scales. Examples of studies employing commensurate measures of the person and the environment are Edwards (1996) and French, Rogers & Cobb (1974). In addition to these studies, Caplan (1987) stressed the importance of measuring the person and the environment along commensurate dimensions. Caplan (1987) laid down three guidelines for operationalising fit:
• The person and the environment should be assessed along commensurate dimensions;
• The researcher must distinguish between objective and subjective measures of fit and its components;
• The researcher must be able to distinguish between “person abilities -environmental demands” (D-A fit) and “person needs - -environmental supplies” (S-V fit).
that I fit well, so I must be satisfied with my job.”) and is therefore not adopted in the current research. Edwards (1991) criticised direct measures primarily because they confound the constructs of the person and the environment, thereby preventing the estimation of their independent effects. In Edwards (1996), environmental supplies and personal values (S-V fit) are measured by asking respondents how much of each task is involved in their job and how much of each task they prefer. Livingstone et al (1997) also conducted a study that employed a similar measure of S-V fit in their research. Respondents were asked two sets of questions with responses graded according to commensurate dimensions. Respondents were asked questions that measured the supplies in the organisation e.g. “People are rewarded for creative work in this organisation”. They were also asked questions that measured their values for creativity. Questions that measure supplies and values for creativity are commensurate with each other. There are many other P-E fit studies like these. This method can be considered to be one of the popular ways of measuring P-E fit and is also adopted in the current research.
Perceived and subjective fit have often been used interchangeably (e.g. Cable & DeRue, 2002). However, Kristof et al (2005) distinguished between perceived fit, subjective fit and objective fit. Kristof et al (2005) has given the most comprehensive coverage of studies on person-environment fit so far. According to them, perceived fit is when an individual makes a direct assessment of the compatibility between P and E. As mentioned earlier, this is plagued by the consistency bias and therefore not adopted in this research. Subjective fit is assessed indirectly through the comparison of P and E variables reported by the same person. Objective fit is calculated indirectly through the comparison of P and E variables as reported by different sources. The current research examines subjective fit.
In Roberts & Foti (1998), work structure was measured perceptually. Work structure was treated as comprising of job autonomy and supervisory structure. Job autonomy was measured with the autonomy subscale from the job diagnostic survey (JDS; Hackman & Oldham, 1975). Supervisory structure was measured with a modified form of the “Initiation of Structure” and “Tolerance of Freedom” subscales of the Leader Behaviour Description Questionnaire (Form XII Stogdill, 1963). It was found that satisfaction was higher for employees with high (low) self-leadership who worked in low (high) structure environments.
Szilagyi, & Keller, 1976), namely skill variety, task identity, autonomy and feedback. Responses are rated on a 5-point scale (1= Very little, 5= Very much).
From the literature review, it is possible to draw a theory in that, the more the perceived supplies differed from that of the desired level, the lower will be the satisfaction. This is so, regardless of whether the supplies exceeded or were insufficient compared to the desired level. The hypotheses accordingly are:
HO: There is no relationship between the absolute difference scores (between perceived and desired work attributes) and satisfaction HA: The absolute difference scores (between perceived and desired work
attributes) are negatively correlated with satisfaction.
3. Research Methodology
3.1. Research Instruments
Work congruence was measured using a questionnaire adapted from items in the Job Diagnostic Survey (JDS: Hackman & Oldham, 1975). There were five items: quantity of work, variety of work, power, responsibility and amount of concentration required whilst doing the work. For each item, respondents were asked to indicate on a 9-point scale, how much of it was present in the job and how much they desired.
Job satisfaction was measured using the Job Descriptive Index (JDI; Smith Kendall & Hulin, 1969). It consists of five separate sections. Each section measures one separate facet (the job itself, pay, promotion, supervision, and co-workers). Total job satisfaction was measured by a simple total of the five facets. Smith Kendall & Hulin (1969) developed the JDI, which is a simple short questionnaire that requires low verbal measures and is suitable for a wide variety of situations. It was developed specifically to measure satisfaction with different job components or facets. The JDI uses 72 adjectives to describe the five dimensions of job satisfaction as follows:
i) Work (18 adjectives) ii) Pay (9 adjectives) iii) Promotion (9 adjectives) iv) Supervision (18 adjectives) v) Co-workers (18 adjectives)
Scoring for the questionnaire has been done in accordance with Smith
et al’s (1969)recommendation as follows:
A positive answer to a positive item is scored 3 A negative answer to a negative item is scored 3 An undecided answer to any item is scored 1 A positive answer to a negative item is scored 0 A negative answer to a positive item is scored 0
Note: an undecided answer scores 1 point, not 2, because Smith et al
(1969) stated that a “?” is more indicative of dissatisfaction than satisfaction. This aspect was tested by Hanisch (1992) and shown to be correct. The JDI has been reported to be the most frequently used measure of job satisfaction (De Meuse, 1986; O’Connor, Peters & Gordon, 1978; Yeager, 1981; Ironson, Brannick, Smith, Gibson & Paul, 1989). According to Ironson et al (1989), the Social Science Citation Index and Psychological Abstracts revealed 454 articles referring to the JDI between January 1979 and November 1987. The JDI was shown to have dimensional consistency over a wide range of situations (Jung, Dalessio & Johnson, 1986) and to have good discriminant and convergent validity. It has also been used in P-E fit studies to measure job satisfaction (Smart, Elton & McLaughlin, 1986). It has been shown to be reliable and valid not only in America but also in Spain (Hulin, Drasgow & Komocar, 1982), Saudi Arabia (Maghrabi & Johnson, 1995), Hong Kong (Lam, 1995) and Singapore (Goh, Koh & Low, 1991). The above-mentioned cases also demonstrate the ease of translating the JDI into different languages, as the items/questions in it are mostly one-word items.
The final section of the questionnaire also measures the demographics of the respondents.
3.2. Sample
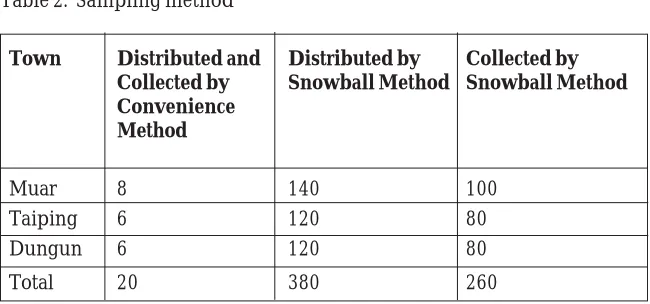
Four hundred questionnaires were distributed during the year 2003. Only two hundred and eighty of the questionnaires returned were usable. A mixture of convenience and snowball sampling was used (please refer to Table 2). The researcher sent questionnaires to each of his own personal contacts as respondents to fill in the questionnaire – eight in Muar, six in Taiping, and six in Dungun. All twenty were returned. The researcher also requested each of his personal contacts to distribute twenty questionnaires to their office colleagues and friends. Out of these three hundred and eighty questionnaires, which were distributed by snowball sampling, only two hundred and sixty questionnaires were returned and usable. Thus a total of two hundred and eighty questionnaires were usable.
Table 1. Population estimates
Source: Brinkhoff, H. (2007)
Table 2. Sampling method
City/Town State Population
Kuala Lumpur Wilayah Persekutuan 1,297,526
Ipoh Perak 574,041
Taiping Perak 199,330
Johor Bahru Johor 630,603
Muar Johor 102,273
Kuala Trengganu Trengganu 255,109
Dungun Trengganu 50,166
Town Distributed and Distributed by Collected by Collected by Snowball Method Snowball Method Convenience
Method
Muar 8 140 100
Taiping 6 120 80
Dungun 6 120 80
4. Results
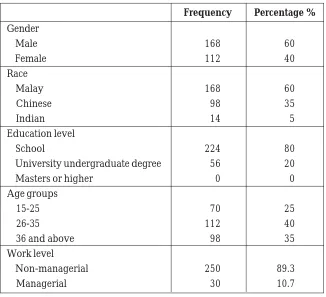
The sample characteristics are laid out in Table 3 below.
Sixty percent of the respondents were males and forty percent were females. Sixty percent of the respondents were of the Malay race, thirty five percent were Chinese and only five percent were Indians. Eighty percent of the respondents had only school education, twenty percent had university undergraduate degrees and none had masters degrees. The majority of the respondents (i.e. forty percent) were aged between twenty six to thirty five years. Twenty five percent of the respondents were aged fifteen to twenty five. Thirty five percent of the respondents were aged thirty six and above. Approximately eighty nine percent of the respondents held non-managerial positions and the remaining eleven percent held managerial positions.
The cronbach coefficient alpha test of reliability was conducted on the congruence scale and the JDI. The figures were 0.68 and 0.89 respectively. Nunnally (1978) suggests that instruments used in basic research have a Table 3. Sample characteristics
Frequency Percentage %
Gender
• Male 168 60
• Female 112 40
Race
• Malay 168 60
• Chinese 98 35
• Indian 14 5
Education level
• School 224 80
• University undergraduate degree 56 20
• Masters or higher 0 0
Age groups
• 15-25 70 25
• 26-35 112 40
• 36 and above 98 35
Work level
• Non-managerial 250 89.3
reliability of about 0.7 or better. The JDI clearly satisfied that requirement. However, the congruence scale which has a reliability score of 0.68 is below the threshold but not by much. Thus, subsequent results have to be treated with caution. Tests of pearson correlation were conducted to see whether there were any significant relationships between the difference scores and satisfaction scores.
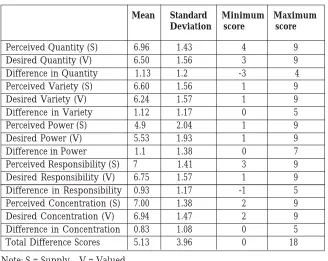
The means, standard deviations, minimum and maximum scores for the actual and preferred work attributes and the difference scores are listed in Table 4 below.
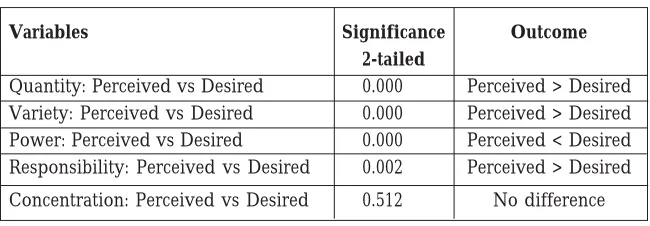
The mean scores of perceived (i.e. supplies) were compared with desired (i.e. value) for each of the work attributes of quantity, variety, power, responsibility and concentration. Paired samples T-Test showed that the differences were significant for quantity, variety, power and responsibility but not for concentration (see Table 5).
Mean scores for perceived quantity of work were significantly higher than desired quantity of work suggesting that the majority of respondents in our sample felt that they were overworked. Mean scores for perceived variety of work were significantly higher than desired variety of work suggesting the majority of respondents felt that they had too many different tasks to do. Mean scores for perceived power were lower than desired level of power indicating that respondents feel disempowered at work. Mean scores for perceived responsibility were significantly higher than desired levels of responsibility suggesting that respondents generally felt that they had too much responsibility. It is useful to bear in mind at this point that two hundred and fifty, out of two hundred and eighty respondents are non-managerial workers working in small towns in Malaysia. Therefore, such results are not unexpected.
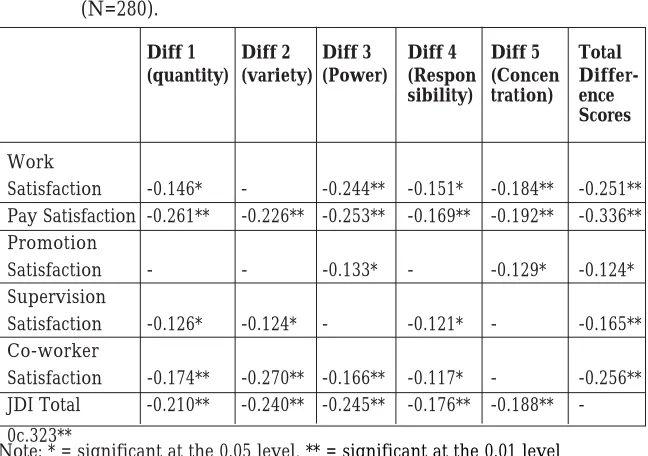
Tests of Pearson’s correlation were conducted between the total difference scores and the total satisfaction scores (JDI total) and the results are displayed in Table 6. The null hypothesis was rejected and the alternative hypothesis was supported. The total difference scores were significantly negatively correlated with the JDI total (-0.323 significant at the 0.01 level), i.e. the total difference scores accounted for 10.4% of the variance in the JDI total. This suggests that the greater the difference between the perceived and desired work attributes (quantity, variety, power, responsibility and concentration required), the lower will be the satisfaction with the job as a whole. The total difference sores were significantly negatively correlated with work satisfaction scores, pay satisfaction scores, supervision satisfaction scores and co-worker satisfaction scores (-0.251 and -0.336 respectively significant at the 0.01 level, -0.124 significant at the 0.05 level, -0.165 and -0.256 significant at the 0.01 level). This suggests that the greater the difference between the perceived and desired level totals, the lower will be the satisfaction with the work itself, pay, promotion, supervision and co-worker satisfaction.
It can also be seen from Table 6 that the difference scores relating to work quantity (i.e. the variable “Diff 1”) are significantly negatively Table 4 . Perceived, Desired and Difference Scores.
Note: S = Supply, V = Valued
Mean Standard Minimum Maximum
Deviation score score
Perceived Quantity (S) 6.96 1.43 4 9
Desired Quantity (V) 6.50 1.56 3 9
Difference in Quantity 1.13 1.2 -3 4
Perceived Variety (S) 6.60 1.56 1 9
Desired Variety (V) 6.24 1.57 1 9
Difference in Variety 1.12 1.17 0 5
Perceived Power (S) 4.9 2.04 1 9
Desired Power (V) 5.53 1.93 1 9
Difference in Power 1.1 1.38 0 7 Perceived Responsibility (S) 7 1.41 3 9
Desired Responsibility (V) 6.75 1.57 1 9
Difference in Responsibility 0.93 1.17 -1 5
Perceived Concentration (S) 7.00 1.38 2 9
Desired Concentration (V) 6.94 1.47 2 9
Difference in Concentration 0.83 1.08 0 5
Table 5: Results of Paired Samples T-Tests
correlated with work, pay, supervision and co-worker scores and the JDI total (-0.146 significant at the 0.05 level, -0.261 significant at the 0.01 level, -0.126 significant at the 0.05 level, -0.174 and -0.210 significant at the 0.01 level respectively). This suggests that the greater the difference between the perceived and desired levels of work quantity, the lower will be the satisfaction with the work itself, pay, supervision and co-workers, as well as satisfaction with the job as a whole. Difference scores relating to work variety (i.e. the variable “Diff 2”) are significantly negatively correlated with pay, supervision and co-worker satisfaction scores and the JDI total (-0.226, -0.124, -0.270 and -0.240 respectively). This suggests that the greater the difference between the perceived and desired level of work variety, the lower will be the satisfaction with the pay, supervision and co-worker, as well as satisfaction with the job as a whole. Also, the difference scores relating to power (i.e. the variable “Diff 3”) are significantly negatively correlated with work, pay, promotion and co-worker satisfaction scores and the JDI total (-0.244, -0.253, -0.133, -0.166 and -0.245 respectively). This suggests that the greater the difference between the perceived and desired level of power, the lower will be the satisfaction with the work, pay, promotion and co-worker, as well as satisfaction with the job as a whole. The difference scores relating to responsibility (i.e. the variable “Diff 4”) are significantly negatively correlated with work, pay, supervision and co-worker satisfaction scores and the JDI total (-0.151, -0.169, -0.121, -0.117 and -0.176 respectively). This suggests that the greater the difference between the perceived and desired levels of responsibility, the lower will be the satisfaction with the work, pay, supervision and co-worker, as well as with the job as a whole. The difference scores relating to the requirement for concentration at work (i.e. the variable “Diff 5”) are significantly negatively correlated with work, pay, and promotion satisfaction scores and the JDI total (-0.184, -0.192, -0.129 and -0.188 respectively). This suggests that the greater the difference between the perceived and desired level of concentration required for the job, the lower will be the satisfaction with the work, pay and promotion, as well as with the job as a whole.
Variables Significance Outcome
2-tailed
Tests of Pearson partial correlation were also conducted to control for the demographic variables of age, gender, education, job level and tenure (see Table 7). It is worthwhile to note that the correlation between job satisfaction and the total difference scores is -0.315 (significant at the 0.01 level), which is not much less than the earlier correlation coefficient of -0.323 when the aforementioned demographic variables were not controlled. The same is true for the correlation between the JDI total and difference scores relating to quantity (-0.201) variety (-0.220), power (-0.243), responsibility (-0.162) and concentration (-0.192). All these correlation coefficients were also significant at the 0.01 level even after controlling for the demographic variables.
5. Discussion of Results
In this research, the discrepancy between the supplies and values for the various work attributes investigated were significantly negatively related to satisfaction at work. When the difference scores for the various work attributes were combined they had a significant negative correlation with the total satisfaction scores. In particular, the correlation between the total difference scores and pay satisfaction was high at -0.336 (when demographic variables were not controlled) or 0.318 (when the aforementioned Table 6 . Correlation between difference scores and satisfaction scores (N=280).
Note: * = significant at the 0.05 level, ** = significant at the 0.01 level
Diff = absolute difference between perceived and desired scores
Diff 1 Diff 2 Diff 3 Diff 4 Diff 5 Total (quantity) (variety) (Power) (Respon (Concen
Differ-sibility) tration) ence Scores
Work
Satisfaction -0.146* - -0.244** -0.151* -0.184** -0.251** Pay Satisfaction -0.261** -0.226** -0.253** -0.169** -0.192** -0.336** Promotion
Satisfaction - - -0.133* - -0.129* -0.124*
Supervision
Satisfaction -0.126* -0.124* - -0.121* - -0.165** Co-worker
Note: * = significant at the 0.05 level, ** = significant at the 0.01 level
Diff = absolute difference between perceived and desired scores
Table 7. Correlation between difference scores and satisfaction scores after controlling for demographic variables of age, gender, education level, job level and tenure (N=280).
demographic variables were controlled). This can be compared with the correlation between the total difference scores and the JDI total scores at -0.323 (when demographic variables were not controlled) or 0.315 (when demographic variables were controlled). This would imply that workers are comparing their inputs to the amounts of pay that they are receiving as suggested in Adams (1965). Hence, satisfaction with pay would be especially affected by discrepancies between perceived and desired work attributes. Satisfaction with colleagues was also significantly negatively correlated with the total difference scores, although to a lesser extent (-0.256 when demographic variables were not controlled and -0.240 when demographic variables were controlled).
Diff 1 Diff 2 Diff 3 Diff 4 Diff 5 Total (quantity) (variety) (Power) (Respon (Concen
Differ-sibility) tration) ence Scores
Work
Satisfaction -0.146* - -0.256** -0.149* -0.190** -0.263** Pay
Satisfaction -0.246** -0.194** -0.241** -0.150* -0.197** -0.318** Promotion
Satisfaction - - -0.158* - -0.133* -0.143*
Supervision
Satisfaction -0.119* - - - - -0.151**
Co-worker
Satisfaction -0.165** -0.246** -0.153** - - -0.240** JDI Total -0.201** -0.220** -0.243** -0.162** -0.192** -0.315**
They will perceive that they are underpaid, thus not satisfied with their pay. If they have a lot of work, they will expect to be promoted faster and if this is not forthcoming, they will not be satisfied with their promotion opportunities (especially if seniority is the sole or main criteria for promotion). If respondents feel that they are overworked, they will probably feel that their superiors do not care or are taking advantage of them. They will not be satisfied with their superiors. If respondents feel that they are overworked, they will probably blame their co-workers for not carrying their own weight. They will not be satisfied with their co-workers. Although this is a cross-sectional study and we cannot prove causation, it is reasonable to argue that the misfit between perceived and desired work attributes will result in lowered satisfaction, rather than the other way round.
The same goes for work variety. Managers should interview or distribute questionnaires to workers to assess whether they find the work too specialised or too varied. Results of this study suggest that respondents generally feel they have too many different tasks to do. If that is true, superiors should divide the work among different people and allow more specialisation. If on the other hand, the work is too specialized, then superiors can consider job enlargement i.e. have the same worker perform different types of jobs.
Results of this study suggest that respondents generally feel disempowered. Superiors should empower their subordinates by giving them the proper authority, and not just the responsibility to carry out their tasks. As it is, results suggest that workers already perceive that they have too much responsibility. One possible reason (although it is impossible to determine this merely with the quantitative data collected) is that workers may feel that they are often made the scapegoats if something goes wrong. Perhaps an interview with the respondents can be conducted to find out whether this is indeed true.
Paired samples T-tests suggest that there is no significant difference between perceived and desired levels of concentration. So, there are some respondents who feel that the level of concentration required, is too high. There are others who feel that the level of concentration required is too low. Then, there are others who feel that it is just right. The amount of concentration required to do the work should be optimal. One could hypothesise that too much could lead to fatigue whereas too little could result in boredom. However, as neither fatigue nor boredom were measured in this study that is mere speculation. However, results (as per Table 6 and 7) show that the misfit between perceived and desired levels of concentration is related to lower work satisfaction, pay satisfaction, promotion satisfaction and overall satisfaction.
that there may be other aspects of S-V fit that were not investigated such as the supplies and values for creativity, innovation and growth.
One limitation of this study is the relatively small sample size. Perhaps further replicatory research should be conducted in other small towns in Malaysia and other Asian countries. Another question that can be raised is, “Is fit always a good thing? It has been assumed that a high degree of fit is beneficial. However, could there be a dark side of fit? For instance, could there be situations where the fit between a person and his work environment gives rise to negative outcomes? Kulik, Oldham & Hackman (1987) answered this question by making a distinction between the two forms of fit (high growth needs and challenging jobs on the one hand and low growth needs and non-challenging work on the other). They pointed out that the outcomes for the two may be entirely different. Whereas high performance is anticipated from the first form of fit, it is not expected from the second form. However, high job satisfaction may be an outcome from the second form of fit. In the context of the current research, workers who prefer, and were involved in, work that was of low quantity, variety, power, responsibility and concentration, may be satisfied but could not properly be considered to be high performers.
6. Conclusions
This study has two objectives in relation to the person-environment fit theory. The first objective is to examine the degree of fit between the desired and perceived job characteristics (i.e. work quantity, variety, power, responsibility and concentration) and how that is associated with satisfaction. Unlike previous studies which examined only autonomy and supervision style as components of the environment, this study looked at five job characteristics i.e. work quantity, variety, power, responsibility and concentration required for the job. The second objective is to test the applicability of the person-environment fit theory in Malaysia.
Dungun, all of which are located in Peninsular Malaysia. There was a significant negative correlation between the degree of fit (represented by the total of the absolute difference scores) and satisfaction scores (r = -0.323, significant at the 0.01 level), thus achieving the first objective of this study. Furthermore, this is consistent with results of research conducted in America and Britain, thus achieving the second objective of the study. This research is clearly significant as the person-environment fit theory (in particular the S-V Fit theory), propounded in developed countries such as America and Britain, is also applicable in small towns in a developing country such as Malaysia. This research lends support to the proposition that the P-E fit theory is universally applicable and is valid across different cultures and countries.
References
Adams, J. S. (1965) Inequity in Social Exchanges. In L. Berkowitz (ed.),
Advances in Experimental Social Psychology, New York: Academic Press. Blau, G. J. (1987). Using a person-environment fit model to predict job involvement and organisational commitment. Journal of Vocational Behavior, 30, 240-257.
Brinkhoff, H. (2007), July. Malaysia – City Population, Cities Towns and Provinces – Statistics and Map. Retrieved April 25, 2008 from http:www.citypopulation.de/Malaysia.html#Stadt_gross.
Buboltz, W. C., Ebberwein, C., Watkins, C. E. & Savickas, M. L. (1995). A comparison of the content, authors and institutions represented in the Career Development Quarterly and the Journal of Vocational Behavior.
Journal of Vocational Behavior, 46, 216-226.
Cable, D. M. & DeRue, D. S. (2002). The convergent and discriminant validity of subjective fit perceptions. Journal of Applied Psychology, 87,
875-884.
Caplan, R. D. (1987). Person-environment fit theory and organizations: commensurate dimensions, time perspectives, and mechanisms. Journal of Vocational Behavior, 31, 248-267.
De Meuse, K. P. (1986). A compendium of frequently used measures in industrial/organizational psychology. The Industrial-Organizational Psychologist, 23, 53-59.
Edwards, J. R. (1991). Person-job fit: a conceptual integration, literature review and methodological critique. International Review of Industrial/ Organizational Psychology, 6, 283-357.
Edwards, J. R. (1993). Problems with the use of profile similarity indices in the study of congruence in organizational research. Personnel Psychology, 46, 641-665.
Edwards, J. R. (1996). An examination of competing versions of the person– environment fit approach to stress. Academy of Management Journal, 39,
292 – 339.
Edwards, J. R. (2001). Alternatives to difference scores: Polynomial regression analysis and response surface methodology. In F. Drasgow & N.W. Schmitt (Eds.), Advances in measurement and data analysis. San Francisco: Jossey-Bass.
Edwards, J. R. & Cooper, C. L. (1990). The person-environment fit approach to stress: recurring problems and some suggested solutions. Journal of Organizational Behavior, 11, 293 – 307.
Feldman, D. C., Leana, C. R. & Bolino, M. C. (2002). Underemployment and relative deprivation among re-employed executives. Journal of Occupational and Organizational Psychology, 75, 453-471.
French J. R. P., Caplan, R. D. & Harrison. R. V. (1982). The Mechanisms of Job Stress and Strain. London: John Wiley & Sons.
French, J. R. P. Jr., Rogers, W. & Cobb, S. (1974). Adjustment as person-environment fit. In Coping and Adaptation (ed. Coelho G. V., Hamburg D. A. & Adams J. E.). New York: Basic Books.
Goh, C. T., Koh, H. C. & Low, C. K. (1991). Gender effects on the job-satisfaction of accountants in Singapore. Work and Stress, 5, 341-348.
Hackman, J. & Oldham, G. R. (1975). Development of the job diagnostic survey. Journal of Applied Psychology, 60, 159-170.
Hackman, J. R. & Oldham, G. R. (1980). Work Redesign. Reading, MA: Addison-Wesley.
Hanisch, K. A. (1992). The Job Descriptive Index revisited: questions about the question mark. Journal of Applied Psychology, 77, 377 – 382. Hulin, C. L., Drasgow, F. & Komocar, J. (1982). Applications of item response
theory to analysis of attitude scale translations. Journal of Applied Psychology, 67, 818-825.
Ironson, G. H., Brannick, M. T., Smith, P.C., Gibson, W. M. & Paul, K. B. (1989). Construction of a job in general scale: comparison of global, composite and specific measures. Journal of Applied Psychology, 74,
193-200.
Johnson, G. J. and Johnson, W. R. (1999). Perceived overqualification and health: A longitudinal analysis. Journal of Social Psychology, 139, 14-28. Jung, K. G., Dalessio, A. & Johnson, S. M. (1986). Stability of the factor structure of the Job Descriptive Index. Academy of Management Journal, 29, 609-616.
Kristof, A., Zimmerman, R. D. & Johnson, E. C. (2005). Consequences of individuals’ fit at work: a meta-analysis of job, person-organization, person-group and person-supervisor fit, Personnel Psychology, 58, 281-342.
Kulik, C. T., Oldham, G. R. & Hackman, J. R. (1987). Work design as an approach to person-environment fit. Journal of Vocational Behavior, 31,
297-318.
Lam, S. K. (1995). International Journal of Management, 12, 96-101.
Lee, C., Ashford, S. J. & Bobko, P. (1990). Interactive effects of “Type A” behavior and perceived control on worker performance, job satisfaction and somatic complaints. Academy of Management Journal, 33, 870-881. Lewin, K. (1951). Field Theory in Social Science. New York: Harper.
Livingstone, L. P., Nelson, D. L. & Barr, S. H. (1997). Person – environment fit and creativity: an examination of supply – value and demand – ability versions of fit. Journal of Management, 23, 119 – 146.
Locke, E. A. (1969). What is job satisfaction? Organizational Behavior and Human Performance, 4, 309-336.
Locke, E. A. (1976). The nature and causes of job satisfaction. In Handbook of Industrial and Organizational Psychology. (ed. Dunnette, M. D.), Skokie, IL: Rand McNally.
Mackowiak, J. I., Mackowiak, L. R. & Schulz, R. M. (1990). Person-environment fit as a predictor of hospital pharmacist job performance. American Journal of Hospital Pharmacy, 47, 1089-1095.
Maghrabi, A. S. & Johnson, D. A. (1995). An Arabic version of the revised Job Descriptive Index. Current Psychology, 14, 47-53.
Muchinsky, P. M. & Monohan, C. J. (1987). What is person-environment congruence? Supplementary versus complementary models of fit.
Journal of Vocational Behavior, 31, 268-277.
Murray, H. A. (1938). Explorations in Personality. Boston: Houghton Mifflin. Naylor, J. C., Pritchard, R. D. & Ilgen, D. R. (1980). A Theory of Behavior in
Organizations. New York: Academic Press.
Nunnally, J.C. (1978). Psychometric theory (2nd ed). New York: McGraw-Hill.
O’connor, E. J., Peters, L. H. & Gordon, S. M. (1978). The measurement of job satisfaction: current practices and future considerations. Journal of Management, 4, 17-26.
Osipow, S. H. (1987). Applying person-environment theory to vocational behavior. Journal of Vocational Behavior, 31, 333-336.
Parsons, F. (1909). Choosing a Vocation. Boston, MA: Houghton Mifflin. Pervin, L. A. (1989). Persons, situations, interactions: the history and a
discussion of theoretical models. Academy of Management Review, 14,
350-360.
Porter, L. W. & Lawler, E. E. (1968). Managerial Attitudes and Performance.
Posner, B. Z., Kouzes, J. M. & Schmidt, W. H. (1985). Shared values make a difference – an empirical test of corporate culture. Human Resources Management, 24, 293-309.
Roberts, H. E. & Foti, R. J. (1998). Evaluating the interaction between self-leadership and work structure in predicting job satisfaction. Journal of Business and Psychology, 12, 257-267.
Schneider, B. (1978). Person-situation selection: a review of some ability-situation interaction research. Personnel Psychology, 31, 281-297. Schneider, B. (2001). Fits about fit. Applied Psychology: An International
Review, 50, 141-152.
Sims, H., Szilagyi, A. & Keller, R. (1976). The measurement of job characteristics. Academy of Management Journal, 19, 195-212.
Smart, J. C., Elton, C. F. & Mclaughlin, G. W. (1986). Journal of Vocational Behavior, 29, 216-225.
Smith. P.C., Kendall L. M. & Hulin, C. L. (1969). The Measurement of Satisfaction in Work and Retirement: A Strategy for the Study of Attitudes. Chicago: Rand McNally & Company.
Stogdill, R. M. (1963). Manual for the Leader Behavior Description Questionnaire – Form XII. Columbus: Bureau of Business Research, The Ohio State University.