© Universiti Tun Hussein Onn Malaysia Publisher’s Office
IJIE
Journal homepage: http://penerbit.uthm.edu.my/ojs/index.php/ijie
The International
Journal of
Integrated
Engineering
ISSN : 2229-838X e-ISSN : 2600-7916
*Corresponding author: [email protected]
2019 UTHM Publisher. All right reserved. penerbit.uthm.edu.my/ojs/index.php/ijie
269
Proactive Safety Measure Using Road Environment
Assessment Program (REAP)
Intan Suhana Mohd Razelan
1,*, Azlina Ismail
1, Zahrizan Zakaria
11 Faculty of Civil Engineering and Earth Resources Universiti Malaysia Pahang, 26300 Pahang, MALAYSIA
*Corresponding Author
DOI: https://doi.org/10.30880/ijie.2019.11.01.029
Received 15 Jul 2018; Accepted 17 December 2018; Available online 15 May 2019
1.
Evaluating Road Environment’s Safety Status
Besides road geometry, several studies focusing on evaluating the road safety status based on specific road aspects have also been a major concern among road safety experts worldwide. Road environment is one of them. The contribution of road environment towards crash occurrences has been accepted by many researchers based on the evidence that complexity of road environment is highly related in producing high risk to drivers [1]. In general terms, road environment is defined as the road aspects related to the design and engineering elements of the road system, the safety implications of traffic and the users of that system, as well as the interaction of these components with the adjacent land use [2].
The environment of the road covers an area from the roadway itself until an area beyond the roadside during traffic operations. The environments of these areas in-whole would create exclusive road environment for every particular road area along the road network. However, the studies on the contributions of road environment aspect towards crash occurrences whether during operational period or not are quite limited. Most of the studies are only interested on roadside environment aspect only since the implication of roadside as one of the factors in producing complex road environment hence contributes to crash is already proven [3]-[5].
Although there were several studies who have taken roadside environment as their research theme, but there were only few studies focusing on evaluation of roadside environment safety status aiming to prevent crash occurrences. The implications of roadside environment in contributions to road safety status was well explored in the development of Roadside Hazard Rating [4], development of roadside hazard severity indicators [5] and production of predictive models relating crash with road environment and traffic flow [3]. In these studies, selected roadside aspects that
Abstract: In Malaysia, reactive crash statistics have becoming very crucial in evaluating road’s safety level and in
deciding crash-prone areas known as black spot. The establishments of these statistics normally take years to complete as a result of several well-known setbacks within developing countries. Those obstacles had produced poor crash database having low accessibility, reliability and adequateness of crash data that finally brought major impact to the entire road safety system. In light of that, a proactive safety measure called Road Environment Assessment Program (REAP) has been developed to help evaluating the environment risk factors of a road, calculating the risk index and presented the results through Google Earth platform. REAP was developed based on composite risk index value aggregated from 14 road environment indicators existed in most Malaysia federal roads. Based on the local conditions of the selected roads, specific road environment risk factor were produced where trend and risk level as well as identifications of riskiest road section could be easily identified. REAP is a time-saving and cost-saving tool as it can directly recognize problematic road environment factors while planning on the best and suitable road improvement procedures for problematic sections.
suspected to have substantial contributions towards crash were investigated. The outcomes from these studies agree that roadside environment is an essential part of road environment that should be studied in order to evaluate the road’s network safety status [5]. An effort to construct a scale or developing roadside indicator and further ranked the safety of the roadside environment [4,5] has proved to be very useful in future studies on the effect of roadside area towards crash.
Even though there was an issue of uncertainty in developing the roadside scale especially when the scale is based on personal observations and opinions [4], these studies has successfully concluded that lane width, sidewalks, raised median, access management, poor road traffic operations [3] and also non-traversable obstacles in the vicinity of the roadway, steep roadside slopes, deep ditches [4,5] must be considered when evaluating road environment safety status of a road network.
2.
The Establishment of Road Safety Indicator in Malaysia
Traffic crashes in developing countries imposed serious effect especially in terms of its economic turnover since lots of money must be invested in medical supplies and vehicles parts. An extensive works done by [6]) in proposing a strategy to improve road safety in developing countries also concluded that Malaysia is also one of the most prominent countries in this issue. He summarized that by looking at the motorization levels and fatality rates for various countries within 1988 – 1998, Malaysia has reported to have about 1111 vehicles / 10,000 persons and with that amount of vehicles travelling on the Malaysian roads, 2.43 fatalities were recorded for every 10,000 persons which is relatively higher than another developing countries like Brazil who also have almost the same amount of vehicle per person (1000 vehicles / 10,000 person) but had only recorded 0.42 fatalities per 10,000 persons. Other than that, a recent study stated that the percentage of fatalities were approximately [7].
7.78 to 8.57 per month or 23.2 to 24.6 fatalities over 100,000 populations based on the 10 years crash data from 2004 until 2013. These accidents records shows that the number of fatalities in Malaysia were rather stagnant despites all the measures that have been done by number of agencies in Malaysia.
In an attempt to overcome this issue, many researches on road safety performance were conducted worldwide. Many had successfully developed system that were well-accepted by the authorities to be used as a guideline in road improvements works as well as a foundation to the developments of the new traffic regulations [4,8,9,10,11,12]. Although most of the currently available road safety systems have taken into considerations all road environment factors i.e. roadway and roadside environment factor and operational environment factors, none of them combined and analyzed the factors collectively. Thus, an attempt to use the risk produced by road environment factors in evaluating the road safety status of a road network was seen as an interesting area to explore.
Crash statistics have been widely known for its usefulness in defining road safety status for almost every level of jurisdictions; from countries down to the road sections itself. Most of the statistics were in terms of final outcome information using registered crash data, for example ‘the number of killed and injured persons [13]. However, the usage of these type of statistics namely number of total crash, number of fatalities as well as other road safety indicators such as vehicle kilometer travel have received lots of attention from various road safety experts arguing its ability in defining true factors influencing the crash [14,15]. The reality of traffic safety in its broad sense cannot only be captured by simple statistical indicators of rates of casualties and fatalities [16]. Nevertheless, crash statistics were still been widely used in most countries since there are no better system that can act as road safety indicator in defining roads safety level.
Crash statistics such as total number of crash, number of fatalities and number of severity have always been used road safety indicator to evaluate road’s safety status. These data have been widely used by most developing countries including Malaysia to identify problematic road sections, prediction of crash occurrences by developing a crash model and in investigation of crash factors. One of the earliest studies done in Malaysia using crash data in forecasting the road safety status was carried out by employing multivariate analytical techniques to project fatalities and crashes in Malaysia, they have successfully developed crash models for Malaysian conditions as follows [17].
Death = 2289(e0.00007 Vehicle.Population.Road)(e0.2073 Data Collection System) (1)
Crash = 43478(e0.00011 Vehicle.Population.Road)(e0.2447 Data Collection System) (2)
Using these models, the first projection of Malaysia’s road safety status was made and the results concluded that crash and fatalities in Malaysia is increasing following an increased in exposures to crash. However, after having been used for years the quality and reputation of the crash statistics as road safety indicator starts to fall apart as it appeared to mistakenly identifies crash locations [18] by miscalculating the number of crash [19] in certain cases. These situations have been an alarming call for the road safety experts to come out with alternative procedures especially in evaluation of road safety status which may lead to further works in road safety field.
271
Ŷ(t) = μ + Y(t-1) - θe(t-1) (3)
where Ŷ_((t)) = Predicted fatalities at current time, t, Y_(t-1) = fatalities a year before and θ = 0.901.
The need to have new system with an ability to capture all factors leading to crash occurrences is highly anticipated. In a country like Malaysia who is still at its early phase of instilling road safety educations in its society, having new system that is capable to elaborate the most crucial aspects of the road can be seen as a start for a better road traffic system. Apart from that, development of road safety index in Malaysia was also seen as a proactive measure in identifications of problematic road sections that required urgent treatment [18].
3.
Reactive versus Proactive Safety Measures
Reactive measures are defined as an improvement made to the road as a reaction to crash [21] in an attempt to reduce the re-occurrences of crashes in the future. Reactive measures are solely based on crash records of the selected jurisdiction where improvements works are planned and executed after crash records have been established. After the sections have been established as black spot area, several site visits, interviews with local people who lived nearby the area and several brainstorming sessions will took place. As these processes are on-going, the locations remain risky and waiting to claim more lives until specific road improvement works have been identified. As reactive measure is defined as an improvement made in reaction to crash, proactive measure, on the other hand, is identified as a collision prevention approach that tries to prevent unsafe road conditions from occurring [22].
Studies on proactive road safety evaluation have becoming an interest in road safety communities. Several proactive methods to evaluate road safety condition have been introduced by far. One of the latest studies by [23] on proactive safety evaluation at un-signalized intersection concluded that using post encroachment time (PET) as a surrogate measure in conflict study is very beneficial for highways and major roads where traffic were following exact posted speed.
However, in order to establish a reliable proactive safety measure, more than one crash factor must be used so that wider coverage of the crash perspectives could be achieved. Realizing the needs to combine as much information as possible from current road conditions in mitigating correct crash factors, a concept of composite index was introduced. Here, each indicator developed from the targeted road aspect was given specific weight and later these indicators were combined to produce single values which represented the road safety status for the selected area.
As indicated by Ghazwan [15] the philosophy of combining performance outcomes into one single quantitative value, so called “composite index”, is not a new one. Although the developments of composite index were seen as a challenging matter to road safety researcher [24], this index is desperately needed as an easy and understandable tool for policy makers and the public to measure the road safety status [15]. In line with that, many composite indices have been developed internationally and used across fields to indicate a progress or achievements between comparable entities such as countries.
Road Environment Assessment Program (REAP) is a state-of-the-art proactive method that is developed based on composite index value, easy to use, has an ability to capture current road aspects and can provide proper road section safety status in short period of time. The innovation of defining road section safety status by not relying on the availability of the crash data were explored so that road improvement works targeting at correct locations and correct road aspects are rapidly initiated. REAP is solely based on existing environment conditions of the road that the database was consistently updated when major improvements to the road environments of the selected road took place.
Apart from that, REAP was developed with an intention to ensure public can easily acquire information on road safety status and straightforwardly understand the risk of crash as produced by road environment factors via user friendly platform.
4.
Site Selection Criteria
Malaysian road networks are comprised of three major types of roads that were normally considered in pursuing studies on road safety i.e. highway/ expressway, federal roads or state roads. These types of roads have becoming a popular choice partly because of the number of crashes that keep on increasing from year to year and partly because of the rising traffic volume recorded in these roads. Moreover, most of these roads especially federal roads and state roads have been in operations of more than 20 - 30 years by now.
Not only that, the selected roads must also be used by almost all types of land vehicles available in Malaysia, have high vehicle compositions, high number of traffic volume and have regarded as problematic roads with high number of crashes and high number of black spot areas. Although this composite index is meant to be supplementary indicators to crash-indicators, the selection of study area with high number of crashes would be an advantage during validation period.
4.1 Study area 1: KM 2 – KM 82.5 of Federal Road 2
Federal Road 2 in whole is linking Port Klang in Selangor and Port Kuantan in Pahang and the selected parts of road run across modern towns of Kuantan, educational institutions (Universiti Malaysia Pahang, MARA Professional Colleges, Community College and schools), shopping complexes (Giant and Tunas Manja), numbers of residential areas, small towns of Gambang and Maran and also reserved forests.
4.2 Study area 2: KM 47 – KM 147 of Federal Road 12
Federal Road 12 is connecting Segamat in Johor and Kuantan in Pahang. The selected part of road run across small villages scattered along the road, palm oil plantations and reserved forests.
4.2 Study area 3: KM 183 – KM 318 of Federal Road 3
Federal Road 3 is a 739-km length road connecting Johor Bahru in Johor and Kota Bahru in Kelantan. The selected part of road chosen as study area runs across educational institutions (Sultan Haji Ahmad Shah Islamic College, International College of Automotive, Community College and schools), industrial parks (Pekan Industrial Parks), tourism spots (Lanjut Beach), small towns (Royal town of Pekan, Nenasi and Kuala Rompin) and also small villages along the road. However, for the purpose of this paper, only results and demonstration on the usage of REAP for study area 1 would be presented.
5.
Data Collection Procedures
The chosen road length for the study areas was segmented into 500 m homogenous sections. The term homogenous is referring to the similarity of the road sections length where the sections length would remain as 500 m in each study area regardless of the geography and topography profiles of the roads. The road environment data that have high potential in posing risk to car drivers were collected section by section. 500 m length is considered as the best length in collecting the road environment data since a shorter length than that will produce a set of highly repetitive data and a longer length than that will increase the chances of losing great detail of the overall data. The marking of each 500 m is done by referring to the distance traveled as displayed on car’s odometer as the enumerators travel to collect the data.
The research work adopted a similar method as naturalistic driving method in capturing the required road environment data along the study areas. Using this method, no specific requirements were given out to the drivers/enumerators during driving session since the aim of this study is to find out the risks caused by road environment attributes to road users or car drivers in particular. So, in gathering the real picture of which road environment attributes that constantly produces risks to car drivers in each road section, normal driving behavior was required. Using this method, the drivers were required to drive their own vehicle where they already used to it, no instructions on how to drive were given, no rules on the speed limits they should follow and there were no interventions from the research work while they were driving. By doing this, normal driving behaviors as practiced by most of the car drivers in those sections were achieved and subsequently, risks that normally harmed this type of driving were recorded. If the driving behaviors were controlled, there might be some risks that failed to be captured and analyzed. For this research, two drivers were assigned to drive the car which is the researcher herself and another enumerator appointed by the research team and that only one driver would drive in each study area.
273
6.
Development of REAP
REAP was developed based on a combination of several individual road environment indicators given specific weight and later combined to produce single value which represented the road safety status for the selected area. 14 road environment indicators as shows in Table 1 have been chosen as the most crucial and risky environment attributes along study area 1.
Table 1 – Road Environment Indicators
Road Environment Indicators Number of Motorcycles/section Number of Pedestrian /section Percentage of Poor Roadway Condition
Number of Lanes/section Percentage of Unpaved Shoulder/section Percentage of Poor Road Delineation/section Percentage of Roadside Development/section Number of non-Signalized Access/section Number of Signalized Intersection/section
Percentage of Road Without Median Lane Changing Opportunity Non-Traversable Object at Roadside
Number of Heavy Vehicles/section Actual Driving Speed/section
Those indicators were chosen based on previous research in the field of road safety engineering and the characteristics of the indicators itself in posing risk of crash. Adopting exploratory approaches, several trials were performed using different combinations of indicators until a satisfactory combination of indicators was achieved.
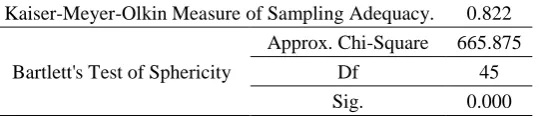
The results of the correlation analysis and first trial shows that four indicators i.e. poor roadway conditions, percentage of poor road delineations, existence of non-traversable object at roadside and number of accesses were identified to have weak correlations with other indicators and also have a weak communalities values, so the decision was made to discard those indicators from the original dataset. Second trial was conducted to the remaining 10 indicators. Table 2 shows the results of Kaiser-Meyer-Olkin (KMO) and Bartlett’s test of sphericity that have been regarded as the best combinations in producing good composite index for this study area. Below KMO and Bartlett’s results shows that the KMO results of 0.822 (Bartlett’s test: significance value = 0.0001) indicates that the datasets has a good factorability.
Table 2 – Measure of Sampling Adequacy Test Results
Kaiser-Meyer-Olkin Measure of Sampling Adequacy. 0.822
Bartlett's Test of Sphericity
Approx. Chi-Square 665.875
Df 45
Sig. 0.000
The communalities values of every indicator were verified before checking for indicator’s factorability. The communalities values are presented in Table 3. The result shows that all indicators are having acceptable communalities values which indicate that all indicators have high potential in producing good risk factor.
After agreed on the list of indicators to be used as a basis for the identifications of the road environment risk factors, next analysis was carried out. From 10 indicators as presented in Table 3, smaller numbers of components which truly represent the road environment risk factor for this particular study area were extracted. Using principal component analysis as the extraction method, the result reveals that two components with eigenvalues exceeding 1 (Kaiser Criterion), explaining 42.649% and 14.269% of the variance were gathered where the cumulative variance explained by these components is 56.918%. Adopting the parsimony rules of explaining high variance while keeping as few components as possible, a total variance exceeding 50% is good enough for the components to be accepted.
Table 3 – Communalities
Road Environment Indicators Initial Extraction
Number of Motorcycle 1.000 0.561
Number of Pedestrian 1.000 0.687
Number of Lanes 1.000 0.713
% of Unpaved Shoulder 1.000 0.500
% of Roadside Development 1.000 0.514
Number of Signalized Intersection 1.000 0.363
Percentage of Road Without Median 1.000 0.826
Lane Changing Opportunity 1.000 0.401
Number of Heavy Vehicle 1.000 0.553
Actual Driven Speed 1.000 0.575
Extraction Method: Principal Component Analysis.
Table 4 – Road Environment Indicators Loading Values
Road Environment Indicators Component
1 2
Number of Motorcycle 0.414 0.624
Number of Pedestrian 0.682 0.471
Number of Lanes 0.772 0.341
Percentage of Unpaved Shoulder -0.707
Percentage of Roadside Dev 0.541 0.471
Number of Signalized Intersection 0.584
Percentage of Road Without Median -0.880
Lane Changing Opportunity 0.630
Number of Heavy Vehicle -0.450 0.591
Actual Driven Speed -0.739
Extraction Method: Principal Component Analysis. Rotation Method: Varimax with Kaiser Normalization.a a. Rotation converged in 3 iterations.
The road section’s composite index was produced by adding up the entire individual index calculated from each indicator in every section. As a result, each road section would have their own composite index value calculated across all indicators thus making the composite index highly sensitive with the individual index value. Fig. 1 and Fig. 2 below illustrate the composite index value (y-axis) for each road section (x-axis) along the study area for infrastructure environment and road operational environment risk factor.
275
Fig. 2 – Composite Index based on Operational Environment Risk FactorSlight changes in the road environment data would cause direct changes on the individual indexes and later on the composite index value. For example, in composite index for operational environment factor, if there are any increases or decreases in terms of number of motorcycles in the study area, substantial changes in the composite index values of each road section would be produced. As the applicability of the composite index is highly depending on its ability to detect changes in the current road environment, a continuous work to update the databases are very important to ensure the accurateness of the outcomes.
7.
Development of REAP
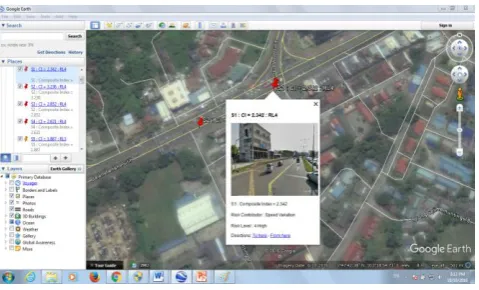
The composite index was designed according to the rules of higher composite index value represents higher risk of crashes hence low in safety status vice versa. The end results which are the composite index values for each section were then presented in Google Earth as in Fig. 3 to make sure that the aim of distributing the outcomes back to the public was achieved.
54 pins as in Fig. 3 represent 54 sections of road along the study area. Each pin color represents the level of risk with red pin gives an indication that those road sections are very risky and serious attention must be put on those locations for urgent remedial actions whereas green pin indicates a low crash risk.
In order to give users a great understanding on the level of risk of each road section, the composite index (CI) value for each section together with its road risk level (RL) would also be displayed on the REAP screen as shown in Fig. 4 and Fig. 5.
In addition to that, by going back to the composite index calculation sheets, the specific risk factor that need to be rectified can be directly identified and risk level after the remedial works have been done can also be forecasted as shown in Fig. 6.
Based on the Fig. 6, details of road safety information at every section were easily gathered based on the images in the Google Earth platform. Not only that, the usage of Google Earth application could be further enhanced by having REAP program altogether since the combination of these two applications are very useful in planning for any improvements and maintenance works on the poor and high risk road besides providing sufficient information on road safety status to the road users.
Fig. 4 – Composite Index (CI) value and Road Risk Level (RL) for each section
Fig. 5 – Composite Index (CI) value and Road Risk Level (RL) at Section 1 and 2
Fig. 6 – Details of Road Safety Level at Section 1
8.
Discussion
Road safety inspection is a very well-known procedure in identifying problematic locations along road network. Road safety inspections (RSIs) are generally defined as “an ordinary periodical verification of the characteristics and defects that require maintenance work for reasons of safety” [25]. Malaysia is currently relying on reactive measures to gather information on black spot area which are solely based on crash records of the selected jurisdiction where improvements works are planned and executed after crash records have been established.
277
the road’s actual problem and the designed road improvement procedures is getting clearer. Most importantly, improvements works could be initiated soon before any crash took place.Federal road is one of the most popular and longest road networks available in Malaysia. This type of road is responsible in conveying thousands of road users’ everyday who travelled between towns and states. The road was firstly designed to cater the needs for long distance travelling purposes for medium to high speed vehicles but since most parts of the federal roads are crossing different types of development from major towns to small villages, from residential areas to educational institutional areas, from factories to recreational areas, the long distance travellers are far from experiencing a comfort and safe driving. The drivers have to endure the highly complex road environments and moreover, they have to deal with different types of environments throughout the journey. Slowly, the environment of the federal road has becoming even riskier and as a result this road had recorded the highest number of crashes from year to year.
Although, driver’s factor is still regarded as the most crucial factor in most crash occurrences at federal road or any roads elsewhere, other factors such as the environment of the road should not be put aside. This is supported by a previous research confirming that over 80% of traffic accidents were directly or indirectly related to a driver having misperception on road conditions and/or environment of the road which directly lead to crash [26]. Following that, determinations of road environment risk factors were very important during the development of the composite road environment risk index where crucial factors that urgently required remedial works could be accurately determined.
Road infrastructure and operational factors were considered as the riskiest environment factor for study area 1. Operational environments basically deal with the way the traffic is operated and managed. The road operational environment risk factor were concluded to have been mainly influenced by number of motorcycles, number of heavy vehicles and actual speed driven in each section. In explaining the risk caused by operational environments towards car drivers, the roles of other types of vehicles are highly important. Since federal road is carrying almost all types of on-road vehicles, the implications of those vehicles in generating risk towards car drivers should not be forgotten. Generally, motorcycles and heavy vehicles posed different risks towards car-drivers which mainly caused by the size of the vehicles. This statement is supported the findings made by Tay et al. [27] who recommended that in relation to minor crashes, fatal and serious crashes were having significant associations with big size vehicles i.e. heavy vehicles.
Not only that, an existence of signalized intersection was also one of the aspects studied under road operational environments factor. Signalized intersection has ability to pose risk by changing the traffic operational flow in locations where it existed. Existence of traffic lights to manage traffic movement at intersections were very good in reducing the probability of fatal crashes [28] and also proved to have significant contributions towards number of crashes especially in reducing sideswipes and head on collisions [29]. However, the existence of the traffic lights were seen as the source of other road safety issues such as red lights runner which can definitely produce risks towards other road users.
The role of road’s infrastructure in generating risk has also been of major interest in most researches in evaluating the road safety level [30,31]. Road infrastructures were built with an aim to ease the traffic operational; however there are several conditions where existence of certain infrastructures may also be the source of risk towards road users or car drivers in this research. Only two attributes were found to be highly loaded in this factor i.e. number of lanes and percentage of road without median. Road median is generally built to separate the opposing traffic but in certain conditions, an existence of median could increase the level of severity when the vehicles collided with the raised concrete median and overturned. This situation is even more serious when lighter vehicles such as motorcycles and bicycles are involved as most crashes were probably end up as fatal crash [27].
Number of lanes is another road infrastructure aspect that has high possibility in generating risk towards car-drivers. High number of lanes conveyed a message to road users that high speeds were allowed although the posted speed limit for federal roads is only 90km/h. This finding is also supported by Rifaat et al. [28] who confirmed the effect of number of lanes towards crashes particularly head on collisions especially when the lanes are not separated with median.
Since infrastructure and operational environment condition of the road is together known as the major crash contributor for this road, these two factors should be merged together forming a single indicator to express the safety level of the road. Through calculation of composite index values, each road section within the study areas would have their own composite index value and this value represents the safety status of each road section in terms of road environment risk level; high index value shows an increase in risk and a decrease in safety status.
Besides that, when the composite index values of the continuous road sections were tabulated in the same graph, trends of road environment risk for the whole length of road could be determined. As a result, road sections having low safety status were promptly identified. Not only that, since the composite index was specifically calculated for each road environment factor, identifications of the riskiest road environment indicators in each section could be determined which guarantees the accuracy of proposed road modifications works to be carried out at correct road areas.
Due to that, REAP is developed and its contribution to crash prevention workflow by correcting the risky areas before crash could occur is very significantly huge. Based on the risk contributing factors for each road section, correct countermeasures can be rapidly executed to the problematic road sections so that spending on the unnecessary and incorrect maintenance works can be reduced. REAP also can act as smart assistant to the driver in identifying the safety level of the ahead them.
9.
Conclusion
As crash statistics is a reactive method, the new method is designed to be a proactive method where improvements to the road could be made before crashes happened. By fulfilling this gap, the evaluations of road safety status will be more accurate thus reliable outcomes could be generated. Apart from that, while most of the currently used method in evaluating road safety status is basically by calculating scores as in iRAP and Road Safety Audit method, a new method that has an ability to represent large amounts of information’s in a simple manner [23] called composite index was adopted.
REAP is program developed based on the principal of proactive road safety evaluation. It is an essential tool for the road improvement team during inspections on the road sections of the existing road networks. Based on the composite index values, road sections that require urgent improvement works, sections that have the potential to be hazardous road sections and sections having safe road environment conditions can be correctly pointed out in a short period of time.
REAP is a time-saving and cost-saving tool as it can directly recognize problematic road environment factors while planning on the best and suitable road improvement procedures for those particular sections.
References
[1] Rudin-Brown, C.M., Edquist, J. and Lenné, M.G., (2014). Effects of driving experience and sensation-seeking on drivers ’ adaptation to road environment complexity. Safety Science, 62, 121–129.
[2] Westerman, Hans L & Australia. Federal Office of Road Safety & Roads and Traffic Authority of NSW (1993). Sharing The Main Street : A Practitioner's Guide To Managing The Road Environment Of Traffic Routes Through Commercial Centres. Roads and Traffic Authority of New South Wales ; [Braddon, A.C.T.] : Federal Office of Road Safety, [Surry Hills, N.S.W]
[3] Berhanu, G. (2004). Models Relating Traffic Safety with Road Environment and Traffic Flows on Arterial Roads in Addis Ababa. Accident Analysis and Prevention, 36(5), 697–704.
[4] Pardillo-Mayora, J.M., Domínguez-Lira, C. a and Jurado-Piña, R. (2010). Empirical Calibration of A Roadside Hazardousness Index for Spanish Two-Lane Rural Roads. Accident Analysis and Prevention, 42(6), 2018–2023. [5] Ayati, E., Neghab, M.A.P, Sadeghi, A.A, Moghaddam, A.M. (2012). Introducing roadside hazard severity
indicator based on evidential reasoning approach. Safety Science, 50(7), 1618–1626.
[6] Abdulbari Bener, Fikri M. Abu-Zidan, Abdel K. Bensiali, Ahmad A. Al-Mulla, Khair S. Jadaan, 2003. Strategy to Improve Road Safety in Developing Countries. Saudi Med. Journal. 24(6), 603-608.
[7] Akmal A. (2016). Traffic Fatality Causes And Trends In Malaysia. Malaysia Sustainable Cities Program, Working Paper Series. Massachusetts Institute of Technology.
[8] Jamson, S. Wardman, M., Batley, R., Carsten, O. (2008). Developing a driving Safety Index using a Delphi stated preference experiment. Accident Analysis And Prevention, 40(2), 435–442.
[9] Assum, T and Sørensen, M., (2010). Safety Performance Indicator for alcohol in road accidents – International comparisons, validity and data quality. Accident Analysis and Prevention, 42, 595-603.
[10] Tingvall, C., Stigson, H., Eriksson, L., Johansson, R., Krafft, M., Lie, A. (2010). The Properties of Safety Performance Indicators in Target Setting, Projections and Safety Design of the Road Transport System. Accident Analysis and Prevention, 42(2), 372–376.
[11] Wang, X., Lin, H. and Chen, X. (2009). Investigation of Relationship between Level of Service and Safety. International Conference of Chinese Transportation Professionals (ICCTP) 2009, 1–7.
[12] Kononov, J and Allery, B. (2001). Level of Service of Safety: Conceptual Blueprint and Analytical Framework. Transportation Research Record 1840. Paper No. 03-2112.
[13] Hermans, E., Van den Bossche, F. and Wets, G. (2009). Uncertainty Assessment of the Road Safety Index. Reliability Engineering and System Safety, 94(7), 1220–1228.
[14] Wilmots, B. Hermans, E., Brijs, T., Wets, G. (2009). Analyzing Road Safety Indicator Data across Europe : Describing , Explaining and Comparing. Proc. of 4th IRTAD Conference, Seoul, Korea.
[15] Ghazwan A.H. (2007). Road Safety Development Index. PhD Dissertation ISBN: 978-91-85715-04-6. Linkoping University
279
[17] Radin Umar, R.S and Hussain. H. 1998. Time Series Multivariate Traffic Accidents and Fatality Models inMalaysia. Road Engineering Associations Asia and Australasia (REAAA) Journal. Pg. 15-20. January 1998. [18] Daud, N. Ibrahim, K., and Sopian, K. (2008). Hierarchical Bayesian Approach For Ranking Of Accident
Blackspots With Reference To Cost Of Accidents. Prof. of 2nd WSEAS Int. Conf on Computer Engineering And Applications (Acapulco, Mexico).
[19] Montella, A. (2003). Assessing Potential for Safety Improvement by Safety Reviews of Existing Roads., TRB Annual Meeting. 1–20.
[20] Rohayu S, Sharifah Allyana SMR, Jamilah MM and SV Wong (2012). Predicting Malaysian Road Fatalities for Year 2020, MRR 06/2012, (Kuala Lumpur: Malaysian Institute of Road Safety Research).
[21] Sayed, T. and Leur, P. De, (2000). Developing a Systematic Framework for Proactive Road Safety Planning. Proceeding of International Co-operation on Theories and Concepts in Traffic Safety (ICTCT) , 7–20.
[22] Sayed, T., Saunier, N., Lovegrove, G., and Leur, P. D. (2010). Advances in Proactive Road Safety Planning. Proceedings of the 20th Canadian Multidisciplinary Road Safety Conference (Niagara Falls, Ontario).
[23] Shekhar B. and Vedagiri, P. (2016): Proactive safety evaluation of a multilane unsignalized intersection using surrogate measures, Transportation Letters, Volume 10, No.2, 104-112, DOI: 10.1080/19427867.2016.1230172 [24] Hermans, E., Van den Bossche, F and Wets, G., 2008. Combining Road Safety Information in a Performance
Index, Accident Analysis and Prevention 40, 1337–13
[25] Ambros, J., Havránek, P., Valentová, V., Křivánková, Z.,, and Striegler, R. (2016). Identification of Hazardous Locations in Regional Road Network – Comparison Of Reactive And Proactive Approaches. Proceedings of 6th Transport Research Arena (Warsaw, Poland).
[26] Wang, F., Di. S, Liu, H, Zhang, W., (2011). Study On Driver's Subjective Perception Of Road Safety and Traffic Safety. Proc. of the International Conference of Chinese Transportation Professionals , Beijing, China.
[27] Tay R, Choi J, Kattan L and Khan A. (2011). A multinomial logit model of pedestrian-vehicle crash severity, International Journal of Sustainable Transportation, 5(4), 233-249.
[28] Rifaat S.M., Tay R and De Barros, A. (2011). Effects of street pattern on severity of crashes involving vulnerable road users, Accident Analysis and Prevention, 43, 276-283.
[29] Yasmin, S, Eluru, N, Pinjari, A.R, Tay, R. (2014). Examining Driver Injury Severity In Two Vehicles Crashes-A Copula Approach. Accident Analysis and Prevention, Volume 66. 120 – 135.
[30] Lawson, S. (2011) iRAP and EuroRAP : Crash Rate – Star Rating Comparisons. Review of Available Evidence. Working Paper Number 504.2. 1-50.