http://www.sciencepublishinggroup.com/j/ajn doi: 10.11648/j.ajn.20180404.11
ISSN: 2575-484X (Print); ISSN: 2575-4858 (Online)
Preparation, Characterization and Photocatalytic
Application of Sol-Gel Synthesis of Co Doped TiO
2
Nadarajan Suresh Babu
1, Arumugam Vijayabalan
2, *, Ramasamy Shankar
21
Department of Chemistry, Government College of Engineering, Thanjavur, India
2Department of Chemistry, St. Joseph’s College of Arts and Science (Autonomous), Cuddalore, India
Email address:
*
Corresponding author
To cite this article:
Nadarajan Suresh Babu, Arumugam Vijayabalan, Ramasamy Shankar. Preparation, Characterization and Photocatalytic Application of Sol-Gel Synthesis of Co Doped TiO2. American Journal of Nanosciences. Vol. 4, No. 4, 2018, pp. 40-45. doi: 10.11648/j.ajn.20180404.11
Received: December 31, 2018; Accepted: January 14, 2019; Published: February 26, 2019
Abstract: Nano Co doped TiO
2 prepared by simple impregnation method and characterized by powder XRD, high resolutionscanning electron micrograph, diffuse reflectance spectroscopy, photoluminescence spectroscopy and infra-red spectroscopy. DRS reveal that the absorption of TiO2 wavelength is shifted to visible region when Co2+ ion doped. PL spectra show that the
emission of light is higher and the liberation of iodine is more for Co doped TiO2 than TiO2. Application of this catalyst is
degradation of MB dye under visible light.
Keywords: Impregnation Method, Co Doped TiO
2, Visible Light, MB Dyes1. Introduction
Photocatalytic semiconductor is one of the promising techniques for the disinfection of bacteria and degradation of organic dyes [1–9]. TiO2 is an efficient for photocatalytic
application because of its exceptional electronic and optical properties, chemical stability, non-toxicity, and low cost. However, it requires UV-A light for photo activation and the overall quantum efficiency is low. In order to improve the photo efficiency of the TiO2 doped with transition metal is
being widely employed. The origin of the improved photocatalytic activity is clearly related to the efficiencies of the doping centers in trapping charge carriers and interceding in the interfacial transfer. Besides modifying the band gap, metal ions also serve as charge trapping sites and thus reduce electron–hole recombination rates. The effect of doping on the activity depends on many factors, like the type and the concentration of dopant, the method of doping, etc. One of the most promising ideas to extend the light absorbing property of TiO2 and to enhance its photocatalytic efficiency is to couple
TiO2 with a narrow band gap semiconductor. In these
circumstances, both semiconductors must have their conduction as well as valence band edges at different energy levels. Under such configuration, several advantages can be
obtained. Some is: (1) an improvement of charge separation; (2) an increase in the life time of the charge carrier; and (3) an enhancement of the interfacial charge transfer efficiency to adsorbed substrate. Some properties of TiO2 nanostructures,
like photocatalytic activity, strongly depend on the degree of crystallinity and crystalline structure, morphology, particle size, size distribution, specific surface area, surface states, and porosity [10-12]. Anatase, is regarded as the most active polymorph of TiO2, shows higher affinity to adsorb organic
molecules compared to rutile [13, 14]. Transition metal doping is favorable because of transition metal’s unique‘d’ electronic configuration and spectral characteristics of extending the absorption edge of TiO2 to the visible region [15,
16]. Doping with metal or non-metal elements could shift the light absorption edge from UV to the visible region. Thus, the photo response is enhanced by creating mid-gap energy levels in the band gap of TiO2 [17, 18]. Nonmetals such as N [19], S
[14], and B [20] and metals like Cu [21], Pt [22], Ag [23], and Fe [19, 10, 24], etc. have been studied for the promotion of photocatalytic activity of TiO2 in both UV and visible light
irradiation. Photocatalytic activity and magnetic properties of Co doped TiO2at room temperature is better than neat TiO2
[25-27]. Removal of cyanide ion by Co doped TiO2 was
2. Materials and Methods
2.1. Materials
Co (NO3)2 (Hi-media) and TiO2 (Merck) Methylene blue
dye (Merck) and Ethanol solution were used.
2.2. Preparation of Co Doped TiO2 By Impregnation Method
To 15 ml of 99.9% purity of ethanol were taken in the beaker and appropriate amount of TiO2 was added into the
ethanol solution under stirring for 30 min. 0.05g of Cobalt nitrate were added to the TiO2 containing solution also with
stirring. This mixture is evaporated at 60°C for 30 min with stirring.
2.3. Analysis
A PANalyticalX’Pert PRO diffractometer with Cu Ka rays of 1.5406 Å was employed to record the powder X-ray diffractograms (XRD) of the samples at 40 kV and 30 mA with a scan rate of 0.04°s-1 in a 2Ө range of 10–75°. The morphologies of Co doped TiO2was assessed using a FEI
Quanta 200 high resolution scanning electron microscope (HR-SEM) under highvacuum mode. The diffuse reflectance spectra were obtained with a PerkinElmer Lamda 35 spectrometer. A PerkinElmer LS 55 fluorescence spectrometer was used to record the photoluminescence (PL) spectra at room temperature. The stretching and bending vibration of atom are studied by FT-IR spectrophotometer. The doped catalyst were dispersed in carbon tetrachloride and excited at 300 nm. The decolourisation and degradation of dyes are evaluated by UV-visible spectrophotometer.
2.4. Photocatalytic Activity
The visible light photocatalytic studies were made in an immersion type photo reactor equipped with a 150-W tungsten halogen lamp fitted into a double walled borosilicate immersion well of 40 mm outer diameter with inlet and outlet
3.1. Crystal Structure
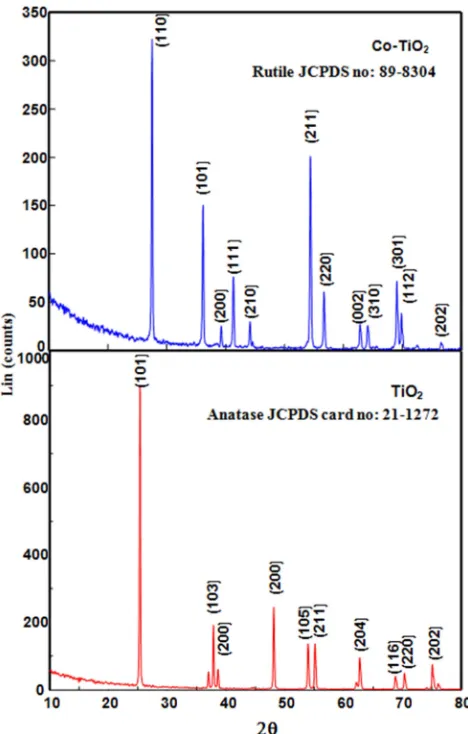
The X-ray diffraction pattern of Co-doped TiO2 are
prepared by simple impregnation method is shown in figure 1. It reveals the crystal structure of the Co doped TiO2 as
tetragonal body centered with crystal constants a andb as 0.3777 nm and c as 0.9501 nm. The diffraction pattern matches totally with the standard JCPDS pattern of rutile (89-8304). The absence of anatase lines (21-1272)in the cobalt doped TiO2; the reason is at high temperature anatase TiO2 is
converted to rutile TiO2. Further, the diffraction peaks of CoO
absence at doped TiO2. The low composition of Co may also
be a reason for the absence of CoO peak in the XRD of Co-doped TiO2. Hence it is inferred that the doping has not
resulted in substitution of the smaller Ti4+ by the larger Co2+ in the crystal lattice. Figure 1 also displays the XRD of the undoped TiO2. The diffraction pattern of the undoped TiO2
shows the presence of anatase phases only (JCPDS 21-1272). The phase percentages of anatase and rutile have been deduced from the integrated intensity of the peaks at 2θ value of 25.3° for anatase and 27.4º for rutile. The percentage of anatase is given by A (%) = 100/ {1 + 1.265(IR/IA)}, where IA is
the intensity of the anatase 101-peak at 2θ = 25.3º and IR is that
of the rutile 110-peak at 2θ = 27.4º. The phase composition thus obtained is 83% anatase. The average crystallite sizes (D) of the Co-doped TiO2 and undoped TiO2 have been obtained
from the half-width of the full maximum (HWFM) of the most intense peaks of the respective crystals using the Scherrer equation D = 0.9λ/βcosθ, where D is the average crystallite size, λ is the wavelength of X-rays used, θ is the diffraction angle and β is the full width at half maximum of the peak. The crystallite size of the Co-doped TiO2 is larger than the
undoped one and the results are presented in Table 1. The specific surface areas of the crystals have been obtained using the relationship, S = 6/ρD, where S is the specific surface area, D is the average particle size and ρ is the material density. The results are in accordance with the crystal size and are presented in Table 1.
Table 1. Crystal size (D) and Surface area (S) of TiO2and Co-TiO2.
Oxide D, nm S, m2g-1
TiO2 9.9 143
Figure 1. Powder XRD spectra of TiO2 and Co doped TiO2..
3.2. Morphology
Figure 2 High resolution scanning electron microscope (HR-SEM) shows that the TiO2 particles are spherical and
9.9nm. But Co2+ ion impregnate to TiO2 lattice agglomerate
the particles and become the 14.9.
Figure 2. HR-SEM image of Co doped TiO2.
3.3. Diffuse Reflectance Spectroscopy
The diffuse reflectance spectra of pure TiO2 and Co doped
TiO2 are shown in figure 3. In Co doped TiO2 has higher
absorption in visible region compare to bare TiO2. Figure 4
are shows that the Tauc plot for direct bandgap energy of TiO2
and Co doped TiO2 are 3.4 and 2.95 eV respectively. The
direct band gap energy of TiO2 is 3.4eV, the wavelengths of
TiO2 are shifted from UV region to visible region when Co2+
ion intercalated TiO2 lattice.
Figure 3. DRS spectra ofTiO2and Co doped TiO2.
Figure 5. PL spectra of TiO2 and Co doped TiO2.
3.4. Emission Spectroscopy
The photoluminescence (PL) spectra of the bare TiO2 and
Co doped TiO2 are shown in figure 5. Photoluminescence
occurs due to the recombination of electron–hole pair in the
stretching vibrations and bending vibrations of the O–H, respectively, which may come from the surface absorbed water. The vibrations of O–H were significantly weaker, which was related to the removal of water after calcinations during the preparation of Co doped TiO2. The weak peak at
about 514cm−1 assigned to stretching vibrations of Co–O. FT-IR results reminded the formation of a small part of Co–O bond. It was probably the existence of Co–O bond that hindered the recombination of generated photo holes and photoelectrons [42].
Figure 6. FT-IR spectra of TiO2 and Co doped TiO2.
3.6. Dye Degradation
The temporal profiles degradation of methylene blue dye by TiO2 and Co doped TiO2 under visible light is shown in figure
7. The Co doped TiO2 is more efficient photocatalytic
degradation of methylene blue dye than TiO2. This might be
due to trapping photo-excited electrons at conduction band by decreasing the electron-hole recombination as a consequence of Co dopant into TiO2 environment. Doping has regulated the
degradation occurred by exhibiting the highest photo catalytic degradation efficiency in methylene blue dye. This is because
the incorporated Co atom acts as electron traps by suppressing the recombination of photo-generated holes and electrons. Both superoxide radicals and hydroxyl radicals are responsible degradation of methylene blue dye. Figure 8 are shows that photocatalytic mechanism for organic dye.
3.7. Oxidation of Iodide Ion
Figure 9 Shows that liberation of iodine from oxidation of iodide ion solution by Co doped TiO2 more enhancement than
Figure 7. Time profile degradation of MB dye under visible light.
Figure 8. Mechanism of degradation of organic dye by Co doped TiO2 under visible light.
Figure 9. Photocatalytic oxidation of iodide ion by TiO2 and Co doped TiO2.
4. Conclusions
The Co doped TiO2 prepared by impregnation method.
DRS show that the optical edge of TiO2 is shifted to visible
region when Co2+ ion doped. PL reveals that the Co doped TiO2 lattice more emission of light due to crystal defect and
less emission of light for TiO2 due to enhance the crystallinity.
Application of this catalyst is degradation of MB dyes under visible light.
References
[1] J. A. Rengifo-Herrera, C. Pulgarin, Sol. Energy, 84, 37 (2010).
[8] C. Karunakaran, G. Abiramasundari, P. Gomathisankar, G. Manikandan, V. Anandi, J. Colloid, Interface Sci. 352, 68, (2010).
[9] C. Karunakaran, A. Vijayabalan, G. Manikandan, P. Gomathisankar, Catal. Commun. 12, 826, (2011).
[10] H.-J. Lin, T.-S. Yang, C.-S. Hsi, M.-C. Wang, K.-C. Lee, Ceram. Intern. l, 40, 10633-10640, (2014).
[11] M. Rashad, E. Elsayed, M. Al-Kotb, A. Shalan, J Alloys and Compounds, 581, 71-78, (2013).
[12] J.-Y. Park, K.-I. Choi, J.-H. Lee, C.-H. Hwang, D.-Y. Choi, J.-W. Lee, Mater. Lett., 97, 64-66(2013).
[13] M. Nasir, S. Bagwasi, Y. Jiao, F. Chen, B. Tian, J. Zhang, Chem. Eng., J, 236, 388-397(2014).
[14] C. McManamon, J. O'Connell, P. Delaney, S. Rasappa, J. D. Holmes, M. A. Morris, J Mol. Catal. A: Chemical, 406, 51-57, (2015).
[15] A. Siddiqa, D. Masih, D. Anjum, M. Siddiq, J Environ. Sci., 37, 100-109, (2015).
[16] Y. Wang, R. Zhang, J. Li, L. Li, S. Lin, Nano. Res. Let., 9,1-8, (2014).
[17] J. Wang, Y. Zhao, T. Wang, H. Li, C. Li, PhysicaB: Cond., Matter, 478, 6-11, (2015).
[18] L. Samet, J. B. Nasseur, R. Chtourou, K. March, O. Stephan, Mat. Character. 85, 1-12, (2013).
[19] S. Larumbe, M. Monge, C. Gómez-Polo, Appl. Surf. Sci., 327, 490-497, (2015).
[20] S. In, A. Orlov, R. Berg, F. García, S. Pedrosa-Jimenez, M. S. Tikhov, D. S. Wright, R. M. Lambert, J Amer. Cemical. Society, 129, 13790-13791, (2007).
[21] F. Gonell, A. V. Puga, B. Julián-López, H. García, A. Corma, Appl. Catal. B: Environ. 180, 263-270, (2016).
[22] Y. Hu, X. Song, S. Jiang, C. Wei, Chem. Eng. J., 274, 102-112, (2015).
Thin Solid Films516, 3776, (2008).
[28] Elham S. Baeissa, J. Ind. Eng., Chem., (2014)
[29] P. N. Kapoor, S. Uma, S. Rodriguez, K. J. Klabunde, J. Mol. Catal. A Chem. 229, 145–150, (2005).
[30] M. A. Barakat, H. Schaeffer, G. Hayes, S. Ismat-Shah, Appl. Catal. B 57, 23–30 (2005).
[31] Q. J. Yang, H. Choi, Y. J. Chen, D. D. Dionysiou, Appl. Catal. B 77, 300–307 (2008).
[32] M. A. Barakat, H. Schaeffer, G. Hayes, S. Ismat-Shah, Appl. Catal. B: Environ. 57, 23–30, (2005).
[33] R. Amadelli, L. Samiolo, A. Maldotti, A. Molinari, M. Valigi, D. Gazzoli, Int. J. Photo., 2008, 1–9, (2008).
[34] P. N. Kapoor, S. Uma, S. Rodriguez, K. J. Klabunde, J. Mol. Catal. A: Chem. 229, 145–150, (2005).
[35] D. B. Hamal, K. J. Klabunde, J. Phys. Chem. C 115, 17359– 17367(2011).
[36] M. Iwasaki, M. Hara, H. Kawada, H. Tada, S. Ito, J. Colloid Interface Sci. 224, 202–204, (2000).
[37] S. N. R. Inturi, T. Boningari, M. Suidan, P. G. Smirniotis, Appl. Catal. B: Environ. 144, 333–342(2014).
[38] B. Qi, Y. Yu, X. He, L. Wu, X. Duan, J. Zhi, Mater. Chem. Phys. 135,549–553, (2012).
[39] I. Ganesh, A. K. Gupta, P. P. Kumar, P. S. C. Sekhar, K. Radha, G. Padmanabham, G. Sundararajan, Mater. Chem. Phys. 135, 225–234, (2012).
[40] Q. Chen, F. Ji, T. Liu, P. Yan, W. Guan, X. Xu, Chem. Eng. J. 229, 57–65, (2013).
[41] J. Wang, Y. Lv, Z. Zhang, Y. Deng, L. Zhang, B. Liu, R. Xu, X. Zhang, J. Hazard. Mater. 170, 398–404(2009).