http://www.sciencepublishinggroup.com/j/ajn doi: 10.11648/j.ajn.20170302.11
Morphological and Optical Properties of Pure and Mg
Doped Tin Oxide Thin Films Prepared by Spray Pyrolysis
Method
Abdul Rahman Abdul Aziz Sakhta
*, Ahmad Hamed Khdro, Ali Naji Darwisho
Department of Physics, Faculty of Science, Tishreen University, Latakia, Syria
Email address:
abdul-rahman.sakhta@hotmail.com (A. R. A. A. Sakhta)
*
Corresponding author
To cite this article:
Abdul Rahman Abdul Aziz Sakhta, Ahmad Hamed Khdro, Ali Naji Darwisho. Morphological and Optical Properties of Pure and Mg Doped Tin Oxide Thin Films Prepared by Spray Pyrolysis Method. American Journal of Nanosciences. Vol. 3, No. 2, 2017, pp. 19-23.
doi: 10.11648/j.ajn.20170302.11
Received: February 8, 2017; Accepted: March 1, 2017; Published: May 8, 2017
Abstract:
Pure Tin Oxide (SnO2) and Magnesium (Mg) doped SnO2 thin films have been deposited onto glass substrates byspray pyrolysis technique at the substrate temperature of 450°C. The doping concentration of Mg was varied from 1 to 9 wt% (with 2 wt% step) while all other deposition parameters such as substrate temperature, spray rate, carrier gas pressure and distance between spray nozzle to substrate were kept constant. The surface morphology and optical properties of the deposited thin films have been studied by Scanning Electron Microscopy (SEM) and UV visible spectroscopy. Average optical transmittance in the 400–900 nm range varies from 18.21% to 58.99% with varying Mg concentration in the film. Maximum band gap value of 3.90 eV is obtained for undoped SnO2.
Keywords:
Thin Films, Spray Pyrolysis, Mg Doped Tin Oxide, Optical Properties, Scanning Electron Microscope1. Introduction
In recent years, there has been considerable interest in metal oxides because of their many industrial applications, especially transparent conducting oxides (TCO). Tin oxide belongs to a transparent conductive oxide (TCO) family which are the most studied [1]. Transparent conducting oxides are semiconductors produced from a combination of metal and Oxygen. The study of SnO2 transparent conducting
oxide thin films are important due to its unique attractive properties like high optical transmittance, uniformity, nontoxicity, good electrical, low resistivity, chemical inertness, stability to heat treatment, mechanical hardness, piezoelectric behavior, and its low cost. So, SnO2 is used in
solar cells, sensor gas, display devices and in other important applications [2-3].
Tin Oxide is an n-type semiconductor with wide band gap energy (Eg = 3.5-4 eV) [4]. Tin Oxide has a tetragonal
structure. Its unit cell contains two Tin and four Oxygen atoms as is shown in Figure 1. The Tin atom is at the center of six Oxygen atoms placed at the corners of a regular octahedron. Every Oxygen atom is surrounded by three Tin
atoms at the corners of an equilateral triangle [5, 6].
The structure of this material in its bulk form is tetragonal with lattice parameters of a = b = 4.737 A° and c = 3.186 °A. However, in thin film form, depending on the deposition technique, its structure can be polycrystalline or amorphous. The grain size is highly dependent on the deposition technique, substrate temperature, post heat treatment and doping level [8].
So nowadays we notice the importance of thin films in our practical life and from this point many techniques in depositing thin films have appeared with high Accurate qualities such as: thermal vacuum evaporation, sputtering, pulsed laser ablation, chemical vapor deposition, chemical bath, dip coating, spin coating and spray pyrolysis [9]. The spray pyrolysis is the simplest, cheapest alternative method to manufacture thin films that is used in industrial applications [10]. There are many characteristics of this method such as: it is suitable for preparing doped and pure thin films because of their simple experimental manufacturing, we can prepare films from high melting temperature materials that we can’t prepare in other methods, economic technique because the used devices don’t need vacuum or complicated devices, we can add several dopants that are different in concentration, we can change deposition factors (type of used substrates – temperature of substrate – composition of solution – flow rate solution – distance between the spray nozzle and substrate) to get films that have special electrical and optical properties [11].
2. Experimental Procedure
The undoped and Mg doped SnO2 thin films were deposited
by using a homemade spray pyrolysis apparatus in Albaath university. Starting solution of SnO2 was prepared by dissolving
1M Stannous Chloride (SnCl4, 99%, Merck, Germany) in 25 ml
of Ethanol (C2H6O, 99.8%, Sigma-Aldrich, Germany) and
distilled water with ratio 7/3 (7 for distilled water and 3 for Ethanol) and with adding few drops of HCl in this solution. For Mg doping, Magnesium Chloride (MgCl2, 98%, Riedel-de haen,
Germany) was dissolved in solution as dopant material source. In order to grow undoped and Mg doped SnO2 films varied
from 1 wt% to 9 wt% by weight percentage (with 2 wt% step), the necessary amounts of these solution were prepared. All spray solutions were stirred to obtain homogenous solutions. The resultant solutions were sprayed on glass substrates (Citoglas, 7.5cm * 2.5cm * 0.1cm). The glass substrates were rinsed with HCl and then cleaned with ethanol. Finally, they were cleaned with distilled water by using an ultrasonic cleaner (Trans sonic 700/H) and then dried with air compressor.
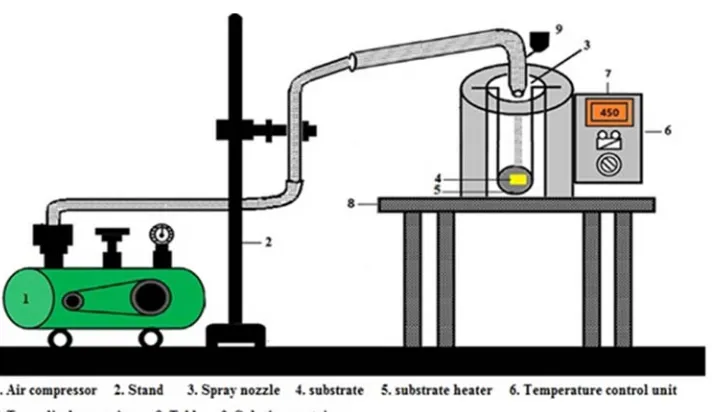
Figure 2 shows the schematic diagram of the spray pyrolysis apparatus. The substrate temperature was fixed as 450°C on hot plate and controlled by temperature control unit. The nozzle to substrate distance was 25 cm and the time for the film deposition was about 15 min. after the deposition operation, the substrates was kept cooled at room temperature. All experiments were done under approximately similar conditions.
Figure 2. Schematic diagram of the spray pyrolysis apparatus.
A close control of the spraying parameters such as doping, substrate temperature, uniformity of temperature throughout the substrate etc., produces films with the required properties like high visible transmittance and low resistivity.
Generally in spray pyrolysis, the chemical reaction of thin film formation of SnO2 is as follows [12]:
SnCl4 + 2H2O → SnO2 + 4HCl (1)
3. Results and Discussion
3.1. Optical Properties
transparency of SnO2:Mg thin films with various Mg-doping
levels, six samples (0, 1, 3, 5, 7 and 9 wt%) were selected and then their optical spectra in the VIS–NIR region were measured (400 – 900 nm). The optical transparency and absorbency of SnO2:Mg thin films for various Mg-doping
levels are shown in Figure 3 and Figure 4 respectively.
Figure 3. Optical transmission spectra of the SnO2:Mg films.
Figure 4. Optical absorption spectra of the SnO2:Mg films.
The average optical transmittance of samples in the wavelength region (400–900 nm) decreases with values (58.99%, 53.34%., 45.14%, 25.44%, 22.63%) by increasing Mg – doping level (0, 1, 3, 7, 9 wt%) respectively, except Mg-doping level 5wt% (18.21%).
The interpretation as the film with 5wt% doping level which has the lowest transmittance and the highest absorbance will be explained by scanning electron microscope graphs.
The optical absorbance values are calculated using the relation [13]:
A=Log(1/T) (2)
Optical band gap (Eg) of SnO2 and Mg: SnO2 thin films
was estimated using the relation in the region [300-900 nm] [13]:
(αhν)2 = A(hν – Eg) (3)
where A is a constant, α is the absorption coefficient and hν is the photon energy.
The absorption coefficients (α) were determined by means
of the optical transmittance spectra using the relation [14]:
α =(1/d)ln(1/T) (4)
where d is the thickness and T is the transmittance of the film at a particular wavelength.
The direct allowed transition energy of the prepared films was estimated from the plot drawn between (αhν)2 and energy of the photon by extrapolating in order to extend the linear portion of the curve to reach the photon energy axis. The Eg values are in the range of 3.76–3.90 eV (Figure 11).
The optical band gap of undoped SnO2 thin film is 3.90 eV
and it decreases with increasing Mg doping concentration except 5wt% doping level whereupon Eg increases up to
3.88eV and then it decreases gradually again (5 to 9 wt%). Undoped SnO2 thin film has the maximum band gap (3.90
eV) and the low band gap (3.76 eV) is obtained for 9 wt% Mg:SnO2 thin film.
Figure 5. The variation of (αhν)2 versus hν for undoped SnO 2 film.
Figure 6. The variation of (αhν)2 versus hν for Mg:SnO
2 (1wt%) film.
Figure 7. The variation of (αhν)2 versus hν for Mg:SnO
Figure 8. The variation of (αhν)2 versus hν for Mg:SnO
2 (5wt%) film.
Figure 9. The variation of (αhν)2 versus hν for Mg:SnO
2 (7wt%) film.
Figure 10. The variation of (αhν)2 versus hν for Mg:SnO
2 (9wt%) film.
Figure 11. The variation of optical band gap with different concentrations of Mg dopant.
3.2. SEM Analysis
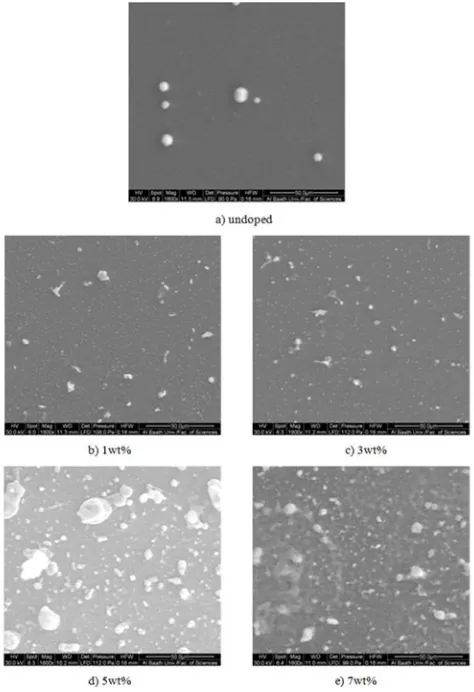
The undoped and Mg doped SnO2 thin films were studied
by scanning electron microscope (Quanta 200) with magnification 1600x. SEM micrographs of undoped and Mg
doped SnO2 thin films are shown in Figure 12.
Figure 12. SEM micrographs of (a) undoped, (b) 1 wt%, (c) 3 wt%, (d) 5 wt%, (e) 7 wt% Mg doped SnO2 thin films.
It can be observed from Figure 12, Figure 3 and Figure 4 with increasing grains size that the transmittance decreases and the absorbance increases. This explains the fact that 5wt% film has the lowest transmission and the highest absorption.
4. Conclusions
Effect of Mg-doping on the properties of SnO2 thin films
prepared by the spray pyrolysis method was studied by varying the dopant concentration. The Mg-doped SnO2 films
were deposited on glass substrates with dopant concentrations ranging from 0 to 9 wt% (with 2 wt% step). The average transmittance of the undoped and doped SnO2
films decreases with increasing Mg concentration except 5wt% doping level. The optical band gap of undoped SnO2
thin film is 3.90 eV and it decreases with increasing Mg doping concentration except 5wt% doping level where Eg
References
[1] M. BENHALILIBA, C. E. BENOUIS, Y. S. OCAK, F. YAKUPHANOGLU (2012), “Nanostructured Al Doped SnO2
Films Grown onto ITO Substrate via Spray Pyrolysis Route”,
Journal of Nano- and Electronic Physics, Vol. 4, No. 1, pp. 1-3.
[2] S. S. ROY, J. PODDER (2010), “Synthesis and optical characterization of pure and Cu doped SnO2 thin films
deposited by spray pyrolysis”, Journal of Optoelectronics and Advanced Materials, Vol. 12, No. 7, pp. 1479-1484.
[3] TURGUT G., KESKENLER E. F., Aydin S., SONMEZ E., DOGAN S., DUZGUN B., ERTUGRUL M. (2013), “Effect of Nb Doping on Structural, Electrical and Optical Properties of Spray Deposited SnO2 Thin Films”, Super lattices and
Microstructures, 56, pp. 107-116.
[4] GANDHI T., BABU R. & RAMAMURTHI K. (2013) “Structural, Morphological, Electrical and Optical Studies of Cr Doped SnO2 Thin Films Deposited by The Spray Pyrolysis
Technique”, Materials Science in Semiconductor Processing, 16, pp. 427-479.
[5] JARZEBSKI Z. & MARTON J. (1976) “Physical Properties of SnO2 Materials”, Journal of the Electrochemical Society,
pp. 199-205.
[6] KHANAA V. & MOHANTA K. (2013) “Synthesis and Structural Characterization of SnO2 Thin Films Prepared by
Spray Pyrolysis Technique”, International Journal of Advanced Research, 1 (7), pp. 666-669.
[7] RAÜL DÍAZ DELGADO, “Tin Oxide Gas Sensors: An Electrochemical Approach”, Ph. D Thesis, Universitat De Barcelona, 2002.
[8] MOHAMMAD-MEHDI BAGHERI-MOHAGHEGHI,
MEHRDAD SHOKOOH-SAREMI (2004) “Electrical, Optical and Structural Properties of Li-Doped SnO2
Transparent Conducting Films Deposited by The Spray Pyrolysis Technique: a Carrier-Type Conversion Study”,
Semiconductor Science and Technology, 19, pp. 764-769. [9] A. R. BABAR, S. S. SHINDE, A. V. MOHOLKAR, C. H.
BHOSALE, J. H. KIM, K. Y. RAJPURE (2010) “Structural and Optoelectronic Properties of Antimony Incorporated Tin Oxide Thin Films”, Journal of Alloys and Compounds, pp. 416-422.
[10] VIJAYALAKSHMI S., VENKATARAJ S., Subramanian M., JAYAVEL R. (2008) “Physical Properties Of Zinc Doped Tin Oxide Films Prepared by Spray Pyrolysis Technique”, Journal of Physics D: Applied Physics, 41, pp. 210-216.
[11] PEREDNIS D. & GAUCKLER L. (2005) “Thin Film Deposition Using Spray Pyrolysis”, Journal of Electroceramics, 14, pp. 103-111.
[12] BABAR A. & RAJPURE K. Y. (2015) “Effect of Intermittent Time on Structural, Optoelectronic, Luminescence Properties of Sprayed Antimony Doped Tin Oxide Thin Films”, Journal of Analytical and Applied Pyrolysis, 112, pp. 214-220. [13] T. INDIRA GANDHI, R. RAMESH BABU, K.
RAMAMURTHI, M. ARIVANANDHAN (2016) “Effect of Mn Doping on The Electrical and Optical Properties of SnO2
Thin Films Deposited by Chemical Spray Pyrolysis Technique”, Thin Solid Films, 598, pp. 195-203.
[14] SIBEL GÜRAKAR, TÜLAY SERIN, NECMI SERIN (2014) “Electrical and microstructural properties of (Cu, Al, In)-doped SnO2 films deposited by spray pyrolysis”, Advanced
![Figure 1. Unit cell of crystalline structure of SnO2. big circles represent Oxygen atoms and small circles represent Tin atoms (from [7])](https://thumb-us.123doks.com/thumbv2/123dok_us/8466583.1710062/1.595.312.543.549.722/figure-crystalline-structure-circles-represent-oxygen-circles-represent.webp)