Evaluation of Edge Electron Temperature Fluctuation by the Use
of Fast Voltage Scanning Method on TST-2
∗
)
Yoshihiko NAGASHIMA, Akira EJIRI, Yuichi TAKASE, Masateru SONEHARA,
Hidetoshi KAKUDA, Takuya OOSAKO
1), Junichi HIRATSUKA, Osamu WATANABE,
Takashi YAMAGUCHI, Hiroaki KOBAYASHI, Takuma WAKATSUKI, Takuya SAKAMOTO,
Kentaro HANASHIMA, Takanori AMBO, Ryota SHINO and Shigeru INAGAKI
2)The University of Tokyo, Chiba 277-8561, Japan
1)CEA, Saint Paul Lez Durance 13108, France 2)Kyushu University, Kasuga 816-8580, Japan
(Received 5 December 2010/Accepted 2 February 2011)
Edge electron temperature fluctuation is evaluated by the use of fast voltage sweeping technique on TST-2. The validity of obtained current-voltage characteristic curve was checked by comparing the time evolutions of floating potential between that obtained from the fast voltage sweeping technique and that measured with floating probe method. Good agreement between them was confirmed. We also found that fitting errors in the evaluation of the electron temperature itself are less than 10% of fluctuation levels of the electron temperature. Therefore the accuracy of the technique is applicable to study of plasma fluctuations.
c
2011 The Japan Society of Plasma Science and Nuclear Fusion Research Keywords: plasma turbulence, temperature fluctuation, edge plasma DOI: 10.1585/pfr.6.2402036
1. Introduction
Development of fast, fine and precise electron temper-ature measurement technique in edge plasmas is important for fusion plasma research. In particular, transport caused by temperature gradient driven turbulence (i.e., ion tem-perature gradient turbulence) is believed to be significant in high performance fusion plasmas. There are many pre-vious work on the electron temperature fluctuation with combination of Langmuir probes and complicated circuits [1–7]. In this paper, we propose an approach to estimate the turbulent electron temperature fluctuation in the TST-2 spherical tokamak [8]. The approach focuses on fast volt-age sweep method applied to a single Langmuir probe to maintain fine spatial resolution; a triple probe technique was not used. Unlike the previous work, the circuit used in this experiment is simple, and is not a novel technique. In-stead, we have tested validity of the method by comparing fluctuations measured with two different methods. Here we show preliminary waveforms of plasma fluctuations (fluc-tuations of electron temperature ˜Te, electron density ˜ne,
and plasma potential ˜Φp) measured with the fast voltage
sweep method. In addition, the comparison of the float-ing potential fluctuations ( ˜Φf) between measured with the
fast voltage sweep method and measured with the float-ing probe method to confirm that the fast voltage sweep method used in this experiment is valid. The comparison
author’s e-mail: [email protected]
∗)This article is based on the presentation at the 20th International Toki Conference (ITC20).
is a novel point in this paper. First, we describe the exper-imental setup in TST-2. Second, we give an example of preprocessing of probe current data before fitting them to a model I-V function. Third, we show an example of fitting procedure of the I-V data to the model. Finally, we com-pare ˜Φfs measured with the two methods, and discuss the
results.
2. Experimental Setup
TST-2 is a small spherical tokamak device with ma-jor radius R0 ∼ 0.38 m, minor radius a ∼ 0.25 m
(as-pect ratioA ≥ 1.5), elongationκ ≤ 1.2-1.8, and toroidal magnetic fieldBt≤0.3 T. Typical plasma parameters are:
plasma currentIp ≤ 200 kA, line-averaged electron
den-sityne≤2×10¹⁹m−3, and electron temperature at plasma
centerTe,0=100-300 eV. There are two kinds of operation
in TST-2: One is ohmically heated discharge with/without auxiliary rf heatings at the ion cyclotron (21 MHz) and lower-hybrid (200 MHz) range of frequency [9, 10]. The other is electron cyclotron heating (ECH) discharge [11]. Plasmas in this experiment are produced by ohmic heating without rf injection. The low-field side boundary of the plasmas is determined by the limiter (R=0.63 m) attached to the rf antenna.
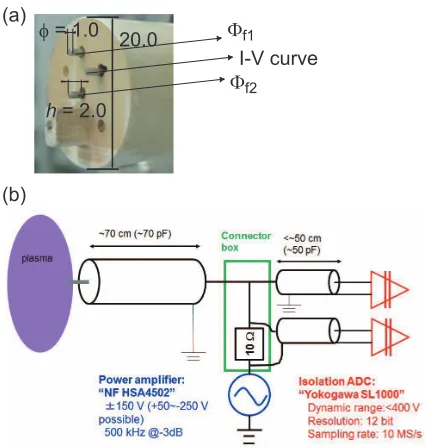
Experimental data were obtained by a multi-channel Langmuir probe (LP) [12]. The LP is located at a toroidal angle ofφ=−165◦relative to the toroidal location of the rf antenna, and is radially movable. Figure 1 (a) shows pho-tograph of the head of the LP and assignment of the
elec-c
Fig. 1 (a) Photograph of Langmuir probe and usage of elec-trodes. (b) Schematic of data acquisition circuit.
trode usage for the experiment. We use three electrodes. One electrode is used to obtain I-V curves by applying a sweeping sinusoidal bias voltage at 200 kHz, from which the local electron temperatureTecan be derived. Power
spectrum of edge turbulent fluctuations observed on TST-2 has a maximum at a few tens kHz with the same order of frequency bandwidth. Therefore, the sweep frequency of 200 kHz is sufficient to measure the edge turbulence on TST-2. The other two electrodes measure the floating po-tentials (Φf) by floating probe technique. By the use of
the twoΦf data, we calculate the interpolatedΦf (Φf,i) at
the location where the I-V curves are measured to be tem-porally compared withΦf measured with the fast voltage
sweeping method. We set the radial location of the LP at
r = −20 mm, whererrepresents the radial location rela-tive to the low-field side limiter, and posirela-tive and negarela-tive
rindicate outside and inside the limiter location. Duration time of plasmas in this experiment is about 20 ms, and we selected data for analysis when the low-field side of the plasma was bound by the limiter (20-30 ms).
Acquisition of reliable I-V curves is a key issue to ob-tainTefluctuation. When large bias voltage is applied to
probe electrical circuit at high sweeping frequency, large capacitive current passes through the cable capacitance, and significantly distorts the raw probe current data from plasmas. On the contrary, the sheath capacitance is an or-der of 1 pF and is negligible. In previous work, combina-tion of dummy probes and differential amplifiers has been used to subtract the capacitive current from the raw probe data. To avoid complexity of circuits, we don’t use com-bination of the dummy probe and differential amplifier in this experiment. Instead, diagnostic systems are assem-bled close to each other to minimize length of the cable drive and the capacitive current (Fig. 1 (b)). The electrode
Fig. 2 Preprocessing of waveforms before I-V curve fitting pro-cedure. (a) Waveform of raw probe current before plasma discharge (black), and estimation of capacitive current from derivative of sweep voltage at the same period (red). (b) Waveform of raw probe current during plasma dis-charge (black), and estimation of capacitive current from derivative of sweep voltage waveform at the same period (red). (c) Waveform of the corrected probe current sub-tracted by the estimated capacitive current (preprocess-ing). In (c), asymmetry of the probe current between at dV/dt>0 and at dV/dt<0 seen in (b) disappears in the preprocessed waveform in (c).
is directly connected to coaxial cable with the length of
∼70 cm (cable capacitance∼70 pF) leading to coaxial vac-uum feedthrough. The outer conductor is connected to the vessel ground at the feedthrough (the connection is con-trollable). The small connector box including a shunt re-sister (∼10Ω) for the probe current measurement is di-rectly connected to the feedthrough. The fast sweep volt-age is supplied to the connector box through coaxial cables with the length of less than 50 cm. The power amplifier as voltage supplier is HSA4052 (manufactured by NF corpo-ration, Japan), which can supply voltage of−250 to+50 V (2 A rms) swept at 500 kHz (−6 dB). We measure the probe current at the shunt resister and the voltage at the exit of the vacuum feedthrough by using an Analog-Digital Converter (SL1000 manufactured by Yokogawa Meter and Instru-ments Inc., Japan) through both cable drives of less than 50 cm. The ADC has 16 channels, and can measure volt-age up to 400 V with the analog bandwidth up to 3 MHz. The maximum sampling rate is 10 MHz, thus, number of data points at an I-V curve is 25. Channels of the ADC are electrically isolated from one another, and resolution of voltage (dynamic range) is easily tunable in each chan-nel. Therefore, we can directly measure large amplitude swept voltage signals and small amplitude current wave-forms at the same sampling clock. In addition, the inde-pendent floating potentials (Φf1andΦf2) can be measured
by the ADC simultaneously.
3. Data Analysis Procedure
Fig. 3 I-V characteristic curves at different 9 periods (regular 1 ms intervals). In each plot, contiguous two I-V curves at dI/dt>0 and at dI/dt<0 during a sinusoidal cycle of voltage sweep are overploted. Hysteresis, asymmetry of I-V curves between at dI/dt>0 and at dI/dt<0, is not observed at any time. This indicates that the asymmetry is originated from temporal variation of plasmas.
current from plasmas is not negligible nevertheless the ef-fort to minimize the cable capacitance. The superposition causes hysteresis of I-V curves, leading significant errors in evaluation ofTe. Therefore, next we perform
prepro-cessing of the raw current data before calculatingTeby the
fitting procedure. We estimate the capacitive current from derivatives of the voltage data, and the estimated capacitive current is subtracted from the raw probe current. Validity of the estimated capacitive current is checked by compar-ison with the raw probe current before plasma production (no current from plasmas). The preprocessing is shown in Fig. 2. Figure 2 (a) shows the comparison between the es-timated capacitive current (red) and the raw probe current (black) before plasma production. Plasma current starts up at about 15 ms in typical TST-2 operations. Good agree-ment between the two waveforms is observed, and validity of the estimation is responsible to application of the es-timation to the subtraction of the estimated capacitive cur-rent from the raw probe curcur-rent. The subtraction is demon-strated in Figs. 2 (b, c). In Fig. 2 (b), the raw probe current (black) shows clear asymmetry between at dI/dt >0 and at dI/dt < 0, and the estimated capacitive current (red) is not negligible relative to the raw probe current. How-ever, the asymmetry may drastically vanish after the sub-traction, shown in Fig. 2 (c). The hysteresis mainly caused by the asymmetry is checked in a number of period, shown in Fig. 3 (9 periods at regular 1 ms intervals). The hys-teresis is sometimes observed, however, is not at any time. The asymmetry constantly occurs when the subtraction is incomplete and/or the ion polarization drift current is not negligible. Therefore, the negligible asymmetry demon-strates that the subtraction looks like work well.
After the preprocessing, another key issue to obtain
Fig. 4 Example of I-V curve measured at∼ 24 ms. (a) Linear plot of an I-V curve. Thick and thin black diamonds indi-cate data points used in the fitting procedure and all data points, respectively. We use data pointsV < Φf+2Tein the fitting procedure. Red line means fitted curve. Here, Teof 20.0±0.14 eV andneof 0.63±0.035×10¹⁸m−3 are obtained. (b) Logarithmic plot of the I-V curve at the same period as that in (a). In (b), current data is subtracted by ion saturation current. Electron decelera-tion range looks like consistent with the fitted curve. (c) Voltage data points (black) and temporal variation ofΦf,i measured simultaneously (red). The temporal variation is included in errors of the fitting procedure. (d) Current data (black) and the fitted current (red).
Teis the fitting procedure that the obtained I-V curve is
fitted to the model I-V curve within some errors. Then,
Te, electron densityne, Φf, and plasma potentialΦp are
derived from the fitted I-V curve. The model I-V curve is chosen as,
I=Ii,sat(Vprobe)+Ie,satexp
Vprobe−Φplasma
Te
, (1)
Ii,sat(Vprobe)=Ii,sat,0(1−aVprobe), (2)
whereIi,sat(Vprobe) is an indicator of the ion saturation
cur-rent, Ie,sat is the electron saturation current, Vprobe is the
voltage applied to the electrode,Φplasmais the plasma
po-tential,Teis the electron temperature [eV], andais a
co-efficient representing dependence of the ion saturation cur-rent range on the applied voltage. The voltage is based on the vessel ground. The dependence of the ion satura-tion current range on the applied voltage may be originated from the finite size of sheath surface of the electrode used, and we often obtain reliable fitted result by including the dependence. Here, the ion saturation currentIi,satis defined
asIi,sat(Vprobe=Φf) to obtainne, andΦplasma=Φf+2.94Te
considering that the deuteron mass and difference of parti-cle collection area between electrons and ions.
and several points. Therefore, we combine two contiguous I-V curves to compensate small amount of data points in the electron deceleration range, leading to decrease of er-ror in evaluation ofTe. There are mainly two error sources
in evaluation ofTefrom the fitting procedure. One is
vari-ance of data in the fitting procedure itself, and the other is variance in selecting data range used in the fitting pro-cedure. The former error includes effect of the temporal variation of plasma parameters, and reflects variance in the fitting procedure. The latter error is complicated. When we choose the fitting range in the vicinity ofΦf,Tetends to be
higher thanTeobtained from the range including the
elec-tron deceleration area. A candidate for the reason is dis-tortion of electron distribution function in high energy part by the electron tail. On the contrary, when the fitting range is close to the electron saturation current, the evaluatedTe
also tends to be high because of discrepancy between the model and the data used in fitting. In this analysis, we choose the fixed fitting range ofVprobe < Φf+∼ 2Te
un-der which we typically obtain the minimum variance be-tweenΦf observed by the fitting procedure andΦf,i. In
addition, we observed the minimumTeduring scan of the
fitting range in the fitting procedure using the same data set. It should be noted that the fitting range is fixed in the fitting procedure of this paper.
4. Preliminary Waveforms of Plasma
Quantity Derived from the Fitting
Procedure
Using the fitting procedure, we obtained preliminary waveforms that are required to estimate fluctuations. In ad-dition, we compareΦf measured with the two methods to
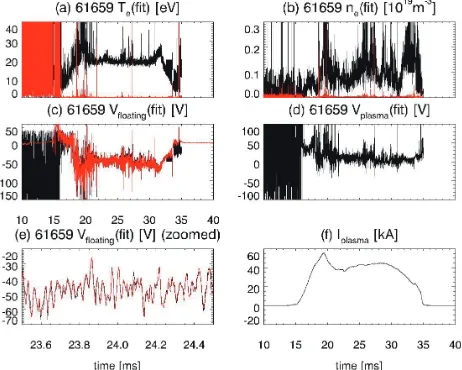
Fig. 5 Waveforms derived by results from fast voltage sweep method. Plots in black indicate fitted parameters. (a)Te, (b)ne, (c)Φf, (d)Φp, and (e) enlarged view of theΦf. (f) Discharge plasma current. In (a) and (b), plots in red in-dicate errors in fitting. In (c) and (e), plots in red inin-dicate
Φf,is derived fromΦf1andΦf2. In (e), good agreement between the fittedΦfandΦf,iis observed.
confirm the validity of the fitting procedure. Figures 5 (a-e) show waveforms obtained from the fitting procedure as well as plasma toroidal current (Fig. 5 (f)). In Figs. 5 (a, b),Teand density in black are obtained much higher than
their errors in red. Fluctuation levels of Te ∼10% are
smaller than those ofne> 20%. The errors ofTeandne
are less than 1% and 5%, respectively. Figure 5 (c) demon-strates the comparison ofΦfs measured with the I-V curves
(black) and with the floating probe method (red) during whole of discharge duration. TheTefluctuation observed
here is small relative to the ˜Φf, therefore,Φp fluctuation,
shown in Fig. 5 (d), seems to be dominated by ˜Φf.
En-larged view of Fig. 5 (c) in the vicinity of 24 ms is shown in Fig. 5 (e), and good agreement between them is observed. This agreement confirms that the fitting procedure works well in the case.
We have evaluated quantitatively the fluctuations of the electron temperature and plasma potential in a case. Standard deviations ofTe,Φf, andΦpduring 22-25 ms in
Fig. 5 are 1.4 eV, 8.0 V, and 7.9 V, respectively. The vari-ance ofΦp,σ2plasmacan be written as,
σ2
plasma =(σfloat+2.9σtemp)2
∼ σ2
float +5.9σfloatσtemp +8.6σ2temp ,
(3) where indicates ensemble average,σ2
floatandσ 2 tempare
the variances of the floating potential and electron temper-ature, andσfloatσtempis the covariance between the floating
potential and electron temperature, respectively. A Result ofσ2
float(64.0) ∼ σ 2
plasma(62.0) was obtained. A possible
reason for the result is that summation of the second and third terms is much smaller than the first term on the right-hand side in this case.
For future work, a few problems should be resolved. First, the fitting procedure fails in some periods in a dis-charge, therefore, stability of convergence of the fitting procedure should be improved. Next, accuracy of Φf,i
should be confirmed. When we focus on the minimum variance betweenΦf measured with the fitting procedure
andΦf,iin evaluation ofTe, values ofTeare also affected
by the targetΦf,i. The most relevant procedure should be
found. Finally, the results thatσ2 float ∼ σ
2
plasmashould be
tested in detail. In previous work, the relationship that σ2
float∼σ 2
plasmais not the universal result, but may be a
spe-cific result in the case.
5. Summary and Discussion
In summary, by the use of conventional fast voltage sweep technique, we have evaluated fast waveforms ofTe
in the edge plasma of the TST-2 spherical tokamak. The novelty of this paper is comparison ofΦfs measured with
accuracy of the technique is applicable to study of plasma fluctuations.
Acknowledgment
This work was supported by Japan Society for the Pro-motion of Science (JSPS) Grants-in-Aid for Scientific Re-search (S) No. 21226021 and for Scientific ReRe-search (A) No. 21246137.
[1] C. Hidalgo, R. Balb´ın, M. Pedrosa, I. Garc´ıa-Cort´es and M. Ochando, Phys. Rev. Lett.69, 1205 (1992).
[2] L. Giannone, R. Balbfn, H. Niedermeyer, M. Endler, G. Herre, C. Hidalgo, A. Rudyj, G. Theimer, P. Verplanke and the W7-AS Team, Phys. Plasmas1, 3614 (1994). [3] M. Meier, R. Bengtson, G. Hallock and A. Wooton, Phys.
Rev. Lett.87, 085003 (2001).
[4] M. Schubert, M. Endler, H. Thomsen and T. W.-A. Team,
Rev. Sci. Instrum.78, 053505 (2007).
[5] H. M¨uller, J. Adamek, J. Horacek, C. Ionita, F. Mehlmann, V. Rohde, R. Schrittwieser and the ASDEX Upgrade Team, Contrib. Plasma Phys.50, 847 (2010).
[6] J. Boedo, D. Gray, R.W. Conn, P. Luong, M. Schaffer, R. Ivanov, A. Chernilevsky, G.V. Oost and T.T. Team, Rev. Sci. Instrum.70, 2997 (1999).
[7] J. Boedo, D. Rudakov, R. Moyer, G. McKee, R. Colchin et al., Phys. Plasmas10, 1670 (2003).
[8] Y. Takase, A. Ejiri, N. Kasuya, T. Mashiko, S. Shiraiwa et al., Nucl. Fusion41, 1543 (2001).
[9] T. Oosako, Y. Takase, A. Ejiri, Y. Nagashima, Y. Adachi et al., Nucl. Fusion49, 065020 (2009).
[10] Y. Nagashima, T. Oosako, Y. Takase, A. Ejiri, O. Watanabe et al., Phys. Rev. Lett.104, 045002 (2010).
[11] A. Ejiri, Y. Takase, T. Oosako, T. Yamaguchi, Y. Adachi et al., Nucl. Fusion49, 065010 (2009).