Towards Standardising SHPB Testing - A Round Robin Exercise
ReubenGovender1,∗,MuhammadKariem2,DongRuan3,RafaelSantiago4,DongWeiShu5,MarcilioAlves6,Guoxing Lu6,GeraldNurick1,andGenevieveLangdon1
1Blast Impact and Survivability Research Unit, Department of Mechanical Engineering, University of Cape Town, Private Bag X3,
Rondebosch, 7701, South Africa
2Bandung Institute of Technology, Bandung, West Java 40132, Indonesia
3Swinburne University of Technology, PO BOX 218, Hawthorn, Victoria 3122, Australia 4Federal University of ABC (UFABC), 09210-580, Brazil
5Nanyang Technological University, 50 Nanyang Avenue, 639798, Singapore
6University of São Paulo (USP), Butantã, São Paulo - State of São Paulo, 03178-200, Brazil
Abstract.The Split Hopkinson Pressure Bar (SHPB) test, while widely utilised for high strain rate tests, has yet to be standardised. As an exploratory step towards developing a standard test method or protocol, a Round Robin test series has been conducted between four institutions: (i) Swinburne University of Technology, Aus-tralia (ii) University of São Paulo, Brazil, (iii) University of Cape Town, South African and (iv) Nanyang Tech-nological University, Singapore. Each institution prepared specimens from a metallic material, and provided batches of specimens from their chosen material to the other institutions. The materials utilised in this round of testing were commercially pure copper and aluminium, magnesium alloy and stainless steel (316 grade). The intent of the first exercise is to establish the consistency of SHPB test results on nominally identical specimens at comparable elevated strain rates, conducted by different laboratories following notionally similar test
proce-dures with some freedom in data processing. This paper presents and compares the results of the first batch of tests for copper, identifying variations between results from different laboratories. The variation between
different laboratories’ results for copper is sufficiently small that there is confidence in the potential to develop
a draft standard in future.
1 Introduction
The Split Hopkinson Pressure Bar (SHPB) [1] or Kol-sky Bar [2] test is a well established means of investigat-ing mechanical response of a material to high strain rate (≈ 102to 104 s−1) loading. The fundamental principles and guidelines for setting up, conducting and analysing a SHPB experiment are well described by Gray III [3], and Chen and Song [4]. However, conducting a success-ful SHPB experiment requires decisions on a large range of parameters (e.g. bar materials, length, diameter, speci-men dispeci-mensions etc) and post-processing methods (1,2 or 3 wave analysis, dispersive or non-dispersive wave propa-gation etc). No standard describes reasonable starting val-ues for these parameters for typical engineering materials. To the best of the authors’ knowledge, no data has been published showing that SHPB testing conducted at diff er-ent laboratories, on specimens of the same provenance, produce consistent stress-strain results to within an accept-able tolerance. This article documents a Round Robin test series, which sought to establish whether specimens of the same material, tested in compression at SHPB facilities at different institutions, would produce similar stress-strain results. The intent is to ascertain how much the raw ex-perimental data varies, given different physical SHPB set
∗e-mail: [email protected]
ups, and how different data processing methods affect the stress-strain curves which are the ultimate output of the experiments. This would provide guidance for drafting a testing standard in future. Four institutions participated in the exercise, with each institution providing specimens of a nominated metallic material, prepared from a single source. Each institution performed SHPB tests on a batch of its own material, as well as three other batches of dif-ferent materials, provided by the other institutions. The participating institutions, as well as the material provided, are detailed in Table 1.
2 Experimental Details
2.1 Specimen Details
Table 1.Participants and materials.
Institution Country Material
Nanyang Technological University (NTU) Singapore Magnesium AZ31B Swinburne University of Technology (SUT) Australia Stainless Steel 316
University of Cape Town (UCT) South Africa Aluminium 1100
University of São Paulo (USP) Brazil Copper (commercially pure)
2.2 Physical SHPB Details
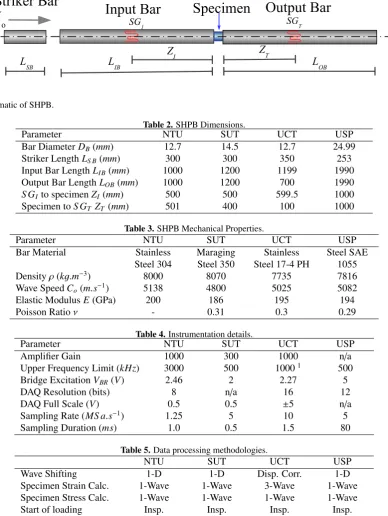
All of the laboratories used conventional compression SHPB arrangements, as shown in Figure 1, with the striker being driven by a gas gun. The participating laboratories used SHPB of different dimensions and materials, detailed in Tables 2 & 3.
Each laboratory aligned and calibrated their SHPB according to their preferred procedures (not described for brevity). Alignment was not measured, though bar misalignment can introduce errors [5] and measurement thereof is being considered for a follow up study. The target for each laboratory was a plastic strain of approx-imately 20%, in a strain rate range of 1000 to 2000 s−1. Each laboratory varied striker velocity to achieve this tar-get. However, it was not specified as to whether the strain rate range, or the maximum plastic strain, was the more important target. To avoid increasing experimental com-plexity and cost, relatively simple pulse smoothing/ shap-ing methods were used: 4 layers of paper (NTU), 4 layers paper masking tape (UCT), 3 layers of paper (SUT), while USP did not employ any pulse smoothing or shaping. Specimens were positioned by hand and lubricated with: common grease (NTU & SUT) petroleum jelly (UCT), while USP did not apply lubricant.
2.3 Instrumentation details
All the laboratories used a pair of diametrically opposed foil resistance strain gauges (nominal resistance 120Ω) on each bar. The positions of the gauges on the input and output bar are noted in Table 2, while details of the ampli-fication and data acquisition are provided in Table 4.
2.4 Data Processing
The data processing methodology was not prescribed as part of the exercise, to help ascertain how much variation in final results the different methods would induce. In this exercise, all laboratories employed input and output bars of equal diameterd, and therefore the area of the input and output barsAB are equal. Obtaining specimen stress-strain from an SHPB experiment requires several decisions about how to process the captured incident εI, reflected
εR and transmittedεT strain waves. Specimen strain may be calculated purely based onεR(1-Wave method), which assumes specimen equilibrium, or using all ofεI,εR and
εT (3-Wave method), which does not inherently assume
1Gain is constant to 100kHz, gain drop offand phase shift
charac-terised up to 1 MHz and corrected in post processing
equilibrium [3]. Similarly specimen stress may be calcu-lated from onlyεT(1-Wave), superimposingεI andεR (2-Wave), or averaging input and output face forces, which usesεI,εR andεT (3-Wave). All these methods require that the wave captured at the strain gauge be shifted to the relevant bar-specimen interface. This shift can either assume 1-dimensional wave propagation, and hence no shape change; or it can correct for dispersion of the wave in the frequency domain using a phase shift calculated from the Pochammer-Chree phase velocity-frequency re-lationship (originally proposed in [6, 7], current procedure described in [8]). The identification of the start of spec-imen loading may be either by inspection, or using tech-niques such as proposed by Zhao and Gary [9] or Li and Lambros [10]. While each laboratory used different meth-ods for calibrating the bars’ wave speed Co and calibra-tion factors for converting strain gauge voltage to actual strain, the details of these methods have been omitted from this publication for brevity. All laboratories confirmed dy-namic equilibrium of the specimen for the test to be ac-ceptable. The different processing methods employed by each laboratory are summarised in Table 5.
3 Results and Discussion
While four different materials have been tested in this ex-ercise, only the data for copper are presented in this paper due to space constraints. Before data from any test was considered valid, the equilibrium of forces on the input and output faces of the specimen was checked. Some ex-amples of this for each laboratory are shown in Figure 2. The valid data sets from each laboratory for copper are shown in Figure 3. The maximum plastic strain varies between laboratories, as is expected due to the different striker lengths and velocities. The strain rates stated in each figure are the average strain rate, taken from the peak rate to the point where the specimen begins to unload. As each laboratory could vary striker velocity, there is a vari-ation in strain rates achieved between laboratories.
Table 1.Participants and materials.
Institution Country Material
Nanyang Technological University (NTU) Singapore Magnesium AZ31B Swinburne University of Technology (SUT) Australia Stainless Steel 316
University of Cape Town (UCT) South Africa Aluminium 1100
University of São Paulo (USP) Brazil Copper (commercially pure)
2.2 Physical SHPB Details
All of the laboratories used conventional compression SHPB arrangements, as shown in Figure 1, with the striker being driven by a gas gun. The participating laboratories used SHPB of different dimensions and materials, detailed in Tables 2 & 3.
Each laboratory aligned and calibrated their SHPB according to their preferred procedures (not described for brevity). Alignment was not measured, though bar misalignment can introduce errors [5] and measurement thereof is being considered for a follow up study. The target for each laboratory was a plastic strain of approx-imately 20%, in a strain rate range of 1000 to 2000 s−1. Each laboratory varied striker velocity to achieve this tar-get. However, it was not specified as to whether the strain rate range, or the maximum plastic strain, was the more important target. To avoid increasing experimental com-plexity and cost, relatively simple pulse smoothing/ shap-ing methods were used: 4 layers of paper (NTU), 4 layers paper masking tape (UCT), 3 layers of paper (SUT), while USP did not employ any pulse smoothing or shaping. Specimens were positioned by hand and lubricated with: common grease (NTU & SUT) petroleum jelly (UCT), while USP did not apply lubricant.
2.3 Instrumentation details
All the laboratories used a pair of diametrically opposed foil resistance strain gauges (nominal resistance 120 Ω) on each bar. The positions of the gauges on the input and output bar are noted in Table 2, while details of the ampli-fication and data acquisition are provided in Table 4.
2.4 Data Processing
The data processing methodology was not prescribed as part of the exercise, to help ascertain how much variation in final results the different methods would induce. In this exercise, all laboratories employed input and output bars of equal diameterd, and therefore the area of the input and output barsABare equal. Obtaining specimen stress-strain from an SHPB experiment requires several decisions about how to process the captured incident εI, reflected
εR and transmittedεT strain waves. Specimen strain may be calculated purely based onεR(1-Wave method), which assumes specimen equilibrium, or using all ofεI,εR and
εT (3-Wave method), which does not inherently assume
1Gain is constant to 100kHz, gain drop offand phase shift
charac-terised up to 1 MHz and corrected in post processing
equilibrium [3]. Similarly specimen stress may be calcu-lated from onlyεT(1-Wave), superimposingεIandεR (2-Wave), or averaging input and output face forces, which usesεI,εR andεT (3-Wave). All these methods require that the wave captured at the strain gauge be shifted to the relevant bar-specimen interface. This shift can either assume 1-dimensional wave propagation, and hence no shape change; or it can correct for dispersion of the wave in the frequency domain using a phase shift calculated from the Pochammer-Chree phase velocity-frequency re-lationship (originally proposed in [6, 7], current procedure described in [8]). The identification of the start of spec-imen loading may be either by inspection, or using tech-niques such as proposed by Zhao and Gary [9] or Li and Lambros [10]. While each laboratory used different meth-ods for calibrating the bars’ wave speed Co and calibra-tion factors for converting strain gauge voltage to actual strain, the details of these methods have been omitted from this publication for brevity. All laboratories confirmed dy-namic equilibrium of the specimen for the test to be ac-ceptable. The different processing methods employed by each laboratory are summarised in Table 5.
3 Results and Discussion
While four different materials have been tested in this ex-ercise, only the data for copper are presented in this paper due to space constraints. Before data from any test was considered valid, the equilibrium of forces on the input and output faces of the specimen was checked. Some ex-amples of this for each laboratory are shown in Figure 2. The valid data sets from each laboratory for copper are shown in Figure 3. The maximum plastic strain varies between laboratories, as is expected due to the different striker lengths and velocities. The strain rates stated in each figure are the average strain rate, taken from the peak rate to the point where the specimen begins to unload. As each laboratory could vary striker velocity, there is a vari-ation in strain rates achieved between laboratories.
As is usual for SHPB data, there are oscillations on any given specimen’s stress-strain curve as well as the usual specimen-to-specimen variation. Attempting to overlay all the data from the subfigures of Figure 3 on a single figure makes it very difficult to distinguish one batch of data from another. A reduced set of points from all of the flow stress curves from each laboratory are shown overlaid in Fig-ure 4a. It is clear that there is significant overlap in the data from each laboratory. To help discern differences between the four laboratories’ data sets, the entire flow stress data set from a single laboratory is fit to a power law,A+Bεn.
Specimen
V
o
Striker Bar
Output Bar
Input Bar
L
SBL
IBZ
IZ
TL
OB SG 1 SG TFig. 1.Schematic of SHPB.
Table 2.SHPB Dimensions.
Parameter NTU SUT UCT USP
Bar DiameterDB(mm) 12.7 14.5 12.7 24.99
Striker LengthLS B(mm) 300 300 350 253
Input Bar LengthLIB(mm) 1000 1200 1199 1990
Output Bar LengthLOB(mm) 1000 1200 700 1990
S GIto specimenZI (mm) 500 500 599.5 1000
Specimen toS GT ZT (mm) 501 400 100 1000
Table 3.SHPB Mechanical Properties.
Parameter NTU SUT UCT USP
Bar Material Stainless
Steel 304 MaragingSteel 350 Steel 17-4 PHStainless Steel SAE1055
Densityρ(kg.m−3) 8000 8070 7735 7816
Wave SpeedCo(m.s−1) 5138 4800 5025 5082
Elastic ModulusE(GPa) 200 186 195 194
Poisson Ratioν - 0.31 0.3 0.29
Table 4.Instrumentation details.
Parameter NTU SUT UCT USP
Amplifier Gain 1000 300 1000 n/a
Upper Frequency Limit (kHz) 3000 500 10001 500
Bridge ExcitationVBR(V) 2.46 2 2.27 5
DAQ Resolution (bits) 8 n/a 16 12
DAQ Full Scale (V) 0.5 0.5 ±5 n/a
Sampling Rate (MS a.s−1) 1.25 5 10 5
Sampling Duration (ms) 1.0 0.5 1.5 80
Table 5.Data processing methodologies.
NTU SUT UCT USP
Wave Shifting 1-D 1-D Disp. Corr. 1-D
Specimen Strain Calc. 1-Wave 1-Wave 3-Wave 1-Wave
Specimen Stress Calc. 1-Wave 1-Wave 1-Wave 1-Wave
Start of loading Insp. Insp. Insp. Insp.
An example of the power law fit to all specimen plastic flow data for a single laboratory is shown in Figure 4b.
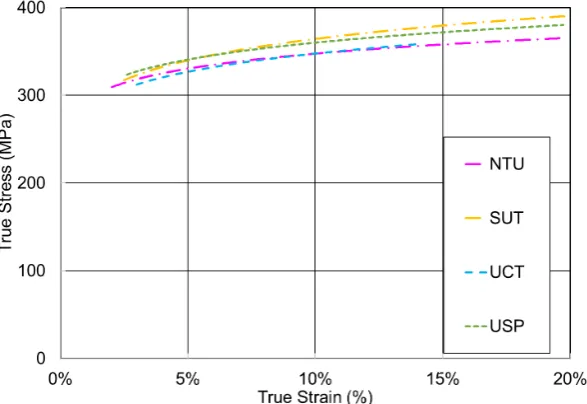
Figure 5 shows the power law flow curves fit to each laboratory’s data set for copper, which makes some sub-tle differences more obvious. Based on the power laws, the average flow stress at ε = 5% is 335 MPa, with a standard deviation of 7 MPa. As the strain increases to 20%, the average flow stress increases to 377 MPa while the standard deviation also increases to 11 MPa. In the ASTM Standard Test Method for Quasi-Static compres-sion of metals at room temperature [11], the 95% re-producibility limit for Al-2024 with a yield strength of
346 MPa was 19 MPa between laboratories. This gives good confidence in the reproducibility between laborato-ries conducting SHPB tests at high strain rates. The flow stress for the SUT data is higher than the other labora-tories, though marginally so than that of USP. The flow stresses from the UCT and NTU data are practically indis-tinguishable. The SUT tests were conducted at the highest average strain rate ˙ε ≈2.55×10³±0.12×10³ s−1. The UCT tests were conducted at the lowest average strain rate
˙
ε≈1.05×10³±0.12×10³s−1. The strain rate bands for NTU and USP overlap, at ˙ε≈1.6×10³±0.3×10³ s−1and
˙
(a) NTU (b) SUT
(c) UCT (d) USP
Fig. 2.Force equilibrium verification for copper.
(a) NTU (b) SUT
(c) UCT (d) USP
(a) NTU (b) SUT
(c) UCT (d) USP
Fig. 2.Force equilibrium verification for copper.
(a) NTU (b) SUT
(c) UCT (d) USP
Fig. 3.True stress-true strain data for valid copper tests from all laboratories.
(a) Flow stress point cloud for all valid copper tests from all laboratories. (b) Power law fit to all UCT data for copper.
Fig. 4.Flow stress data for copper and power law fitting.
Fig. 5.Best fit power law flow curves for all laboratories for copper specimens.
between the laboratories was purely due to strain rate, the data from NTU and USP should coincide, which is not the case. An analysis of the variations due to data processing methods and other experimental variables is not possible in this article due to space constraints. Nonetheless, the variation between laboratories’ data sets is small enough that there is confidence moving forward.
4 Concluding Remarks
Four laboratories participated in a Round Robin exercise aimed at developing a standard test method for SHPB test-ing of metallic materials. The laboratories all used dif-ferent physical SHPB arrangements, as well as instrumen-tation and data processing. The variation between flow stress curves shows that different laboratories can produce
consistent data for the same specimens, even though a relatively broad range of instruments and data processing methods was employed. This suggests that a future stan-dard test method for SHPB tests need not be onerously prescriptive in order to obtain consistent results. More detailed analysis of the variations between laboratories in experimental apparatus, test method and data analysis is
planned for future publications which are less space con-strained. It is hoped that a further experimental Round Robin series can be conducted with more participants and a more refined prescribed method.
References
1. R. Davies, Phil. Trans. Royal Soc. London Part A240, 375 (1948)
2. H. Kolsky, Proc. Physical Soc. Section B 62, 676 (1949)
3. G. Gray III, Mechanical Testing and Evaluation
(ASM International, 1999), Vol. 8 ofASM Handbook, chap. Classic Split-Hopkinson Pressure Bar Testing, pp. 462–476
4. W.W. Chen, B. Song,Split Hopkinson (Kolsky) bar:
Design, Testing and Applications(Springer Science &
Business Media, 2010)
5. M.A. Kariem, J.H. Beynon, D. Ruan, International Journal of Impact Engineering47, 60 (2012)
7. P. Follansbee, C. Frantz, Journal of Engineering Ma-terials and Technology105, 61 (1983)
8. S. Marais, R. Tait, T. Cloete, G. Nurick, Latin Ameri-can Journal of Solids and Structures1, 219 (2004) 9. H. Zhao, G. Gary, International Journal of Solids and
Structures33, 3363 (1996)
10. Z. Li, J. Lambros, Composites Science and Technol-ogy59, 1097 (1999)