Running head: The Bayesian Information-Theoretical Model of Lexical Processing
The Missing Link between Morphemic Assemblies and Behavioral Responses: a Bayesian Information-Theoretical model of lexical processing
Fermn Moscoso del Prado Martna, Aleksandar Kosticb,
and Dusica Filipovic-Durdevicb
a MRC Cognition and Brain Sciences Unit, Cambridge, U.K.
b Laboratory for Experimental Psychology, University of Belgrade, Serbia and Montenegro
Address all correspondence to: Dr. F. Moscoso del Prado Martn
MRC Cognition and Brain Sciences Unit 15 Chaucer Road
CB2 2EF Cambridge United Kingdom
e-mail: [email protected] tel: +44 1223 355 294 X275
Abstract
Introduction
Research in psycholinguistics during the last fty years has provided us with a wealth of data on the detailed properties of lexical processing in the human mind. More recently, neuroimaging techniques have begun complementing this picture with detailed specications of the spatio-temporal patterns of cortical activation that accompany language processing. Simultaneously, some theories detailing how language processing can take place in detailed neurobiological terms are currently becoming available, and receiving support from neu-roimaging studies. However, there still seems to be a dissociation between the results ob-tained in behavioral studies, and the detailed neurobiological theories of language processing. In this study we argue that we are currently in the position to link both levels of explanation: behavioral and neurobiological. We demonstrate this by showing how a neurophysiological theory of lexical processing (Pulvermuller, 1999) can provide a direct explanation of sev-eral previously reported behavioral eects. For this purpose we develop a set of statistical information-theoretical tools that enable us to make quantitative predictions on behavioral responses based on an underlying neurophysiological theory, without the need for direct computational simulation.
Measures of lexical competition and facilitation
size on lexical decision latencies (i.e., small neighborhoods produce facilitation, while large neighborhoods produce inhibition). The eect of orthographic neighborhood has also been found to correlate with the magnitude of the N400 component of the ERP signal (Holcomb, Grainger, & O'Rourke, 2002).
Similar eects have been observed in the domain of word meaning. Jastrzembski (1981) reported that, in visual lexical decision, semantically ambiguous words are responded to faster than semantically unambiguous words. Many other authors have replicated this result (e.g., Azuma & Van Orden, 1997; Borowsky & Masson, 1996; Kellas, Ferraro, & Simp-son, 1988). An additional renement to this ambiguity advantage was introduced by Rodd, Gaskell, and Marslen-Wilson (2002) who pointed out the need to distinguish between words having many unrelated meanings (homonymic) and words having many related senses (poly-semous). They showed that, while polysemous words exhibit the previously described ambi-guity advantage, homonymic words are in fact recognized slower. Parallel to what was found in the domain of word form (orthographic and phonological), the semantic neighborhood of a word can also have eects in opposite directions. This distinction has been conrmed in two recent neuromagnetic studies, that have also shown that both eects are reected in dierent cortical sources of the M350 eect (Beretta, Fiorentino, & Poeppel, 2005; Pylkkanen, Llinas, & Murphy, in press).
eects of semantic ambiguity, the morphological family size eect is also reected in the M350 component of MEG experiments (Pylkkanen, Feintuch, Hopkins, & Marantz, 2004).
In summary, the neighborhood of a word, whether orthographic, phonological, morpho-logical or semantic, inuences the time it takes for that word to be recognized. However, in all domains mentioned above, it appears that, by itself, the size of a word's neighborhood can either facilitate the recognition of a word or, on the opposite, make it more dicult. All these eects appear to be reected in the M350 and N400 components in magneto- and electro-encephalographic studies.
Information-theoretical measures and lexical recognition
Dierent lines of research on phonological and morphological neighborhoods are currently converging on the use of information-theoretical measures to describe the amount of support or competition that a word receives from its neighborhood. Kostic proposed an information-theoretical account of inectional processing that was successful in explaining large propor-tions of the variance in lexical decision experiments to Serbian inected words (Kostic, 1991; 1995; 2005; Kostic, Markovic & Baucal, 2003). He considered the joint inuence on response latencies of the distribution of frequencies of Serbian inectional axes, and their degree of syntactic and semantic heterogeneity. In the same direction, Moscoso del Prado Martn, Kostic, and Baayen (2004) showed that this account can be extended to provide a detailed description of the eects of Dutch morphological paradigms: The amount of support that a word receives from the morphological paradigms to which it belongs is best described by the entropy of the frequency distribution of the words that belong to that paradigm (i.e., the words that share an inectional or derivational morpheme with it). Moscoso del Prado Martn and colleagues also pointed at the eects of semantic heterogeneity of morphological paradigms being directly accommodated in these information theoretical measures. More recently, Baayen and Moscoso del Prado Martn (2005) have shown that these measures also bear on issues like noun and verb regularity, and have implications for neuroimaging studies.
mea-sures characterizing the inuence of phonological neighborhoods in spoken word recognition. Vitevitch and Luce (1999) showed that the amount of competition between words in the same phonological neighborhood is well described by the summed log frequency of the words in a particular neighborhood. This magnitude is in fact the same measure that Kostic (2005) calculated to describe the facilitation produced by morphological paradigms and, as shown by Moscoso del Prado Martn et al. (2004), it constitutes an upper bound estimate for the entropy measures. Indeed, Luce and Large (2001) showed that a similar entropy measure also plays a role in describing the eects of phonological neighborhoods.
Neural assemblies and lexical processing
Pulvermuller (1996; 1999; 2001) introduced a theory of lexical processing in the brain. It relies on the existence of neural assemblies (Hebb, 1949) distributed over broad cortical areas. These assemblies are tightly-coupled ensembles of neurons that automatically re on presentation of a word. The assemblies would recruit neurons from left perisylvian areas (inferior frontal and superior temporal { including the traditional Broca's and Wernicke's language areas) relating to the phonological and orthographical forms of words, and from non-lateralized, widely distributed cortical areas relating to the meanings and grammatical properties of the words. A large amount of neurophysiological evidence has been provided in support of this theory (cf., Pulvermuller, 2003). These neural assemblies, although commonly termed `lexical' or `word' assemblies, can also correspond to sub-lexical morphemic units such as inectional axes (Shtyrov & Pulvermuller, 2002).
together above chance level. When the connections have become suciently strong, the stimulation of one part of the network (e.g., the neurons responding to the orthographic properties) will result in the automatic ring and reverberation of the full network (including all properties of the word) within a short period of time.
A crucial aspect of the theory is the presence of inhibitory mechanisms that avoid the simultaneous activation of several word assemblies. Consider for instance the case of a pol-ysemous or homonymic word: In Pulvermuller's theory, such words would be represented by multiple assemblies, each corresponding to one of the distinct meanings of the words. These assemblies would have dierent cortical topographies in relation to their meanings, but would overlap in their perisylvian areas representing their ortho-phonological properties, which are common for all their meanings. Therefore, in order to select one of the possible meanings of a word, some form of competition must take between the candidate assemblies for that particular form. Dierent mechanisms have been proposed to implement this mech-anism. Pulvermuller (1999) suggested that direct inhibitory connections between dierent assemblies might be implemented by means of inhibitory striatal connections between the neurons in the assemblies (Miller & Wickens, 1991). In addition to this lateral inhibition, Pulvermuller (2003) argues for the presence of a more general regulatory mechanism that would deliver inhibition to all active assemblies when the overall level of cortical activa-tion reaches a certain threshold. Such central regulaactiva-tion could be implemented through the thalamo-cortical loop. Indeed, neurophysiological evidence for thalamic modulation of cor-tical activity during semantic processing has been reported by Slotnik, Moo, Kraut, Lesser, and Hart (2002).
The missing link
behavioral results are currently presented without a low level anchor describing the neural processes and representations that give rise to these eects. Although MEG and EEG experiments have succeeded in showing that these eects have neurophysiological correlates (mainly in the M350 and N400 eects), no research has documented why and how do these particular dierences arise in terms of the underlying neural structures. On the other hand, up to the moment, Pulvermuller's detailed neurophysiological theory has not attempted to make clear predictions at the behavioral level.
The eects of orthographic neighborhood size have been explained using a variety of computational models including the MROM model (Grainger & Jacobs, 1996), the DRC model (Coltheart, Rastle, Perry, Langdon, & Ziegler, 2001) and the Bayesian Reader (Nor-ris, in press). Vitevitch and Luce (1999) interpret their own results on phonological neighbor-hood within the framework of the adaptative resonance theory of speech perception (Gross-berg, Boardman & Cohen, 1997), while Gaskell and Marslen-Wilson (1997) used a distributed connectionist network to show that the eect of phonological neighborhood can also arise due to competition between distributed representations of meaning. The eects of facilitation and competition caused by the semantic neighborhood have also been interpreted assuming both localist representations (Beretta et al., 2005; Pylkkanen et al., in press) or in terms of a distributed connectionist model (Rodd, Gaskell, & Marslen-Wilson, 2004). A similar contrast has been observed for the eects of morphological paradigms, which have been modeled using both localist, interactive-activation models (Baayen, Dijkstra, & Schreuder, 1997; De Jong, Schreuder, & Baayen, 2003; Taft, 1994) and distributed connectionist models (Moscoso del Prado Martn & Baayen, 2005).
comes from Marr's famous division of the levels of description of a computational system (Marr, 1982). It is argued that all the models above provide descriptions within Marr's computational level, which deals primarily with mental representations (see Norris, 2005 for an in-depth discussion of this issue). On the other hand, Pulvermuller's neurophysiological theory of language processing would lie between Marr's implementational and algorithmic levels, which are respectively concerned with neural representations and brain processes. Although Marr's division of labor is indeed useful for the study of the cognitive system, it must be kept in mind that Marr's explicit goal in positing this division was to obtain a unied theory (in his case of visual processing in the human brain). In order to achieve such a theory, the isolated investigation of each of the levels needs to be complemented with research aiming to link the results from the three levels. Some authors are pessimistic on the possibility of achieving an understanding of this link for higher cognitive processes in the near future (e.g., Norris, 2005). However, in other areas of cognitive processing, it has already been possible to approach this linkage. Specically, the eld of vision { Marr's own area of investigation { has recently come close such an integration (Rolls & Deco, 2001). The large set of results on human language processing at the behavioral, computational, and neurophysiological levels, suggests that we are beginning to be in a position to address such problems also for human language. In this direction, Edelman (in press) suggests three \general-purpose computational building blocks of biological information processing" that can be used to address the linkage of the dierent levels in the case of language: function approximation, density estimation, and dimensionality reduction. Edelman argues that these building blocks are implemented across multiple cognitive domains. In addition, Edelman describes how a combination of distributed representations with those building blocks is most likely to be successful in approaching the integrations of the dierent levels for the case of language.
Crucially, our predictions also explain why the information-theoretical measures are proving the most suitable to describe these eects. In addition, the model that we present oers an insight on the debate between distributed and localist models to account for these eects. We will show that, in order to account for the eects, one needs to make use of distributed representations of the same type used in distributed connectionist models. However, a crucial component of our model is that it requires the explicit assumption that the distributed representations will give rise to a discrete number of localistic representations by eect of plain statistics. In such way, our model oers a meeting point for localist and distributed models of lexical processing.
In what follows we will begin by describing how Pulvermuller's neural assembly model can be used to make predictions on the behavioral level that would match the observed eects of lexical neighborhoods. We will continue by describing the forms of representations that we have used in the model, and how information theory enables us to extract measures of such representations that should link directly with the behavioral results. Next, we will use three lexical decision datasets to illustrate how the predictions made by the model with respect to morphological and semantic neighborhoods are indeed veried on the lexical decision latencies. Finally, we will discuss the implications of these results for current theories of lexical processing, and how our method oers a way to integrate the results from the dierent descriptive levels.
From Neural Assemblies to Behavioral Responses
of neurons could be described by a multidimensional probability density function (PDF) over the vector space. From the Hebbian approach we can then predict that neural assemblies would become sensitive to the areas of the representational space in which the PDF has a higher value, indicating that points in that region space are relatively probable with respect to other parts of space. Moreover, given that neurons are known to have Gaussian-shaped receptive elds, one would assume that the probability of ring of a neural assembly would be determined by a multidimensional Gaussian distribution over the activation of the neurons that form it. This would imply that the PDF that the neurons are able to capture should correspond to a mixture of Gaussians (Dempster, Laird & Rubin, 1977), which each of the Gaussian components corresponding to one assembly. Therefore, in our vectorial represen-tation, the corresponding PDF would also be a mixture of multidimensional Gaussians.
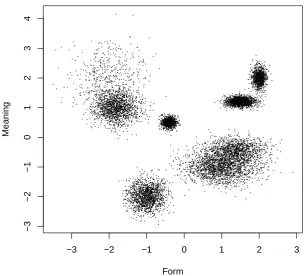
As reviewed above, Pulvermuller (1999) argues that lexical and morphemic assemblies recruit neurons in left perisylvian areas, related the the orthographic and phonological forms of words and their grammatical properties, and neurons in more broadly distributed cortical areas, which respond to the meanings of such words. Provided that we have adequate vectorial representations of the neural patterns responding to the forms and the meaning of words, and reasonable estimates of the frequency with which these are encountered, we could in principle predict the formation of neural assemblies as areas in the space which the value of the PDF is suciently high to develop an independent component in the Gaussian mixture. For illustration purposes, consider a hypothetical representation that enabled us to encode the patterns of activation related to word forms as a single real number, and the patterns of activation related to word meaning as another one. The scatterplot in Figure 1 represents a hypothetical sample of the distribution of ring patterns in such a space. The horizontal axis represents the neural activation pattern in the form-related areas, and the vertical axis represents the corresponding pattern in meaning-related areas. Each point in the graph would correspond to a particular occurrence of a combination of form and meaning neurons being active.
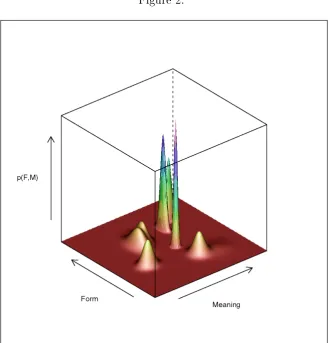
phemes would be developed associating the formal and meaning neurons corresponding to the more densely crowded areas in the space, that is, the clusters of points in Figure 1. If the form and meaning of a particular instance of a word are represented by vectors f and m respectively, the scatter in Figure 1 would correspond to a PDF p(f; m) dened over the space of word forms and word meanings. Our assumption of a PDF composed of a discrete mixture of Gaussian would imply that each cluster would develop into a Gaussian distribu-tion. The PDF resulting from tting a mixture of Gaussians to Figure 1 is illustrated by Figure 2. The seven `bumps' in Figure 2 describe how the receptive elds of the neurons in seven neural assemblies would map onto the areas of the space that could make those assemblies re.
[INSERT FIGURE 2 AROUND HERE]
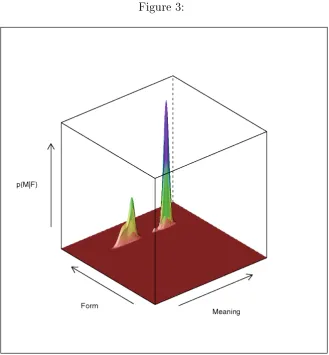
Following Pulvermuller's theory, during language comprehension, neural assemblies would automatically re on presentation of a particular word form that falls within their inuence. In many situations this could lead to the activation of multiple assemblies on the same stimulus. Consider the case in which a particular word form f has been encountered. The assemblies that are associated with it would all simultaneously receive activation. In our graphical scheme the probability of activation the the meaning-related neurons given a par-ticular word form p(mjf) would be represented by a `slice' of the PDF shown in Figure 2. Figure 3 illustrates how such a slice would look like: The selection of the particular word form f, would correspond to constraining the overall joint probability distribution on the word-form margin with a a very sharp normal distribution centered on the particular word form. Such a spike would represent the activation in cortical areas responding to word-form resulting from the presentation of a particular visual or auditory stimulus.
[INSERT FIGURE 3 AROUND HERE]
a single one being active and inhibit the ring of the other ones. In summary { as argued by Pulvermuller { some form of competition must take place to select a single assembly.1 In
this view, the competition would result in all active assemblies receiving inhibition. After a certain period, the assembly that receives the strongest activation { the one covering the greatest volume in Figure 3 { would become fully activated, while the activation of all other competing assemblies would die out as a result of the continued inhibition. The time it would take an assembly to become fully activated should therefore be related to two factors: (a) the initial degree of activation received by the assemblies and, (b) the degree of competition between the assemblies. Factor (a) would depend on the strength of activation delivered by the neurons representing the formal aspects of the word. This would depend on many factors: The frequency with which that particular combination of word form and word meaning is encountered, and dierent orthographic and phonological neighborhood eects. In addition, if one takes into account that there is deemed to be a certain amount of random activity in the system at any given moment, one could expect that when this random activity falls within the area of inuence of a particular set of assemblies, it should add to their overall likelihood of being activated. This would entail that those groups of assemblies that cover a larger area of the representational space should have a certain advantage, as they would receive a larger amount of random activation.
Note that we have oversimplied the process of form identication as being an instanta-neous process that renders a single form being active. Neither of this assumptions is true, the process is not instantaneous, and in principle can lead to multiple spikes for a particular stimulus (see Norris, in press for a detailed discussion and mathematical characterization of these issues). In this paper however, we will limit ourselves to the study of the interactions that happen once the form information has been reduced to a single spike. By this we are taking the simplifying assumption that we can sequentially separate the form identication processes from the activations at the level of meaning. In reality, these two processes are most likely to be cascaded. However, we believe the concussions we will draw from the
inter-1Whether this mechanism is implemented through lateral striatal connections (Pulvermuller, 1999) or a
actions at the level of meaning would also be true in a cascaded system, only with additional interactions with the word-form eects. These we leave for further research.
In turn, the amount of competition between neural assemblies that could correspond to a particular word form { factor (b) from the previous paragraph { should be inuenced by: i Number of components of the Gaussian mixture: As we described above, each com-ponent in the Gaussian mixture would correspond to an assembly that could re in response to a particular word form. The amount of inhibition that all assemblies receive (either from the regulatory mechanism or through lateral connections) should then be related to the number of assemblies that are active, with more candidate assemblies resulting in more competition.
ii Relative probabilities of each of the components: The amount of competition between the assemblies should also be related to how unequal the activation of the candidate assemblies is. If one assembly receives much more activation than the remaining can-didates, it is likely to resolve the competition faster than in a case where the level of activity of many of the candidates is roughly similar.
iii Degree of overlap between competing components: Neurons that could belong to more than one competing assembly will receive support from the activation of all of them, thus making their eective level of activation higher than would be expected according to a single assembly. Therefore, assemblies whose neurons receive additional support from other assemblies will be faster in reaching their ignition threshold. This entails that, for the overlapping parts of competing assemblies, the competition is reduced.
Measuring assembly coverage and competition between assemblies
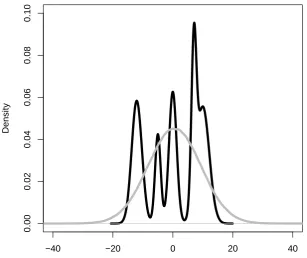
would also increase the dierential entropy. Finally a mixture that contains two components that are very separated would imply a higher degree of uncertainty than a measure whose components that partially overlap.
Unfortunately, the dierential entropy of the distribution would also be very inuenced by the general width of the Gaussian mixture: PDFs with a large variance would increase the dierential entropy in proportion to the log of the determiner of their covariance matrix. However, the width of the receptive elds of the dierent assemblies that are candidates for ignition should not inuence the degree of competition between them. On the opposite, having a wide receptive eld would be an advantage for the activation of a neural assembly, since it would increase the probability of random or noisy activation igniting one of the assemblies corresponding to a word or morpheme, thus reducing the average time it would take for the assemblies to be activated, and reducing the probability of the assemblies not being activated at all.
A more appropriate measure for our purposes is the negentropy of the PDF (Brillouin, 1956; see Appendix A). Negentropy is commonly used in techniques such as Independent Component Analysis (Comon, 1994) to assess the amount of useful information present in a combination of variables, that is, the degree of non-normality in their joint distribution. As in the case of dierential entropy, negentropy is also sensitive to factors i, ii, and iii. Importantly, in contrast with dierential entropy, this measure is mostly independent of the actual width of the distribution.
[INSERT FIGURE 4 AROUND HERE]
being activated. To separate this factor from the other three, we can subtract the entropy of the Gaussian mixture from the entropy of a single Gaussian distribution with equal mean and covariance (grey curve). The entropy of this single Gaussian is not sensitive to any factor related to the peaks (it has a single peak in any case), but is sensitive to the overall spread. Therefore, by this subtraction, we can separate the two variables of interest: the degree of inter-assembly competition is reected by the negentropy, and the likelihood of the assemblies being activated which is indexed by the Equivalent Gaussian Entropy (EGE).
These two measures enable us to make predictions on behavioral responses based on Pulvermuller's neural assembly model: On the one hand, the negentropy of the distribution of meanings should correlate positively with response latencies to comprehension tasks that require the activation of an assembly, as it reects the amount of competition that the winning assembly will have to overcome. On the other hand, the EGE measure should correlate negatively with both response latencies and error counts, since it reects the general ease of activating a set of assemblies.
Probability Distributions on a High-dimensional Space
In the previous section we have outlined how information-theory enables us to make predic-tions at the behavioral level starting from Pulvermuller's neurophysiological theory. In order to test this idea we require a suitable vectorial representation of the meaning and grammatical function of each occurrence of a word or morpheme, and a technique to estimate the corre-sponding mixture of multidimensional Gaussians and the associated information-theoretical measures.
First and second order co-occurrence vectors
as many rows and columns as dierent word types appeared in the corpus. The cells in the matrix correspond to the number of times with which the word corresponding to a col-umn appeared within a small window centered on the word corresponding to the row. The rows (or the columns) in such a matrix provide a representation of the contexts in which that word is normally used. In turn, the contexts in which a word is used provide crucial information about the meaning and morpho-syntactic properties of the word itself (Wittgen-stein's \meaning is use"). Indeed, Schutze observed that the distances between the vectors corresponding to the words provide useful information about their similarity in meaning.
A large amount of research has developed this idea of word co-occurrence vectors, and with dierent variations on the technique employed for collecting the vectors, transforming the frequencies, and reducing the dimensionality of the resulting matrix, has given rise to a family of related techniques such as Hyperspace Analog to Language (Lund & Burgess, 1996), Latent Semantic Aanalysis (Landauer & Dumais, 1997) or Random Indexing (Kanerva, Kristofersson & Holst, 2000). In addition, a large body of research has indicated that the distances between co-occurrence vectors correlate with human responses in dierent behav-ioral tasks (e.g., Landauer & Dumais, 1997; Landauer, Laham, Rehder, Schreiner, 1997; Lowe & McDonald, 2000; Lund, Burgess & Atchley, 1995; McDonald & Shillcock, 2001). In addition to capturing semantic properties of words, co-occurrence vectors have also been shown to capture the morpho-syntactic properties of words (Schutze, 1995) and inectional axes (Schone & Jurafsky, 2001).
rst order vectors are constructed, each occurrence of the word of interest is represented by the sum of the rst order vectors of the words occurring around it (also within a small win-dow). In this way one obtains a set of dierent vectors for each word of interest, each vector corresponding to one instance of the word. Schutze and Pedersen obtained promising results on word sense disambiguation by using the distances between the second order vectors of an ambiguous noun in context, and the rst order vectors of the dierent meanings of that noun.
We propose using these second order co-occurrence to represent the dierent instances of a word or morpheme in multidimensional space. This will enable us to obtain an estimate of its distribution of usages. A crucial point is that this technique enables us to build the vectors on the minimum possible assumption, that is, a corpus of language without any linguistic labeling.
other words that are used in similar contexts.
Estimation of the underlying distribution and informational measures
Second order co-occurrence techniques provide us with a method for estimating a sample of high-dimensional vectors describing the contexts in which a word or morpheme is used. In order to estimate the negentropy and EGE of the underlying multidimensional distribution, we could make use of direct estimation methods (Kraskov, Stogbauer, & Grassberger, 2004; Van Hulle, 2005a; 2005b). However, these methods are mathematically quite complex and make strong assumptions on the underlying distributions that are not justied in our case. The methods proposed by Kraskov et al. (2004) and Van Hulle (2005a) do not make use of any information on the underlying distribution. In our case, by the assumption of the neural assemblies, we have hypothesized that that distribution must be a multidimensional Gaussian mixture with an unknown number of components, thus our EGE and negentropy approximations should take this information into account. Van Hulle (2005b) introduces a method to estimate the dierential entropy of a multidimensional mixture of Gaussians, but it is valid only when it can be assumed that the mixture components are \far enough apart". However, in our case, many of the mixture components are deemed to overlap. Instead, we can estimate our information-theoretical measures in two stages: First we estimate the underlying PDF as a Gaussian mixture, and then we estimate its negentropy and EGE.
of points. Note that in practice, after estimation, an innite mixture model reduces to a normal Gaussian mixture with a nite number of components. Neal (2004) provides a set of software tools to estimate distributions of this type. This family of models corresponds well to our prior knowledge: We are assuming that the points in our sample have been generated by a Gaussian mixture with an unknown number of components.
The problem of estimating the negentropy is now simplied by having estimation of un-derlying PDF. According to the denition (see Appendix A), the negentropy of a distribution p(x) is dened as the dierence between the dierential entropy of a Gaussian distribution pN(x) of equal covariance matrix to p(x) (EGE) and the dierential entropy of p(x) itself:
J(p) = h(pN) h(p) (1)
Provided we know the covariance matrix K, which can be directly estimated from the sample of points, the entropy of the normal distribution pN(x) can be calculated analytically as:
h(pN) = n2log2(2e) +12log2jKj (2)
There is no simple analytical way of calculating the dierential entropy of a mixture of Gaussians. Instead, we can estimate it numerically using MonteCarlo integration: If p(x) is a probability density function over a n-dimensional space S, and fx1; : : : ; xNg S is a
suciently large sample of points sampled according to p(x), then the entropy of p(x) can be approximated by:
h(p) ' N1 XN
i=1log2p(xi) (3)
Therefore we can calculate the EGE of our sample of points using (2), then calculate the dierential entropy of our tted Gaussian mixture using (3), and nally estimate the negentropy using (1).
Analysis 1: Negentropy and inter-assembly competition
experiments reported by Kostic et al. (2003) on the processing of Serbian nominal inectional axes.
Kostic et al. (2003) found that most of the variance in the average lexical decision RTs to Serbian inected nouns is explained by the logarithmic ratio between the frequency of a particular sux, and the number of syntactic functions and meanings that that ax might take (calculated through a detailed linguistic study described in Kostic, 1965). In a brief summary, Kostic's results show that the time it takes to recognize a Serbian sux is directly related to the number of syntactic functions and meanings that it could have in a particular context (i.e., masculine nouns or feminine nouns).
If our hypothesis is correct, Kostic's number of syntactic functions and meanings should be related to the amount of competition between assemblies, and thus should also be cor-related with the negentropy measure we have proposed. More importantly, the negentropy measure should play a similar role to that of Kostic's count in predicting lexical decision latencies.
Method
We obtained the frequency counts and counts of number of syntactic functions and meanings (dened according to Kostic, 1965) from Kostic et al. (2003)'s experiments on Serbian mas-culine and feminine nouns. From the same dataset, we obtained the average visual lexical decision RTs to Serbian masculine and feminine nouns in each of their nominal inectional variants (uninected, or suxed with -a, -e, -i, -u, -om and -ima, for masculine nouns, and suxed with -a, -e, -i, -u, -om and -ama for feminine nouns; see Kostic et al. (2003) for details on the Serbian nominal declension system).
(three words to each side). To keep the level of linguistic information to a minimum, the words in the corpus were chosen to be masculine whenever their lemma in the CSL ended in a consonant, and feminine when it ended in vowel `a'. This is the most basic rule to attribute gender to Serbian nouns but many Serbian nouns deviate from that rule (e.g., gazda { \boss" { is a neuter despite ending in `a')`. However, using this simple rule enables us to ensure that most of the selected examples were of the targeted gender (this is reinforced by the constraint of selecting at most a single instance of any noun so that any exceptions would be selected at most once), while at the same time ensuring that the properties of the nouns would be detectable with a minimum requirement of linguistic annotation { i.e., just the lemmatization. In fact, these properties are shared with the nouns used in Kostic et al.'s experiments, and thus they provide a good reection of the conditioning that the experimental situation induced on the participants. By the above method, we obtained a sample of 6,500 contexts, 500 for each of the possible inectional variants in each gender (7 masculine and 6 feminine).
We constructed rst-order co-occurrence vectors for all words that occurred in the CSL with a frequency equal or higher than one per two millions. We selected the 1,000 most fre-quent word types in the corpus as context words, without removing function words or very high frequency words. This was done for two reasons: First, Lowe and McDonald (2001) showed that function and high-frequency words tend to be most informative when construct-ing semantic co-occurrence vectors. Second, in this study we are especially interested in the variation in morpho-syntactic properties of inectional axes, and this information is most clearly reected in the function words around them. The vectors we constructed were `un-transformed' in the sense that they plainly consisted of the raw counts of the number of times that a word would co-occur with each of the 1,000 context words within the seven word window. Although normalizing the vectors for dierent frequency counts or applying transformations such as the log-odds ratio appears to improve the quality of the semantic representations, keeping these transformations to a minimum enhances the biological plau-sibility of the model: Whichever transformations are adequate, should be detectable in an un-supervised manner from the distributional properties of the data.
of the 6,500 contexts. The second-order vectors for the contexts were computed as the av-erage of the rst-order vectors of the words in the window (excluding the word itself). The resulting second-order context vectors were subjected to a principal components analysis (PCA) (after centreing to zero, and scaling their components to unit variance). The rst six principal components accounted for 92% of the variance. We selected the rst six principal components of each of the vectors. This dimensionality reduction simplies the estimation of the underlying distribution without aecting the underlying PDF or uncertainty of data points except for a factor of scale in the EGE measure. At the same time the neurophys-iological plausibility of this transformation in a Hebbian system is ensured. Indeed, it is long known that neurons do perform operations which are equivalent to PCA (Oja, 1982). Finally, to ensure that the similarity space between the resulting vectors is dened by the Euclidean distance (in the untransformed vectors the distance would be dened by the angle formed between the vectors.), we normalized the vectors to having unit length. By this procedure we obtained a six-dimensional vector describing each of the 6,500 contexts.
For each sux, using the software for exible Bayesian modeling (FBM; Neal, 2004) we tted an innite mixture of Gaussians to the set of 500 six-dimensional vectors obtained above.2 After estimating the most probable mixture of Gaussians for the distribution of
context vectors, we used the samples of 500 points on which the density estimation was performed as a suitable sample of the distribution. Using the FBM tools we computed the probability p(xi) of each of the points in our sample, according to the corresponding
mixture, and then estimated the dierential entropy h(p) to be the negated average of the log probabilities using (3). We used these same samples to estimate the covariance matrix K for each sux, and calculate the entropy h(pN) of the corresponding normal distribution
(EGE) according to (2). Once both these entropies had been estimated, the value of the negentropy was computed using the denition in (1).
2The parameters used for the estimation of the Gaussian mixture were identical to those provided in
Results and discussion
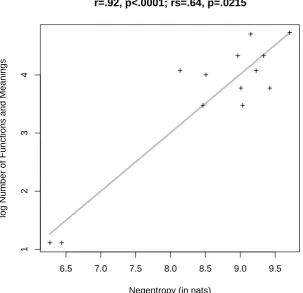
Figure 5 illustrates the correlation between Kostic's number of syntactic functions and mean-ings (vertical axis) and the negentropy of the contexts in which each Serbian sux is used (horizontal axis). The correlation seems to be high (r = :92; p < :0001) but note that most of this correlation could be driven by the two points at bottom left of the gure. A non-parametric Spearman rank correlation conrmed that the correlation is not fully driven by those two outliers (rs= :64; p < :0215).
[INSERT FIGURE 5 AROUND HERE]
The correlation between the number of syntactic functions and meanings of a Serbian sux and the estimated negentropy of its distribution of usages (having assumed a Gaussian mixture) provides support for our hypothesis that the eect of number of meanings reported by Kostic is a consequence of the competition between neural assemblies, especially so if we consider that it becomes apparent on such a small set of points, and that our negentropy measure was derived using several levels of approximation (i.e., of the representation of the contexts, of the distribution, and of the actual measure). However, the crucial point is to ensure that negentropy has an eect on lexical decision RTs similar to that of number of functions and meanings.
functions and meanings revealed signicant eects of frequency (F (1; 9) = 15:76; p = :0033) and negentropy (F (1; 9) = 7:84; p = :0188; after partialing out the contribution of sux frequency). These analyses indicate that both number of functions and meanings have similar eects on the reaction times. Unfortunately, given the high correlation between both counts it is not advisable to include both of them as predictors in a single regression, as doing so would introduce a strong collinearity that would make it impossible to assess the independent contribution of the eects (Belsley, 1991). Instead, we considered their contributions to explaining the variance on the RTs.
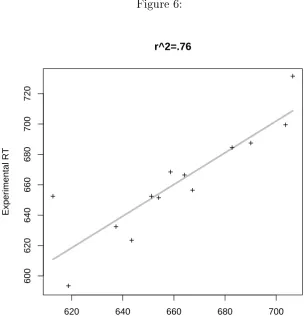
[INSERT FIGURE 6 AROUND HERE]
Figure 6 shows how well the reaction times are predicted only on the basis of sux frequency (and gender included as a random eect). As it can be observed, most of the variance (76%, uncorrected) in the data is already accounted for by frequency alone. Figure 7 illustrates the relationship between the residuals of the regression using only frequency as a xed eect, and the number of syntactic functions and meanings (right panel) or negentropy (left panel).
[INSERT FIGURE 7 AROUND HERE]
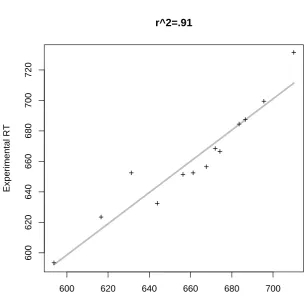
Both of the panels in Figure 7 show very similar patterns of predictivity. Both counts are directly related to the residuals, and even the pattern of outliers is similar across both plots. The improvement of adding the number of syntactic functions and meanings into the model is shown by Figure 8. Note that, although the margin for improvement over the 76% of variance that is accounted for just by frequency is rather small, there is still a clear increase in the predictivity of the model (approximately 15% additional explained variance).
[INSERT FIGURE 8 AROUND HERE]
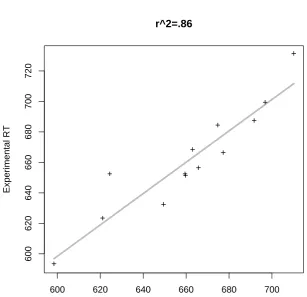
[INSERT FIGURE 9 AROUND HERE]
In the previous section, we had also predicted that the dierential entropy of an equivalent Gaussian distribution (EGE) should have an eect on response latencies, of opposite direction to the eect of the negentropy of the distribution. However, including EGE as an additional predictor in the previous regressions did not show any additional signicant eect, either in the regression including number of syntactic function and meanings (F < 1), or in the one using negentropy (F < 1).
In sum, we have seen that in this dataset, our negentropy measure shows similar eects to those of number of functions and meanings. Some of the explanatory power of the original count is lost when we use the negentropy instead of Kostic's original count. However, we consider that this is not a reason for concern, since the negentropy was calculated over a series of approximations using a small sample (500 occurrences) with little linguistic labeling. In contrast, the counts of number of functions and meaning were calculated by an exhaustive linguistic analysis across the whole CSL (Kostic, 1965). This predictivity is important in two directions: On the one hand, it provides a validation of the count provided by Kostic through un-supervised means. On the other hand, it provides an anchor at the neurophys-iological level for the eects of counts calculated through linguistic analysis, and it veries the predictions of the underlying neurophysiological level on the behavioral measures.
Analysis 2: Equivalent normal entropy and assembly width
In the previous section we have shown that the amount of competition between dierent assemblies that are candidates for activation given a particular form, measured as the the negentropy of the PDF of second order vectors, correlates negatively with average lexical decision latencies to Serbian inectional axes. Based on our neurophysiological model, we also predicted that time it takes one of the neural assemblies corresponding to a word to re should also be related to their combined likelihood of receiving activation. Following our prediction, this should be related to the area of the representational space that is covered by the components of the Gaussian mixture, measured by the dierential entropy of the equivalent normal distribution. If our assumptions are correct, this measure should relate to measures of the support of a word's morphological paradigm, such as the inectional entropy measure (Baayen, in press; Baayen & Moscoso del Prado Martn, 2005; Moscoso del Prado Martn et al., 2004), and should correlate negatively with both lexical decision latencies and errors.
Method
We constructed a experimental list of 85 monomorphemic words that appeared, across all inectional variants, at least 500 times (approximately 5 per million) in the British National Corpus (BNC3). For each word we extracted its surface frequency from the CELEX database
(Baayen, Piepenbrock, & Gulikers, 1995), and we computed inectional entropy using the CELEX frequencies, following the method described by Moscoso del Prado Martn et al. (2004). We extracted from the English Lexicon Project's database (Balota et al., 2002) visual lexical decision error scores and (average and by-participant) reaction times for each of the words.
From the BNC, we selected a sample of 500 random occurrences of each word (in any inectional variant). Each occurrence included the words located within a centered context window of seven words from the target (three words to each side). Using the same technique that we employed for Serbian, we constructed untransformed rst-order co-occurrence vectors
for all words that occurred in the corpus with a frequency equal or higher than one per two millions, using the 1000 most frequent type as context words. We used these rst order vectors to compute second-order co-occurrence vectors for each of the 42,500 occurrences (85 items 500 occurrences/item). The second-order vectors for the contexts were computed as the average of the rst-order vectors of the words in the window (excluding the word itself). The context vectors were subjected to a PCA (after centreing to zero, and scaling their components to unit variance). In order to speed the calculation the PCA rotation matrix, we randomly selected a subset of 30 occurrences for each of the target words, and the rotation matrix was computed on this smaller sample of 2,550 vectors. In this reduced set, the rst six principal components accounted for 92% of the variance. The resulting rotation matrix was applied to the full set of 42,500 context vectors, and for each vector, the rst six principal components were selected. Finally, to ensure that the similarity space between the resulting vectors is dened by the Euclidean distance, we normalized the vectors to having unit length. By this process we obtained a six-dimensional vector describing each of the 42,500 contexts. We estimated the covariance matrix of the 500 contexts for each of the words. With the estimated covariance matrix, we calculated the dierential entropy of the equivalent normal distribution for each of the words using (2). In addition, for comparison purposes, we tted a mixture of Gaussians to each of the sets of 500 contexts using the methods described in the previous section, and we estimated its dierential entropy and negentropy using (3) and (1).
Results and Discussion
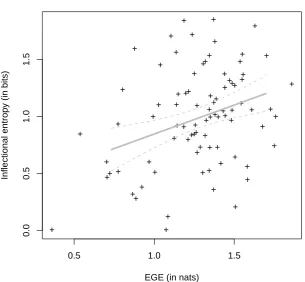
Figure 10 illustrates the relationship between the inectional entropy measure and the dif-ferential entropy of the Gaussian of equivalent covariance to its distribution of context vec-tors. Note that, although there is a signicant positive correlation, both by parametric (r = :34; p = :0014) and non-parametric methods (s = :28; p = :0085), this accounts for at
[INSERT FIGURE 10 AROUND HERE]
A multilevel regression tted to the log reaction times, with participant as a random eect and log frequency and inectional entropy as xed eects, revealed signicant main eects for both frequency (F (1; 1304) = 14:1; p = :0002) and inectional entropy (F (1; 1304) = 5:2; p = :0230, after partialing out the eect of frequency). This regression did not provide any evidence for mixed-eects of participant by frequency or participant by inectional entropy. A by-item regression on the log reaction times with log frequency and inectional entropy independent variables conrmed the main eect of frequency (F (1; 82) = 16:66; p = :0001) and that of inectional entropy (F (1; 82) = 6:73; p = :0112). A logistic regression to the number of correct and incorrect responses also revealed the same main eects of log frequency (2
1 = 8:19; p = :0042) and inectional entropy (21 = 5:40; p = :0202). Both
eects { frequency and inectional entropy { had negative coecients in the three regressions. According to parallel regressions using additional non-linear restricted cubic spline terms for the independent variables, no signicant non-linear components were detected for any of the eects in any of the three regressions. These analysis ensure that, as reported by Moscoso del Prado Martn et al. (2004), the inectional entropy measure has a facilitatory eect both on the response latencies and on the error scores.
In order to assess whether the EGE measure has a similar eect on the response latencies and errors, we added negentropy to the above regressions, after having partialed out the eect of inectional entropy (given the weak correlation between both counts, we found it safe to include them simulateneously in the same regression).
In the multilevel by-participant regression, EGE did not have any signicant eect (F (1; 1303) = 2:0; p = :1559) on the RTs on top of those of frequency and inectional entropy. However, when the eect of EGE is considered before that of inectional entropy, it is EGE that showed a signicant eect (F (1; 1303) = 4:4; p = :0352) while that of inec-tional entropy disappeared (F (1; 1303) = 2:8; p = :0969), indicating that both variables are capturing roughly the same part of the variance.
still had a signicant eect (F (1; 81) = 4:18; p = :0442), the eect of inectional entropy became only marginally signicant (F (1; 81) = 2:98; p = :0882). Indeed, a fast backwards elimination of factors using Akaike's information criterion (Lawless & Singhal, 1978) on this regression recommended keeping EGE as an independent variable, and removing inectional entropy as a predictor from the regression. After excluding inectional entropy from the regression, the eect of EGE became even more clear (F (1; 82) = 6:73; p = :0112). We observed a similar pattern when we added EGE to the logistic regression on the error counts. After adding EGE into the model, the eect of inectional entropy became un-signicant (2
1 = 1:82; p = :1769) while that of EGE approached signicance (21 = 3:79; p = :0515).
Once again, the fast backward elimination of factors suggested deleting inectional entropy from the model. After doing this, the eect of EGE reached full signicance (2
1 = 7:65; p =
:0057). As it was the case with the eects frequency and inectional entropy, no additional non-linear component was present in the eects of EGE on response latencies and errors.
Finally, we assessed the contribution of negentropy by adding the term in the regressions after partialing out the eects of frequency and EGE. Negentropy did not add any signicant contribution to the analyses on the RTs (F (1; 1303) = 2:1; p = :1492 by-participant, and F < 1 by-item), or error counts (2
1 = :11; p = :7432).
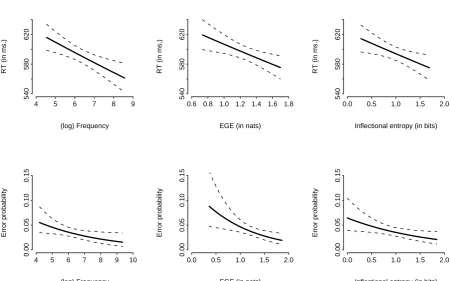
[INSERT FIGURE 11 AROUND HERE]
The conclusion of these analyses is that, although the correlation between inectional entropy and EGE is relatively weak, they both appear to be capturing the same part of the variance of RTs and errors. The explanatory power of EGE seems to be, if anything, superior to that of inectional entropy. Figure 11 summarizes the eects (as estimated in the regressions) of frequency (left column), EGE (middle column), and inectional entropy (right column), on the RTs (top row) and error scores (bottom row). Note that while the magnitude of the eect of EGE on the RTs is only slightly larger than that of inectional entropy, this dierence becomes more marked in the error analyses, where the eect of EGE is clearly more pronounced.4
4The non-linearities in the graphs are due to the back transformation from the logarithm in the case of
These results show that, as we predicted, the eect of inectional entropy can be seen as a higher level parallel of the eect of the overall spread the distribution of meanings that would be predicted by a model based on neural assemblies. In contrast to the RTs to Serbian inectional axes, we did not observe any eects of negentropy on this dataset. This is due to the words in this experiment not oering any particular contrast in number of functions and meanings. They were all selected to be monomorphemic nouns, some of which could also have verbal conversions but, in general, there was no particularly great variation in the number of meanings. In principle, we would expect the eect of negentropy to show an additional contribution to the responses to sets of words that have been designed to contrast levels of ambiguity. For this purposes, we now turn to investigate the eects of homonymy and polysemy reported by Rodd et al. (2002).
Analysis 3: Polysemy and homonymy
Rodd et al. (2002) showed that a distinction should be made between polysemous words, having more than one related senses, and homonymic words, having more than one unre-lated meanings. They found that in both visual and auditory lexical decision tasks, words that have many senses are recognized faster than words than have few senses and, at the same time, words that have many meanings are recognized slower than words that have few meanings. Beretta et al. (2005) and Pylkkanen et al. (in press) conrmed these results, and showed that the dierences are related to dierences in the M350 component in Magneto Encephalography. As we argued above, this distinction is analogous to the opposite eects of negentropy and EGE: The inhibitory eect of having many unrelated meanings is equivalent to the amount of competition between dierent assemblies, that we measured by means of the negentropy of its distribution of usages, while the amount of facilitation provided by related senses is indexed by the with of the equivalent Gaussian distribution (EGE). In this section we investigate in detail this relationship.
Method
We selected from the 128 words used in Rodd et al. (2002)'s visual lexical decision experiment (Experiment 1) all 97 items for which we could nd at least ve hundred occurrences in the BNC and response latencies in the Balota et al. (2002) database. As this selection decreased the power of the original design (to the extent that both of the eects reported by Rodd and colleagues disappeared) we added 93 additional homonymic words for which we could also nd lexical decision RTs from the Balota et al. database and 500 occurrences in the BNC. Of these additional 93 words, 47 were classied as homonyms (having more than one entry in the Oxford English Dictionary), while the remaining 46 were left uncontrolled, but matched for frequency with the homonymic ones. In this way, we have extended Rodd et al.'s original dataset to have a more continuous degree of variation between homonymy and polysemy, instead of the original purely orthogonal design. In total we have now 190 words, 92 of which are classied as homonyms and 98 are mostly non-homonymic.
From the BNC, we selected a sample of 500 random occurrences of each word (in any inectional variant). Each occurrence included the words located within a centered context window of seven words from the target (three words to each side). As was done in the previous section, we constructed untransformed rst-order co-occurrence vectors for all words that occurred in the corpus with a frequency equal or higher than one per two millions, using the 1000 most frequent type as context words. We used these rst order vectors to compute second-order co-occurrence vectors for each of the 95,000 occurrences (190 items 500 occurrences/item). The second-order vectors for the contexts were computed as the average of the rst-order vectors of the words in the window (excluding the word itself).
selected. Finally, as was done in the previous analyses, we normalized the vectors to having unit length to ensure that the similarity space between the resulting vectors is dened by the Euclidean distance. By this process we obtained a six-dimensional vector describing each of the 95,000 contexts.
We estimated the covariance matrix of the 500 contexts for each of the words. With this covariance matrix, we calculated the dierential entropy of the equivalent normal distribution for each of the words using (2). Using the same methods as in the two previous sections, we tted a mixture of Gaussians to each of the sets of 500 contexts, and we estimated its dierential entropy and negentropy using (3) and (1).
Results and Discussion
A multilevel regression tted to the log reaction times, with participant as a random eect and log frequency, EGE and negentropy as xed eects, revealed signicant linear eects for frequency (F (1; 3512) = 17:0; p < :0001) and EGE (F (1; 3512) = 37:3; p < :0001, after partialling out the eect of frequency), and an eect of negentropy (F (1; 3512) = 3:2; p < :0001, after partialling out the contributions of frequency and EGE) that was signicantly non-linear (L(6; 7) = 3:86; p = :0494). This regression did not provide any evidence for mixed-eects of participant by frequency or participant by inectional entropy. A by-item regression on the log reaction times with log frequency, EGE and negentropy as independent variables conrmed the linear eects of frequency (F (1; 186) = 10:22; p = :0001) and the eect of EGE (F (2; 186) = 11:16; p < :0001), which had a signicant non-linear component (F (1; 186) = 4:03; p = :0461). No eect of negentropy (F (1; 185) = 1:61; p = :2063, after partialling out the eects of frequency and EGE) was detected in this regression.
A logistic regression to the number of correct and incorrect responses also revealed the a main eect of log frequency (2
2 = 18:56; p < :0001), with a signicant non-linear component
(2
1 = 4:67; p = :0307) and a linear eect of EGE (21 = 30:72; p < :0001), without any
signicant contribution of negentropy (2
1 = 0:00; p = :9945).
Figure 12 illustrates the non-linearities observed in the eects of EGE and negentropy on the response latencies. Note that both eects seem to have opposite directions, and a clear attenuation of the eect in the higher part of their range. In addition, the eect of negentropy was much smaller and { after partialing the out contribution of EGE { only reached signicance in the more sensitive multilevel regression on the RTs, but appeared to be too weak to show up in the by-item regression or in the error analyses.
A possible reason for the non-linear attenuation of the eects of EGE and negentropy, and for the relative unstability of the second one, comes from the fact that, in this dataset, both measures are mildly correlated with each other (r = :29; p < :0001), combined with the smaller magnitude of the eect of negentropy in relation with that of EGE. The left panel in Figure 13 shows the correlation between the negentropy and EGE measures. This negative correlation might indeed account for the attenuation of the eect of negentropy on the multilevel regression and the attenuation of EGE and disappearance of negentropy in the by-item regression. We can test this hypothesis by decorrelating both variables. As their inter-correlation is moderately weak, and the eect of EGE is relatively strong compared to that of negentropy, we can discount from the EGE count that part of its variance that can be predicted by the negentropy through a linear regression. In this way we obtain a residualised count that is orthogonal to negentropy but still captures most of the variation of EGE, as it is shown in the right panel of Figure 13. If our hypothesis is correct, using this residualised count on the above regressions, would make both eects linear, and would make the inhibitory role of negentropy more stable, even in the less sensitive by-item regression.
[INSERT FIGURE 13 AROUND HERE]
(F (1; 186) = 14:00; p = :0002) and negentropy (F (1; 186) = 5:18; p = :0240), without any signicant non-linearity in the eects. Introducing the residualized measure in the logistic regression on the error counts, revealed a non-linear eect of frequency (2
2 = 18:53; p <
:0001; non-linear component 2
1 = 4:63; p = :0314) and a linear eect of residualized EGE
(2
1 = 28:27; p < :0001), with no signicant contribution of negentropy (21 = 2:05; p =
:1524). However, fast backwards elimination of factors using Akaike's information criterion recommended that, although not signicant according to the 2 test, keeping the negentropy
as a predictor in the regression model still produced a signicant improvent in the quality of the t.
As we had predicted, these analyses show that the unstability in the eect of negentropy is indeed a by-eect of its relatively small magnitude and its correlation with the EGE measure. However, although less marked, the attenuation of the eect of negentropy for the upper tertile remained signicant in the multi-level regression (see Figure 14). This nonlinearity may reect that our count is overestimated in its upper range, as a result of the multiple approximations that were performed to estimate it. This can also be a consequence of having used equal size samples to estimate the underlying distribution on all words, independently of their dierent frequencies of occurrence. This might have led to an overestimation of the negentropy for low frequency as compared to high frequency ones. However had we used unequally sized samples, it would have become very dicult to disentangle the eect of frequency from that of negentropy.
[INSERT FIGURE 14 AROUND HERE]
Finally, in order to compare the inhibitory eect of word homonymy described by Rodd et al. (2002) and Beretta et al. (2005), we added the factor homonymy (homonymic vs. non-homonymic) to the above regressions, after partialing out the contribution of the other eects.
the by-item regression the eect of homonymy was marginally signicant when included in a regression that also includes negentropy (F (1; 185) = 2:96; p = :0872), while negen-tropy retained its full signicance. The backwards elimination of factors recommended that both negentropy and homonymy should be kept in the regression model. Finally, including homonymy as a factor in the logistic regression on the error counts did not show any addi-tional eect (2
1 = :59; p = :4433), and fast backwards elimination of factors also suggested
to remove it from the regression. Figure 15 compares the contributions of EGE, negentropy, and homonymy on the RTs. For simplicity, we have estimated the three eects using the by-item regression (thus the linearity of the eect of negentropy). It can be observed that the contribution of the homonymy factor is smaller than that of negentropy (approximately 15 vs. 25 ms.). This reects the advantage of having a continuous (although innaccurate) estimate. Both eects are small compared to the eect of EGE (approximately 45 ms.).
[INSERT FIGURE 15 AROUND HERE]
These analyses show that the eects of negentropy and homonymy are indeed related and negentropy seems to be a more solid predictor (i.e., the inclusion of negentropy into the model substantially weakens the contribution of the homonymy factor). However there is still some additional variance explained by homonymy on the RTs. Again, this possibly reects the limitations of our estimation process.
General Discussion
This study addressed the link between neurophysiological theories of language processing, and the eects that have been observed in behavioral experiments. We have shown that information-theoretical measures in combination with Bayesian distribution tting provide us with a powerful tool to investigate this link. We have used multidimensional probability distributions to characterize four basic properties of Pulvermuller (1999)'s neurophysiological theory of lexical/morphemic processing:
ii The assemblies are formed by Hebbian association.
iii A discrete number of assemblies develops as a result of linguistic experience. iv Dierent candidate assemblies will compete.
We have demonstrated the power of this technique by predicting the eects of the morpholog-ical and semantic negihborhoods of words on the response latencies and error scores of three visual lexical decision datasets. This is a promising method that enables us to achieve the integration between the dierent levels of explanation that were anticipated by Marr (1982).
Information theory and lexical neighborhoods
Information theory has a long tradition of use in psychological research. As early as 1949, Miller and Frick showed that response sequences in behavioral experiments could be mea-sured in information-theoretical terms (Miller & Frick, 1949). In the eld of motor behavior, the classical Fitts' Law (Fitts, 1954; Fitts & Peterson, 1965) constitutes a prime example of the application of information-theory to psychological theories.6 Information measures have
been shown to correlate with accuracy in discrimination tasks in auditory, gustatory, and visual modalities (see Attneave, 1959 and Miller, 1956 for reviews on early applications of information theory to psychology, and Baddeley, Hancock, and Foldiak, 2000, for a more recent survey). More recently, entropy has been found to correlate with response latencies in cognitive control tasks (Koechlin, Orly, & Kouneiher, 2003). Koechlin et al. found that the amount of information (i.e., entropy) conveyed by the instruction cues, context, and stimuli of several functional magnetic resonance imaging experiments, predicts the amount of activation observed in several areas of the lateral pre-frontal cortex. Most interestingly this includes Broca's area (Brodman's areas 44 and 45), which is long assumed to be also involved in language processing.
Coming to the domain of language, the model that we have presented is related to previous information-theoretical models. Most evidently, our denition of negentropy builds
6In fact, in MacKenzie's reformulation (MacKenzie, 1992), Fitts' Law actually corresponds to the
on Kostic's nding of the inhibitory eect on response latencies of the count of syntactic functions and meanings of a Serbian inectional ax (Kostic, 1991; 1995; 2005; Kostic et al., 2003). Our study extends this approach in several aspects: On the theoretical side, the BIT model provides a anchor for the models developed by Kostic and his colleagues, by showing how these eects might arise from the properties of the neurophysiological system. Furthermore, in the behavioural level, our model integrates the eects reported by Kostic et al. for Serbian inectional morphology, with those reported by Moscoso del Prado Martn et al. (2004) for Dutch inectional and derivational morphology, and the eects reported by Rodd et al. (2002) on the semantic level. Finally, more on the technical side, the techniques that we have developed here also provide a method for automatically estimating Kostic (1965)'s counts in languages where resources as detailed as the Corpus of Serbian Language are not available.
the results presented here and those of McDonald and Shillcock. They observe that word frequency and CD are interchangeable as predictors of the lexical decision RTs, and they conclude that both magnitudes are reecting the same eect (i.e., frequent words are recog-nised faster than infrequent ones because the former tend to appear in a wider variety of contexts then the later). However, as shown by Analyses 2 and 3, both the variability of the contexts in which a word occurs (measured by the EGE) and its frequency, have independent contributions to explaining the RTs and error scores. Our results are consistent with the independent eects that of word frequency and semantic variability (Jastrzembski, 1981). Therefore, our analyses support the separate consideration of the eects the word frequency eect and variability in usage of words.
We have addressed the questions of the origin of these neighborhood eects, and of the reasons why information-theoretical measures appear to be most succesful in characterizing them. We have seen how the processes of inter-assembly competition can be characterized by the negentropy of a probability distribution, that follows directly from the assumption of competition between assemblies. This is directly linked with the inhibitory eects of the number of syntactic functions and meanings of a Serbian inectional morpheme (Kostic et al., 2003), and with the inhibitory eect of the degree of homonymy of an English word (Rodd et al., 2002). Simultaneusly, we have described the how the general width of the probability distribution { measured by the EGE { is related to the ease of activation of a particular set of assemblies. This measure is negatively correlated with response latencies and error scores, thus predicting the eects of semantically related morphological relatives described by Moscoso del Prado Martn et al. (2004), and of the number of related meanings (Jastrzembski, 1981; Rodd et al., 2002). It remains to be seen whether the eects of phono-logical and orthographic neighborhoods can also be replicated using this techniques, but the large amount of parallelism to morphological and semantic neighborhoods suggest that this might also be the case. In this respect, Luce and Large (2001) described the eects of phonological neighborhoods using a measure which is very related to the inectional entropy measure reported in morphology.
of the Clarity of a particular speaker calculated on the probability distribution of the fre-quency formants F 1 and F 2 of a sample of vowels produced by that speaker. He showed that a speaker's Clarity correlates with the error scores produced by participants whose task was to auditorily recognize utterances by the same speaker. Aylett used the EM algorithm to t the probability distribution as a nite mixture of Gaussians (with the number of components xed to the number of English vowels). Although Aylett explicitly denies any relationship between his Clarity measure and entropy (p. 218), his measure is in fact identical (save for a change in sign) to the MonteCarlo estimator that we used for estimating the entropy the multidimensional distributions. He reports that the Clarity measure correlates positively with the ability of subjects to recognize words, however, this eect seems to be weak. Note that the Clarity measure is equivalent to a negentropy measure without normalizing for the EGE. Another iterpretation of the results would thus be that subjects are better at recogniz-ing vowels whenever there is more information about them present in the signal. Of course, to measure this information (as the degree of clustering in the vowel space) one would also need to normalize for the general width of the distributions (through EGE). We believe that this parallelism is not merely coincidental: The mixture of Gaussians employed to model the probability distribution of the formants could well correspond to the underlying neural structures representing the phonemes.