Neuropsychiatric Disease and Treatment
Dove
press
O r i g i N a l r e s e a r c h
open access to scientific and medical research
Open access Full Text article
a voxel-based morphometric study of age- and
sex-related changes in white matter volume in the
normal aging brain
haijing liu* lixin Wang* Zuojun geng Qingfeng Zhu Zhenhu song ruiting chang huandi lv
Department of radiology, second hospital of hebei Medical University, shijiazhuang, People’s republic of china
*These authors contributed equally to this work
Objective: To carry out a cross-sectional study of 187 cognitively normal Chinese adults using the voxel-based morphometry (VBM) approach to delineate age-related changes in the white matter volume of regions of interest in the brain and further analyze their correlation with age.
Materials and methods: A total of 187 cognitively normal adults were divided into the young, middle, and old age-groups. Conventional magnetic resonance imaging was performed with the Achieva 3.0 T system. Structural images were processed using VBM8 and statistical parametric mapping 8. Regions of interest were obtained by WFU PickAtlas, and all realigned images were spatially normalized.
Results: Females showed significantly greater total white matter volume than males (t=2.36,
P=0.0096, false-discovery rate [FDR] corrected). VBM demonstrated statistically significant age-related differences in white matter volume between the young age-group and the middle age-group (P,0.05, FDR corrected) and between the middle age-group and the old age-group (P,0.05, FDR corrected). No interaction was found between age and sex on white matter volume (P.0.05, FDR corrected). Logistic regression analysis revealed nonlinear correlation between total white matter volume and age (R2=0.124, P,0.001). White matter volume gradually increased before
40 years of age, peaked around 50 years of age, and rapidly declined after 60 years of age.
Conclusion: Significant age-related differences are present in white matter volume across multiple brain regions during aging. The VBM approach may help differentiate underlying normal neurobiological aging changes of specific brain regions from neurodegenerative impairments.
Keywords: brain, aging, magnetic resonance imaging, ROI, white matter volume, voxel-based
morphometry
Introduction
Normal brain aging is a physiological process accompanied by declines in the function of multiple systems in the body, including age-related cognitive decline, which is manifested as a decline in executive function and memory.1 Investigation of age-related brain changes helps in understanding the evolution of degeneration and its mechanisms, and assists in the differentiation of the normal aging brain from neurodegenerative diseases. However, magnetic resonance imaging (MRI) study of brain aging has mostly focused on changes in the gray matter. The white matter is an important component of the human brain, and is responsible for transmitting neural communication between regions in the gray matter. Histopathologic studies reveal that brain aging is marked by loss of myelinated fibers, and bulk-volume loss of white matter is also demonstrated on MRI.2 The distribution of white matter shows regional differences. It has been shown the volume reduction is more apparent in the white
correspondence: Zuojun geng Department of radiology, second hospital of hebei Medical University, 215 West heping road, shijiazhuang, hebei 050000, People’s republic of china Tel +86 158 0321 0615
email [email protected]
Journal name: Neuropsychiatric Disease and Treatment Article Designation: Original Research
Year: 2016 Volume: 12
Running head verso: Liu et al
Running head recto: Age- and sex-related changes in white matter volume DOI: 90674
Neuropsychiatric Disease and Treatment downloaded from https://www.dovepress.com/ by 118.70.13.36 on 25-Aug-2020
For personal use only.
Number of times this article has been viewed
This article was published in the following Dove Press journal: Neuropsychiatric Disease and Treatment
Dovepress
liu et al
matter than in the gray matter, especially in the frontal lobe and corpus callosum. Jernigan et al3 observed a 26% reduc-tion in white matter tissue volume relative to a 14% reducreduc-tion in gray-matter tissue volume.4
The volume of the white matter is currently mostly deter-mined by voxel-based morphometry (VBM), which shows morphological changes of the white matter by calculating the volume and density of the white matter. Through standardiza-tion, segmentastandardiza-tion, smoothing, and construction of models from smoothed images and by statistical parametric mapping (SPM), VBM can reveal focal differences in brain regions among people of different ages. VBM using structural brain MRI has been widely used for assessment of the normal aging brain and neurodegenerative diseases, such as Alzheimer’s disease. We hypothesized that age- and sex-related differ-ences are present in white matter volume across multiple brain regions during aging and that VBM helps differentiate underlying normal neurobiological aging changes of specific brain regions from neurodegenerative impairments. In the current study, we carried out a cross-sectional study of 187 cognitively normal Chinese adults of either sex using the VBM approach to delineate age- and sex-related changes in the white matter volume of regions of interest (ROIs) in the brain and further analyzed their correlation with age.
Materials and methods
subjects
Healthy volunteers were recruited between August 2013 and November 2013. The study protocol was approved by the institutional review board at the Second Hospital of Hebei Medical University. All participants received written and oral information prior to giving written consent, and the study was performed in accordance with the Helsinki II declaration. The inclusion criteria were as follows: 1) right-handedness; 2) native Mandarin speaker; 3) good eyesight and hearing and speaking ability; 4) the Mini-Mental State Examination score .27; 5) no history of nervous system disease or mental illness, such as headache, dizziness, lethargy, seizure, or emo-tional disturbance; 6) no previous cerebral surgery or trauma, no hypertension (.140/90 mmHg in those aged 60 years and above), diabetes, heart diseases, or other chronic diseases; 7) no alcoholism (defined as consuming more than three alcoholic drinks a day), smoking (defined as three cigarettes per day), long-term medication, or drug addiction; 8) no contraindication for MRI, such as cardiac pacemaker, nerve stimulator, metal artery clip, or metal false tooth; 9) no his-tory of seizure, convulsion, cerebritis, or meningitis; 10) no history of cerebral hypoxia or carbon monoxide or other toxin
poisoning; and 11) no abnormality on conventional cerebral MRI, or the presence of hyperintensity signal ,2 according to the Wahlund scale,5 or number of scattered degenerative lesions fewer than five. The subjects were divided into a young age-group (20–40 years of age), a middle age-group (41–59 years of age), and an old age-group (60–78 years of age) as previously described.5–7
cerebral Mri
Conventional MRI was performed with the Achieva 3.0 T system (Philips, Amsterdam, the Netherlands) using an eight-channel head coil, and included T1 fast field echo, axial T1-weighted imaging (T1WI), axial and sagittal
T2-weighted imaging (T2WI), and axial T2 fluid-attenuated inversion recovery. The main parameters were as follows: axial T1WI, turbo spin echo (TSE) sequence repetition time (TR) 3,056 ms; echo time (TE) 7.6 ms; inversion time 860 ms; axial T2WI, TSE sequence TR 500 ms; TE 80 ms; axial T2 fluid-attenuated inversion recovery, TR 9,000 ms; TE 140 ms; inversion time 2,600 ms. For these sequences, the slice thickness was 6.0 mm, slice interval 1.0 mm, matrix 512×256, field of view (FOV) 230×220 mm, flip angle 90°, and number of excitations (NEX) 1. The parameters for sagittal T2WI were as follows: TSE sequence, TR 1,707 ms; TE 80 ms; slice thickness 6.0 mm; slice interval 1.0 mm; matrix 328×235, FOV 230×230×121 mm (length × width ×
height), and NEX 1.
T1W 3-D imaging
The patient was placed in the supine position and kept immobile. Sagittal high-resolution T1W 3-D T1 fast field echo was carried out with the axial scan parallel to the anterior commissure–posterior commissure line. The scan parameters were as follows: TR 7.8 ms, TE 3.8 ms, flip angle 8°, matrix size 252×227, voxel size 1×1×1 mm, FOV 250×250×180 mm, slice thickness 1 mm, slice interval 0 mm, number of slices scanned 180, scan time 2 minutes 58 seconds, and NEX 1.
Voxel-based morphometry
Structural images were processed using the VBM toolbox (VBM8) (http://dbm.neuro.uni-jena.de/vbm) and statisti-cal parametric mapping (SPM)8 (http://www.fil.ion.ucl. ac.uk/spm; Wellcome Trust Centre for Neuroimaging, London, UK), which combines tissue segmentation, bias correction, and spatial normalization into a unified mode. Individual brains were normalized to tissue probability maps using the International Consortium for Brain Mapping.
Neuropsychiatric Disease and Treatment downloaded from https://www.dovepress.com/ by 118.70.13.36 on 25-Aug-2020
Dovepress age- and sex-related changes in white matter volume
The voxelization of structural images was 1.5×1.5×1.5 mm. The images were segmented into gray matter, white matter, and cerebrospinal fluid by using the new segmentation in SPM8. The optimally processed images were smoothed with an isotropic Gaussian kernel (full-width half-maximum =8 mm). The total volume of the gray matter, white matter, and cerebrospinal fluid was determined, and the total intracranial volume was calculated from the sum of the volume of the gray matter, white matter, and cerebrospinal fluid. The effects of total gray-matter volume were removed to allow inferences between regional differences in white matter volume.
Measurement of volume using rOis
ROIs were obtained by WFU PickAtlas,8 and all realigned images were spatially normalized to the Montreal Neuro-logical Institute echo-planar imaging template in SPM8.9 We used the following ROIs (Figure 1): left and right frontal lobe, left and right parietal lobe, left and right temporal lobe,
left and right occipital lobe, left and right cerebrum and corpus callosum, midbrain, pons, and medulla oblongata. The significance of group differences in each region was estimated by distributional approximations from the theory of random Gaussian fields.
statistical analysis
Data were expressed as means ± standard deviation and analyzed using SPSS software version 13.0 (SPSS Inc, Chicago, IL, USA). Sex-related differences in the white matter volume of the whole brain were examined using the
t-test for two independent samples, with age and total
intracra-nial volume as covariates. Age-related differences in the white matter volume of the whole brain were examined by two-way analysis of variance. The total intracranial volume was used as the covariate, and absolute voxel values .0.1 mL were included in the analysis. The false-discovery rate (FDR) was used for comparison correction, and P,0.05 was considered
Figure 1 region of interest templates bundled in WFU Pickatlas overlaid on the Montreal Neurological institute standard brain.
Notes: (A) Frontal lobe, (B) parietal lobe, (C) temporal lobe, (D) occipital lobe, (E) cerebellum, (F) corpus callosum, (G) mesencephalon, (H) pons, (I) medulla oblongata.
Neuropsychiatric Disease and Treatment downloaded from https://www.dovepress.com/ by 118.70.13.36 on 25-Aug-2020
Dovepress
liu et al
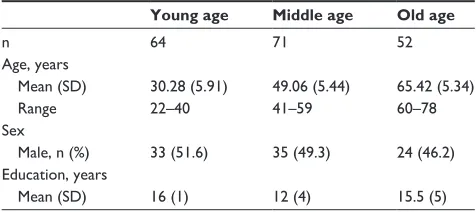
Table 1 Demographic data of the study subjects
Young age Middle age Old age
n 64 71 52
age, years
Mean (sD) 30.28 (5.91) 49.06 (5.44) 65.42 (5.34)
range 22–40 41–59 60–78
sex
Male, n (%) 33 (51.6) 35 (49.3) 24 (46.2)
education, years
Mean (sD) 16 (1) 12 (4) 15.5 (5)
Abbreviation: sD, standard deviation.
Table 2 sex-related differences in white matter volume by voxel-based morphometry Coordinates (mm) P-value (corrected) Z
x y z
Female . male
left insular lobe -38 -12 13 0 5.58
anterior lobe of left cerebellum -11 -61 -33 0 5.42
right limbic lobe 20 -31 -8 0 5.27
left superior frontal gyrus -20 36 -21 0 4.26
left occipital lobe -14 -82 31 0 4.10
right occipital lobe 21 -87 35 0 3.76
right frontal lobe 11 47 -26 0 3.63
right temporal lobe 47 -14 -39 0 3.49
right parietal lobe 44 -43 40 0 3.47
Male . female
Posterior lobe of right cerebellum 11 -55 -54 0 5.22 Posterior lobe of left cerebellum -30 -61 -56 0 4.91 straight gyrus of right frontal lobe 9 24 -21 0 3.64 left posterior superior temporal
gyrus
-48 -54 19 0 3.71
straight gyrus of left frontal lobe -5 26 -15 0 3.29 right superior frontal gyrus 20 65 6 0.001 3.18 right external capsule of insular
lobe
30 11 -3 0.001 3.10
left parietal lobe -38 -73 40 0.001 3.07
left middle frontal gyrus -42 18 27 0.002 2.94
left occipital lobe -6 -84 10 0.002 2.81
statistically significant. The cluster-level statistical threshold was set at 20 for statistically significant difference between brain regions. Correlation of changes in white matter of different brain regions during aging and age was studied by multiple-regression analysis in SPM. Age was an indepen-dent variable,2 and the volume of white matter was used as a dependent variable in regression analysis.
Results
sex-related differences in white matter
volume by VBM
A total of 187 subjects – 92 males and 95 females – were included in the study. Their mean age was 47.2 (range 20–78) years. The baseline and demographic data of the study sub-jects are shown in Table 1. There was no statistical differ-ence in education status (analysis of variance, P=0.077) or sex (χ2 test, P=0.490) among the three groups. Sex-related white matter volume of brain regions are shown in Table 2 and Figure 2. Overall, females showed significantly greater total white matter volume than males (t=2.36, P=0.0096, FDR corrected). Females showed greater white matter volume in the medulla oblongata, pons, bilateral crus cerebri, bilateral medial temporal gyrus, bilateral anterior lobe of the cere-brum, bilateral superior frontal gyrus, orbital gyrus of the left frontal lobe, bilateral parietal lobe, and genu of the cingulate gyrus. Males showed greater white matter volume of the bilateral posterior lobe of the cerebellum, bilateral external capsule of the insular cortex, bilateral straight frontal gyrus, and bilateral parietal lobe.
age-related differences in white matter
volume by VBM
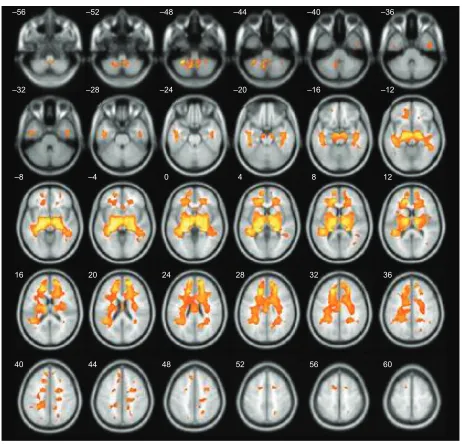
VBM demonstrated statistically significant age-related differ-ences in white matter volume between the young age-group and the middle age-group (P,0.05, FDR corrected). Age-related white matter volumes of brain regions are shown in Table 3 and Figure 3. Middle-aged subjects showed greater
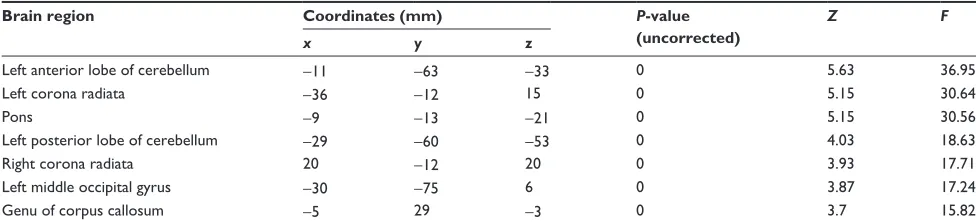
white matter volume than young subjects in the bilateral straight frontal gyrus, bilateral precentral gyrus, bilateral corona radiata, bilateral anterior limb of the internal capsule, right external capsule, right middle cerebellar peduncle, bilateral uncinate gyrus, bilateral lentiform nucleus, and right occipital lobe (P,0.001, uncorrected). Furthermore, the white matter volume of the corpus callosum peaked at the young age and remained stable, and apparent decline was observed after the subjects were 70 years of age (Figure 3C). When uncorrected for multiple comparisons, female and male subjects showed significant dif-ference in the left anterior and posterior lobe of the cerebellum, bilateral corona radiata, pons, left occipital gyrus, and genu of the corpus callosum (Figure 4 and Table 4). No interaction was found between age and sex on white matter volume in young and middle-aged subjects (P.0.05, FDR corrected).
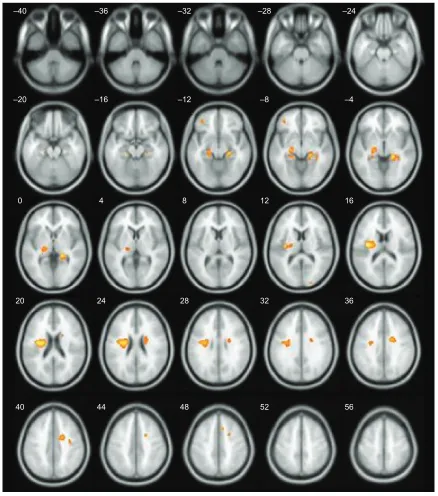
VBM further revealed statistically significant age-related differences in white matter volume between the middle age-group and the old age-group (P,0.05, FDR corrected). Compared to middle-aged subjects, old subjects showed lower white matter volumes in bilateral medial and inferior temporal gyri, bilateral middle frontal gyri, left inferior fron-tal gyrus, bilateral cerebra, and other brain areas, as shown in Table 5 and Figure 5. No interaction was found between
Neuropsychiatric Disease and Treatment downloaded from https://www.dovepress.com/ by 118.70.13.36 on 25-Aug-2020
Dovepress age- and sex-related changes in white matter volume
± ± ± ± ± ± ±
± ± ± ± ± ± ±
± ± ± ± ± ±
Figure 2 White matter volume differences between female and male subjects.
Notes: Colored voxels show significantly different regions of interest between females and males. The numbers in the top left corner of each image indicate their position
in the three-dimensional coordinate axis. The red color stands for female and blue stands for male. red indicates that females have higher white matter volume, and blue indicates that males have higher white matter volume. Data shown are after false-discovery rate correction.
Table 3 age-related white matter changes in brain regions between young adults and middle-aged adults by voxel-based morphometry
Brain region Coordinates (mm) P-value
(uncorrected)
Z F
x y z
right lentiform nucleus 18 14 -11 0 6.56 51.48
right straight gyrus of the frontal lobe 11 30 -21 0 4.73 25.74
left lentiform nucleus -20 9 -6 0 5.02 29.04
left corona radiata -15 -6 21 0 5.01 28.95
left straight gyrus of the frontal lobe -5 29 -15 0 4.96 28.33
left precentral gyrus -35 -24 60 0 4.83 26.76
right precentral gyrus 36 -21 60 0 4.34 21.62
right middle cerebellar peduncle 15 -46 -23 0 4.30 21.25
left gyrus uncinatus -32 0 -29 0 3.93 17.76
right occipital lobe 26 -88 -9 0 3.45 13.80
age and sex on white matter volume in middle-aged and old subjects (P.0.05, FDR corrected). Statistically significant age-related differences in white matter volume were also noticed between the young age-group and the old age-group (P,0.05, FDR corrected). Compared to young subjects, old
subjects showed lower white matter volumes in the bilateral frontal lobe, bilateral occipital lobe, and other brain areas, as shown in Figure 6 and Table 6. When not corrected for multiple comparison, females showed greater white matter volumes than males, including bilateral corona radiata, left
Neuropsychiatric Disease and Treatment downloaded from https://www.dovepress.com/ by 118.70.13.36 on 25-Aug-2020
Dovepress
liu et al
$JH\HDUV
&RUSXVFDOORVXPYROXPH
9ROXPHRIZKLWHPDWWHUP/
&
2EVHUYHG 4XDGUDWLF
$
%
630)
Figure 3 White matter volume changes between middle-aged adults and young adults.
Notes: (A) Different brain-area perspectives, statistical parametric mapping (sPM) results: height threshold F=7.499704 (P,0.05 [FDr]), extent threshold k=20 voxels; and (B) 3D brain mapping show main effect of age on white matter volume changes. Data shown are after false-discovery rate (FDr) correction. (C) White matter volume of
the corpus callosum and age. R2=0.070, P,0.039.
external capsule, right cingulate gyrus, posterior limb of the left internal capsule, bilateral parahippocampal gyrus, and left middle frontal gyrus (Figure 7 and Table 7). No interaction was found between age and sex on white matter volume in young and middle-aged subjects (P.0.05, FDR corrected).
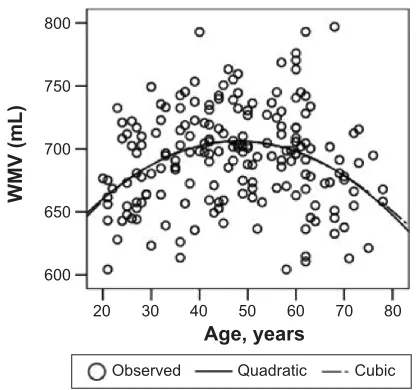
correlation of white matter volume
and age
Logistic regression analysis use age2 as an independent variable and total white matter volume as a dependent vari-able and total intracranial volume as a covariate revealed nonlinear correlation between total white matter volume and
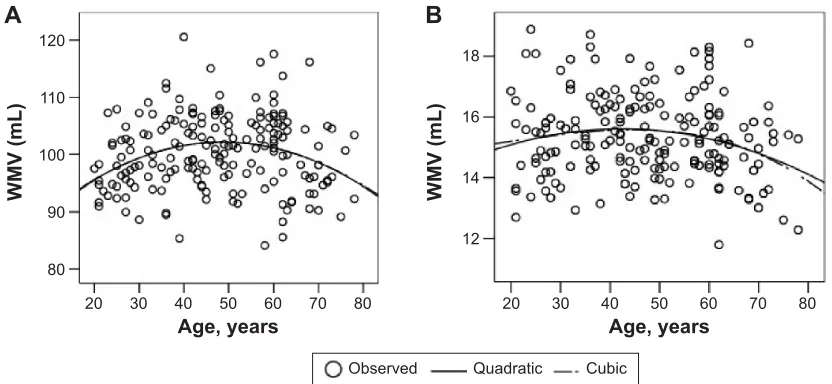
age (R2=0.124, P,0.001) (Figure 8). White matter volume gradually increased before 40 years of age, peaked around 50 years of age, and rapidly declined after 60 years of age. When age or age2 were used as an independent variable and the white matter volume of each ROI used as a dependent variable, logistic regression analysis showed a nonlinear squared correlation between the white matter volume of most ROIs and age, particularly the white matter volume of the frontal lobe (R2=0.13, P,0.001) (Table 8 and Figure 9). No significant correlation was observed between the white mat-ter volume of bilamat-teral cerebri, midbrain, pons, and medulla oblongata and age.
Neuropsychiatric Disease and Treatment downloaded from https://www.dovepress.com/ by 118.70.13.36 on 25-Aug-2020
Dovepress age- and sex-related changes in white matter volume
–56 –52 –48 –44 –40 –36
–32 –28 –24 –20 –16 –12
–8 –4 0 4 8 12
16 20 24 28 32 36
40 44 48 52 56 60
Figure 4 sex-related white matter volume changes between young adults and middle-aged adults.
Notes: This figure reflects the comparison between middle-aged adults and young adults. When multiple alignment is not performed, age is treated as a covariant, and by
comparing two groups (male group and female group), the results show the main effects of sex differences. colored voxels show that females have higher white matter volume. Data shown are before false-discovery rate correction.
Table 4 sex-related white matter changes between young and middle-aged adults by voxel-based morphometry
Brain region Coordinates (mm) P-value
(uncorrected)
Z F
x y z
left anterior lobe of cerebellum -11 -63 -33 0 5.63 36.95
left corona radiata -36 -12 15 0 5.15 30.64
Pons -9 -13 -21 0 5.15 30.56
left posterior lobe of cerebellum -29 -60 -53 0 4.03 18.63
right corona radiata 20 -12 20 0 3.93 17.71
left middle occipital gyrus -30 -75 6 0 3.87 17.24
genu of corpus callosum -5 29 -3 0 3.7 15.82
Discussion
Structural changes may occur in multiple regions of the aging brain, leading to decline in neurocognitive function, which is manifested as decline in memory and executive function. Imaging studies by MRI and other techniques show that
degenerative changes in the white matter are an important contributor to brain aging. It has been shown that compared to younger persons, elderly persons show apparent reduction in brain volume, with a 3% decrease in gray-matter volume and an 11% reduction in white matter volume, mainly in the
Neuropsychiatric Disease and Treatment downloaded from https://www.dovepress.com/ by 118.70.13.36 on 25-Aug-2020
Dovepress
liu et al
Figure 5 age-related white matter volume changes between middle-aged adults and old adults.
Notes: colored voxels show that middle-aged adults have higher white matter volume. Data shown are after false-discovery rate correction.
± ± ± ± ± ±
± ± ± ± ± ±
± ±
Table 5 age-related white matter changes between middle-aged and old persons by voxel-based morphometry
Brain region Coordinates (mm) P-value
(uncorrected)
Z F
x y z
Medial gyrus of left temporal lobe -24 -36 0 0 5.72 39.8
Medial gyrus of right temporal lobe 26 -34 1 0 5.61 38.16
left thalamus -20 -19 -2 0 5.21 32.54
left posterior lobe of cerebellum -32 -46 -48 0 5.09 30.86
left anterior cingulate gyrus -16 30 29 0 4.19 20.89
Medulla oblongata 5 -51 -63 0 3.99 18.68
right posterior cingulate gyrus 15 -58 26 0 3.04 11.09
right frontal lobe 29 -43 28 0.002 2.86 9.91
right inferior temporal gyrus 42 -60 -6 0.003 2.75 9.22
Neuropsychiatric Disease and Treatment downloaded from https://www.dovepress.com/ by 118.70.13.36 on 25-Aug-2020
Dovepress age- and sex-related changes in white matter volume
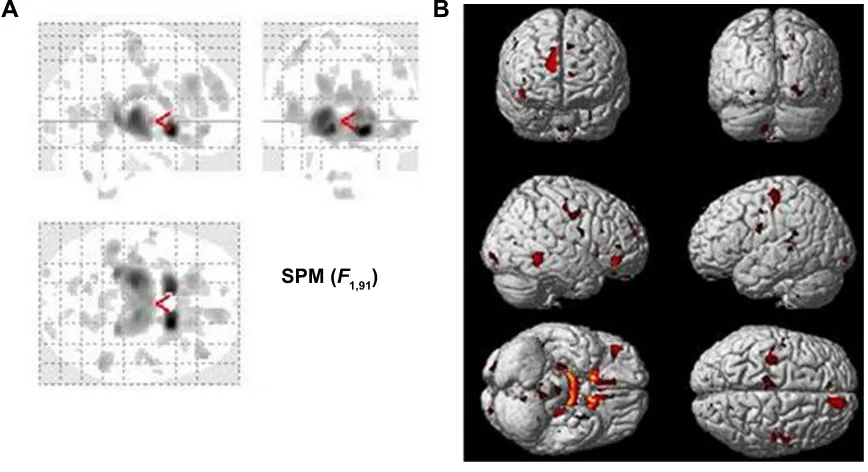
Figure 6 White matter volume changes between young adults and old adults.
Notes: (A) Different brain-area perspectives, statistical parametric mapping (sPM) results: height threshold F=8.949160 (P,0.05 [FDr]), extent threshold k=0 voxels; and (B) 3-D brain mapping show main effect of age on white matter volume changes. Data shown are after false-discovery rate (FDr) correction.
$
%
630)
Table 6 age-related white matter changes between young and old persons by voxel-based morphometry
Brain region Coordinates (mm) P-value
(uncorrected)
Z F
x y z
right frontal lobe 18 12 -11 0 6.54 57.21
left anterior limb of internal capsule -9 12 3 0 6.03 47.10
left middle frontal gyrus -5 24 -17 0 3.84 17.64
left posterior limb of internal capsule -17 -21 1 0 5.79 42.79
left temporal lobe -23 -36 0 0 5.2 33.57
right posterior limb of internal capsule 12 -18 3 0 5.05 31.47
splenium of corpus callosum 3 -21 18 0 4.26 21.85
anterior cingulate gyrus -17 30 28 0 4.21 21.27
right occipital lobe 54 -48 -6 0 4.17 20.86
left postcentral gyrus -33 -16 64 0 4.16 20.76
frontal lobe and corpus callosum.10 White matter volume increases before the age of 50 years, and significantly declines after the age of 60 years.11,12 Changes in white matter volume differ by brain regions during aging. Schmidt et al13 found that white matter changes occur prior to reduction in brain volume in cognitively normal elderly persons. The current study used the VBM approach to delineate age-related changes in white matter volume in cognitively normal adults, and demonstrates widespread age-related differences in multiple regions of the human brain. Compared to young subjects, old subjects had markedly lower white matter volumes in multiple ROIs of the brain, such as the frontal lobe, the internal capsule, the splenium of the corpus callosum, the occipital lobe, and the left temporal lobe. This is partially consistent with findings
by Giorgio et al,14 who demonstrated a linear negative association of white matter volume with advancing age in various brain regions like the internal capsule. We further demonstrated that changes in white matter volume occur early in the process, as middle-aged subjects showed significantly higher white matter volume than young subjects in multiple regions of the brain.
It remains inconclusive whether white matter volume cor-relates with age, though studies have demonstrated brain atro-phy in the aging brain.15,16 Our findings were that white matter volume of multiple ROIs of the brain changes with age and correlates with age, showing an inverse U-shaped curve. Our study reveals that white matter volume peaks around 50 years of age and starts a gradual decline thereafter. The reduction
Neuropsychiatric Disease and Treatment downloaded from https://www.dovepress.com/ by 118.70.13.36 on 25-Aug-2020
Dovepress
liu et al
Table 7 sex-related white matter changes between young and old persons by voxel-based morphometry
Brain region Coordinates (mm) P-value
(uncorrected)
Z F
x y z
left corona radiata -36 -12 15 0 4.37 22.98
right parahippocampal gyrus 20 -34 -3 0 3.73 16.64
left crus cerebri -21 -21 -8 0 3.33 13.33
right cingulate gyrus 18 -1 39 0 3.46 14.34
right corona radiata 21 -9 24 0.001 2.99 10.89
left middle frontal gyrus -36 44 -9 0.001 3.13 11.84
Figure 7 sex-related white matter volume changes between young adults and old adults.
Notes: When multiple alignment is not used and age is used as a covariant, results show in two groups (male group and female group) that red means female have bigger
white volume and blue means male have bigger white volume. colored voxels show that females have higher white matter volume. Data shown are before false-discovery rate correction.
± ± ± ± ±
± ± ± ± ±
Neuropsychiatric Disease and Treatment downloaded from https://www.dovepress.com/ by 118.70.13.36 on 25-Aug-2020
Dovepress age- and sex-related changes in white matter volume
Table 8 correlation of age and white matter volume by region of interest (rOi) and sex
ROI Parameter
R2 P-value Female
right Frontal lobe 0.100 0
Parietal lobe 0.064 0.043
Temporal lobe 0.086 0.016
Occipital lobe 0.096 0.010
left Frontal lobe 0.073 0.093
Parietal lobe 0.066 0.043
Temporal lobe 0.078 0.024
Occipital lobe 0.091 0
Male
right Frontal lobe 0.13 0.002
Parietal lobe 0.073 0.045
Temporal lobe 0.093 0.013
Occipital lobe 0.119 0.004
left Frontal lobe 0.107 0.007
Parietal lobe 0.084 0.020
Temporal lobe 0.097 0.011
Occipital lobe 0.095 0
corpus callosum 0.041 0.021
$JH\HDUV :09P/
2EVHUYHG 4XDGUDWLF &XELF
Figure 8 scatter plots and simple nonlinear regressions (quadratic, cubic) of white
matter volume (WMV) on age for the whole white matter.
in white matter volume is accelerated in a squared equation, which is consistent with findings by other investigators.15,17 Unlike the correlation of gray-matter volume and age, there have been controversies in reports on the correlation of white matter volume and age. One study indicated that white matter volume in persons 70 years of age was only reduced by approximately 6% compared to persons 30 years of age, but declined by as much as 25% in persons 80 years of age.18 Shankar19 found that white matter volume was on the rise before the age of 40 years and thereafter declined
at an annual rate of 0.5%, which was accelerated after 70 years of age. Another study showed a peak of white matter volume around the age of 40 years, which started to decline in a squared equation after 50 years of age.20 Some other stud-ies, however, found no apparent correlation between white matter volume and age,21 a negative correlation between white matter volume and age,22 or focal reduction of white matter volume with age.23
Our VBM revealed that the bilateral frontal lobe and bilat-eral temporal lobe were the earliest brain regions to manifest reduction in white matter volume, while the occipital lobe was the last brain region to show changes in white matter volume. This is consistent with the asynchrony of white matter development. The white matter in humans exhibits spatiotemporal heterogeneity in its development, and myeli-nation differs temporally across brain regions. Myelimyeli-nation occurs last in the frontal lobe, while it starts earlier in the occipital lobe. In the frontal lobe, the myelin sheath is thinner and the repair mechanism less efficient, and oligodendrocytes are prone to metabolic insults. Therefore, the bilateral frontal lobe is the most vulnerable region in the brain, while the occipital lobe shows slower decline in white matter volume. We also found that the white matter volume of the corpus callosum peaked at young age and remained stable until 70 years of age, when it started apparent decline. The splenium and genu of the corpus callosum showed noticeable reduc-tions in white matter volume in old persons. Our findings indicate that different brain regions show uneven changes in white matter volume. Future studies tracking white matter volume changes over time may be required to delineate the spatiotemporal pattern of white matter volume changes.
Sex-related white matter changes associated with aging remain ill defined. Several studies have shown that changes in white matter volume did not correlate with sex.24,25 Allen et al15 found that males showed greater correlation of total white matter volume with age than females. Another study revealed that females had apparently higher total white matter volume than males, while males had higher white matter volume in focal regions compared to females.21 The current study found that females showed markedly higher white matter volume in multiple brain regions, including the parietal lobe, bilateral medial temporal gyri, left occipital lobe, and bilateral anterior lobes of the cerebrum. Our findings are not consistent with Voineskos et al, who found that females had greater reduction in white matter volume of the parietal lobe.26 It was found that males had more marked atrophy of the temporal lobe than females during aging.27 Brain metabolism shows sex-related difference in certain brain regions, such as the temporal lobe,
Neuropsychiatric Disease and Treatment downloaded from https://www.dovepress.com/ by 118.70.13.36 on 25-Aug-2020
Dovepress
liu et al
the parietal lobe, and the cerebrum,28 but no study has been done to characterize sex-related differences in white matter volume during aging. It remains undefined if sex plays a role in white matter volume changes during aging.
Age-related white matter changes first occur in the frontal lobe and the precentral and postcentral sulci. These brain areas are associated with memory, cognition, and sensation. As one ages, the temporal lobe, especially the hippocampus, begins to show age-related changes, leading to impaired memory. Deeper brain structures like the brain stem that are related to basic life activities do not exhibit apparent age-related changes, or age-related changes develop much later in life. The relation between white matter changes and neuropsychiatric disorders has been pursued by investigators. For example, white matter changes have been documented during transition of the prodromal phase of schizophrenia.29 Wright et al inves-tigated 50 schizophrenia patients by diffusion tensor imaging, and observed a significant age-related decline in white matter blood perfusion.30 Reppermund studied 381 subjects aged between 72 and 92 years, and found that reduced white mat-ter integrity was associated with late-life depression.31 They showed that white matter changes in the superior frontal gyrus, posterior thalamic radiation, superior longitudinal fasciculus, and body of the corpus callosum predicted depression at follow-up. Our current study also demonstrated age-related changes in these brain regions. It is worthwhile to explore the relation between age-related white matter changes and the risk of neuropsychiatric disorders in future studies.
Studying changes in white matter volume that occur in the normal brain with aging is important for understanding the mechanisms leading to these changes, and for better
$JH\HDUV
:09P/
$
%
$JH\HDUV
:09P/
2EVHUYHG 4XDGUDWLF &XELF
Figure 9 Plots of white matter volume (WMV) versus age (including best-fit regression lines). Notes: (A) Frontal lobe; (B) occipital lobe.
characterization of neurodegenerative disorders whose risk increases with advancing age. However, there are apparent limitations for the use of VBM for studying white matter volume changes. The white matter lacks features to yield consistency in registration, and there is also a lack of uniform standards for measuring white matter volume, rendering comparison across studies difficult. The findings of the current study may also differ from those of earlier studies, because these studies may have used different methods, such as diffusion tensor imaging or (because of the differences in segmentation) smoothing and con-struction of models from smoothed images. Nevertheless, cerebral aging is a complex and heterogeneous process that is associated with a high degree of interindividual variability. Moreover, our population was highly selected, and may not represent the typical aging population, and the conclusions of the study should be interpreted with caution. Our study of a large cohort of cognitively normal subjects aged 20–78 years provided SPM of changes in white matter volume of ROIs of the brain and characterized the pattern of loss and preservation of brain regions during aging. We demonstrated significant age-related differences in changes in white matter volume across multiple brain regions during aging. These data suggest that the VBM approach may provide an emerging paradigm in the normal aging brain that may help in differentiating underlying nor-mal neurobiological aging changes of specific brain regions from neurodegenerative impairments.
Disclosure
The authors report no conflicts of interest in this work.
Neuropsychiatric Disease and Treatment downloaded from https://www.dovepress.com/ by 118.70.13.36 on 25-Aug-2020
Neuropsychiatric Disease and Treatment
Publish your work in this journal
Submit your manuscript here: http://www.dovepress.com/neuropsychiatric-disease-and-treatment-journal
Neuropsychiatric Disease and Treatment is an international, peer-reviewed journal of clinical therapeutics and pharmacology focusing on concise rapid reporting of clinical or pre-clinical studies on a range of neuropsychiatric and neurological disorders. This journal is indexed on PubMed Central, the ‘PsycINFO’ database and CAS,
and is the official journal of The International Neuropsychiatric Association (INA). The manuscript management system is completely online and includes a very quick and fair peer-review system, which is all easy to use. Visit http://www.dovepress.com/testimonials.php to read real quotes from published authors.
Dovepress
Dove
press
age- and sex-related changes in white matter volume
References
1. Wang N, Chen X, Geng D, Huang H, Zhou H. Ginkgo biloba leaf extract improves the cognitive abilities of rats with D-galactose induced dementia. J Biomed Res. 2013;27(1):29–36.
2. Greenwood PM. Functional plasticity in cognitive aging: review and hypothesis. Neuropsychology. 2007;21(6):657–673.
3. Jernigan TL, Archibald SL, Fennema-Notestine C, et al. Effects of age on tissues and regions of the cerebrum and cerebellum. Neurobiol
Aging. 2001;22(4):581–594.
4. Wahlund LO, Barkhof F, Fazekas F, et al. A new rating scale for age-related white matter changes applicable to MRI and CT. Stroke. 2001; 32(6):1318–1322.
5. Giorgio A, Watkins KE, Douaud G, et al. Changes in white matter microstructure during adolescence. Neuroimage. 2008;39(1):52–61. 6. McLaughlin NC, Paul RH, Grieve SM, et al. Diffusion tensor imaging
of the corpus callosum: a cross-sectional study across the lifespan.
Int J Dev Neurosci. 2007;25(4):215–221.
7. Pfefferbaum A, Adalsteinsson E, Sullivan EV. Frontal circuitry degrada-tion marks healthy adult aging: evidence from diffusion tensor imaging.
Neuroimage. 2005;26(3):891–899.
8. Maldjian JA, Laurienti PJ, Kraft RA, Burdette JH. An automated method for neuroanatomic and cytoarchitectonic atlas-based interrogation of fMRI data sets. Neuroimage. 2003;19(3):1233–1239.
9. Ashburner J, Friston KJ. Voxel-based morphometry – the methods.
Neuroimage. 2000;11(6 Pt 1):805–821.
10. Segura B, Jurado MA, Freixenet N, Bargalló N, Junqué C, Arboix A. White matter fractional anisotropy is related to processing speed in metabolic syndrome patients: a case-control study. BMC Neurol. 2010; 10:64.
11. Burzynska AZ, Preuschhof C, Bäckman L, et al. Age-related differences in white matter microstructure: region-specific patterns of diffusivity.
Neuroimage. 2010;49(3):2104–2112.
12. Hedman AM, van Haren NE, Schnack HG, Kahn RS, Hulshoff Pol HE. Human brain changes across the life span: a review of 56 longitudinal magnetic resonance imaging studies. Hum Brain Mapp. 2012;33(8): 1987–2002.
13. Schmidt R, Ropele S, Enzinger C, et al. White matter lesion progression, brain atrophy, and cognitive decline: the Austrian Stroke Prevention Study. Ann Neurol. 2005;58(4):610–616.
14. Giorgio A, Santelli L, Tomassini V, et al. Age-related changes in grey and white matter structure throughout adulthood. Neuroimage. 2010; 51(3):943–951.
15. Allen JS, Bruss J, Brown CK, Damasio H. Normal neuroanatomical variation due to age: the major lobes and a parcellation of the tem-poral region. Neurobiol Aging. 2005;26(9):1245–1260; discussion 1279–1282.
16. Meier-Ruge W, Ulrich J, Brühlmann M, Meier E. Age-related white matter atrophy in the human brain. Ann N Y Acad Sci. 1992;673: 260–269.
17. Matsuda H. Voxel-based morphometry of brain MRI in normal aging and Alzheimer’s disease. Aging Dis. 2013;4(1):29–37.
18. Pagani E, Agosta F, Rocca MA, Caputo D, Filippi M. Voxel-based analysis derived from fractional anisotropy images of white matter volume changes with aging. Neuroimage. 2008;41(3):657–667. 19. Shankar SK. Biology of aging brain. Indian J Pathol Microbiol. 2010;
53(4):595–604.
20. Kochunov P, Duff Davis M. Development of structural MR brain imag-ing protocols to study genetics and maturation. Methods. 2010;50(3): 136–146.
21. Sala S, Agosta F, Pagani E, Copetti M, Comi G, Filippi M. Micro-structural changes and atrophy in brain white matter tracts with aging.
Neurobiol Aging. 2012;33(3):488–498.e2.
22. Erickson KI, Colcombe SJ, Raz N, et al. Selective sparing of brain tis-sue in postmenopausal women receiving hormone replacement therapy.
Neurobiol Aging. 2005;26(8):1205–1213.
23. Sullivan EV, Deshmukh A, Desmond JE, Lim KO, Pfefferbaum A. Cerebellar volume decline in normal aging, alcoholism, and Korsakoff’s syndrome: relation to ataxia. Neuropsychology. 2000;14(3):341–352. 24. Ziegler DA, Piguet O, Salat DH, Prince K, Connally E, Corkin S.
Cognition in healthy aging is related to regional white matter integrity, but not cortical thickness. Neurobiol Aging. 2010;31(11):1912–1926. 25. Madden DJ, Bennett IJ, Burzynska A, Potter GG, Chen NK, Song AW.
Diffusion tensor imaging of cerebral white matter integrity in cognitive aging. Biochim Biophys Acta. 2012;1822(3):386–400.
26. Voineskos AN, Rajji TK, Lobaugh NJ, et al. Age-related decline in white matter tract integrity and cognitive performance: a DTI tractography and structural equation modeling study. Neurobiol Aging. 2012;33(1): 21–34.
27. Michielse S, Coupland N, Camicioli R, et al. Selective effects of aging on brain white matter microstructure: a diffusion tensor imaging trac-tography study. Neuroimage. 2010;52(4):1190–1201.
28. Wang Y, Adamson C, Yuan W, et al. Sex differences in white matter development during adolescence: a DTI study. Brain Res. 2012;1478: 1–15.
29. Chung Y, Cannon TD. Brain imaging during the transition from psychosis prodrome to schizophrenia. J Nerv Ment Dis. 2015;203(5):336–341. 30. Wright SN, Kochunov P, Chiappelli J, et al. Accelerated white matter
aging in schizophrenia: role of white matter blood perfusion. Neurobiol
Aging. 2014;35(10):2411–2418.
31. Reppermund S, Zhuang L, Wen W, et al. White matter integrity and late-life depression in community-dwelling individuals: diffusion ten-sor imaging study using tract-based spatial statistics. Br J Psychiatry. 2014;205(4):315–320.
Neuropsychiatric Disease and Treatment downloaded from https://www.dovepress.com/ by 118.70.13.36 on 25-Aug-2020


![Figure 3 White matter volume changes between middle-aged adults and young adults.Notes: (A) Different brain-area perspectives, statistical parametric mapping (sPM) results: height threshold F=7.499704 (P,0.05 [FDr]), extent threshold k=20 voxels; and B) 3D](https://thumb-us.123doks.com/thumbv2/123dok_us/8612751.1402459/6.612.95.500.51.501/different-perspectives-statistical-parametric-mapping-results-threshold-threshold.webp)