Integrated Product Design using Quality
Function Deployment & TOPSIS
JagannathAhirwar1, Payal Bhargava2
1
Research Scholar, 2Assistant Professor
Industrial Engineering and Management,ShriAurbindo Institute of Technology, Indore (M.P), India
Abstract
QFD is a methodology, which establishes a relationship between product and customer, determines product’s sales ability and carry out it to a high level during the process. In this study, QFD methodology, which is used in several industries, was implemented in the production industry. In the first step, which is developed by the customer’s voice, Multi Criteria Decision Making was used. The relationship, which is between product and customer’s requirements, is determined by Technique for Order Preference by Similarity to Ideal Solution (TOPSIS). After this step, with customer requirements and technical details, which is matched with, are put in the house of quality (HoQ). Fallowing these steps, improvement ratio and green parameters are taken place in the house. Finally calculate all items and evaluated.
Keywords - Quality Function Deployment, MCDM, TOPSIS
I. INTRODUCTION
Achieving end-user satisfaction and optimizing the product design cost is a major goal of facility owners and developers. After identifying design objectives, a multitude of product with varying cost can be used to create alternatives that meet the design objectives. Owners have to carefully select the most optimum design alternative that combines the most valuable option and realize the design objectives within the project budget.
The majority of the product costs are spent during the manufacturing phase, however most of these costs are mainly determined in the design phase. More specifically, during the early phases of the product development only 10 to 15% of the product has been developed, but 80% of the costs have been committed. The possibility to influence cost during the design phase is much higher than the other phases, while at the same time the modification cost is substantially smaller compared with other stages of the life cycle. Thus, good cost estimation as early as possible assists controlling the parameters of cost, which subsequently implies that the performance and effectiveness of an enterprise is significantly influenced possibly.
Customers employ a variety of heuristics when evaluating product alternatives in the marketplace. Many products are made up of different features and are mainly differentiated by brands, packaging and price. Different customer may have different choices for the particular product out of set of multi attribute alternatives of different brands or within the same brands also. Depending on the nature of the demand, it is necessary to make product differentiation based on multi attribute.
To compete in the market place, manufacturers have to expand their product lines and differentiation of their product offering with the belief that large product variety may stimulate sales and generate more revenue. The final decision to select a particular design for a given product is perhaps the most critical stage in the product design development. Such decision is influenced by many factors, the specifics of which are not known priori during the design stage. As such, a quantitative basis for comparison and selection of the best design solution among a variety of alternatives could greatly impact on the eventual success or failure of a product in the market.
II. LITERATURE REVIEW
To develop a successful product in today’s competitive and globalize environment, customer requirements need to be carefully considered during product conceptualization. For this purpose, Quality Function Deployment (QFD) has been widely studied and applied to better understand and utilize customer needs in new product development. Quality Function Deployment (QFD) is “an overall concept that provides a means of translating customer requirements into the appropriate technical requirements for each stage of the product development and production”.
The concept of QFD refers to a comprehensive approach to quality including “quality deployment” and what the Japanese call “deployment of the quality function”. Dr. YojiAkao of Tamagawa University provides a definition of QFD in his work with Robert King of GOAL/QPC.
identify and resolve issues involved in providing products, processes, services and strategies which will more than satisfy their customers. A prerequisite to QFD is Market Research. This is the process of understanding what the customer wants, how important these benefits are, and how well different providers of products that address these benefits are perceived to perform. This is a prerequisite to QFD because it is impossible to consistently provide products which will attract customers unless we have a very good understanding of what they want. When completed it resembles a house structure and is often referred to as House of Quality (HOQ). [4]
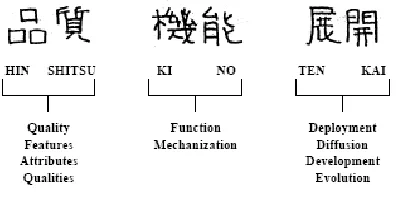
Figure 2.1 Translations Of Six Chinese Characters For Qfd
Quality Function Deployment is derived from six Chinese characters with Japanese Kanji pronunciation (Figure 2.1): HinShitsu (Quality), Ki Nou (Function), Ten Kai (Deployment).
The Japanese characters for HinShitsu represents quality, features or attribute, Ki and Nou represents function or mechanization and Ten and Kai represents deployment, diffusion, development or evolution. Taken together, the Japanese characters mean “how do we understand the quality that our customer expect and make it happen in a dynamic way” [2] functional fields, applied industries and methodological development.
Quality Deployment is a matter of converting customer quality requirements into counterpart characteristics, determining design quality levels for the finished product and then systematically relating these to the quality of subsystems, assemblies and parts. Deployment of the quality function consists of detailed, stepwise deployment of the means and objectives of all manufacturing functions and work having a bearing on product quality.
Multi Criteria Decision Making (MCDM) Method
Multiple–criteria decision making method (MCDM) is a decision making analysis method which has been developed since 1970s. A decision-making problem is the process of finding the best option from all of the feasible alternatives. For many problems, the decision maker wants to solve a multiple criteria decision
making (MCDM) problem. A MCDM problem can be concisely expressed in matrix format as:
∗ 𝐴1 𝐴2 𝐷 = 𝐴3 ⋮ 𝐴𝑚
𝐶1 𝐶2 𝑥11 𝑥12 𝑥21 𝑥22
𝐶3 ⋯ 𝐶𝑛 𝑥13 ⋯ 𝑥1𝑛 𝑥23 ⋯ 𝑥2𝑛 𝑥31 𝑥32
⋮ ⋮ 𝑥𝑚1 𝑥𝑚2
𝑥33 ⋯ 𝑥3𝑛 ⋮ ⋮ ⋮ 𝑥𝑚3 ⋯ 𝑥𝑚𝑛
W = [w1 w2 w3 … wn]
Where A1, A2, A3 ..., Am are possible alternatives among which decision makers have to choose, C1, C2, C3, ..., Cn are criteria with which alternatives performance are measured, xijis the performance value of alternatives Ai with respect to criterion Cj, wjis the weight of criterion Cj.
TOPSIS (Technique for Order Preference by Similarity to Ideal Solution)
Technique for order preference by similarity to ideal solution TOPSIS was initially developed by Hwang and Yoon (1981), subsequently discussed by many (Chu, 2004; Peng, 2000).
TOPSIS finds the best alternatives by minimizing the distance to the ideal solution and maximizing the distance to the nadir or negative-ideal solution (Jahanshahloo et al., 2006).
In this group the preferred option will be the closest option to the ideal solution. The following groups also compromise its subtypes compensating model. Compensatory model exchanges between indices are considered. That may be an indicator of weakness by the other index points is compensated (Chen et al., 2006).
All alternative solutions can be ranked according to their closeness to the ideal solution. Because its first introduction, a number of extensions and variations of TOPSIS have been developed over the years. General TOPSIS process with six steps is listed below:
Step 1: Calculate the normalized decision matrix A. The normalized value (aij)is calculated as:
𝑎𝑖𝑗 = 𝑥𝑖𝑗 𝑥𝑖𝑗 2
𝑚 𝑖=1
, 1 ≤ 𝑖 ≤ 𝑚, 1 ≤ 𝑗 ≤ 𝑛
Step 2: Calculate the weighted normalized decision matrix:
𝑉 = ( 𝑎𝑖𝑗 𝑋 𝑤𝑗)
Where wjis the weight of the ith criterion and , 𝑤 =𝑛𝑖=1
1.
Step 3: Calculate the ideal solution V+ and the negative ideal solution V
V+ = {v1+, v2+,..vn+} = { Maxvij | j∈J),
(Min vij|j∈ J)}
V- = {v1-, v2-,..vn-} = { Minvij | j∈ J),
Step 4: Calculate the separation measures, using the m-dimensional Euclidean distance.
𝑆+ = 𝑛𝑗 =1(𝑉𝑖𝑗 − 𝑉+)2,
where 1 ≤ 𝑖 ≤ 𝑚, 1 ≤ 𝑗 ≤ 𝑛
𝑆− = 𝑛𝑗 =1(𝑉𝑖𝑗 − 𝑉−)2, where 1 ≤
𝑖≤𝑚, 1≤𝑗≤𝑛
Step 5: Calculate the relative closeness to the ideal solution
𝑃𝑖 = 𝑆𝑖−
𝑆𝑖+ + 𝑆𝑖− , where 1 ≤ 𝑖 ≤ 𝑚, 1 ≤ 𝑗 ≤ 𝑛
Where the larger is, Pi the closer the alternative is to the
ideal solution.
Step 6: The larger TOPSIS value, the better the alternative.
Application
In this project, mobile phone is considered as an application part. Four different brands of mobile phone are taken under the range of Indian National Rupees 15,000/-. Some of the criteria are considered randomly
like dimension, weight, internal memory, front camera and cost of the mobile phone. Our aim is to design a new product which should include all these features. Initially the weight of the product is calculated by applying Analytical Hierarchy Process (AHP).
After AHP, the procedure of TOPSIS is applied. Wherein the first step all the criteria are converted into normalization. Then after, the calculated weight is mixed with the normalized values of the criteria which gives the weighted normalization matrix.
From the weighted normalization matrix, we select the upper most and lower most values of each criteria. Accordingly, we calculate the similarity to ideal solution i.e. the deviation from the ideal solution in both positive and negative ways. At last, we calculate the performance index of the product using the deviations.
Let us take the four different brands of mobile phone with few specific features (criteria) under a particular range.
Dimension(lxbxh) Weight (gm) Front Camera (MP) Internal Memory (GB) Price (INR)
Product 1 95836 175 20 64 14999
Product 2 101332 175 12 32 12999
Product 3 105518 205 16 64 14999
Product 4 87352 168 12 64 13990
Now, the Analytical Hierarchy Process (AHP) will be applied to calculate the individual weight of these criteria.
General TOPSIS process with six steps is listed below:
Step 1: Calculate the normalized decision matrix A. The normalized value (aij)is calculated as:
𝑎𝑖𝑗 = 𝑥𝑖𝑗 2𝑚𝑥𝑖𝑗 𝑖=1 ,
1 ≤ 𝑖 ≤ 𝑚, 1 ≤ 𝑗 ≤ 𝑛
Table: Normalization Matrix
Dimension(l x b x h) Weight (gm) Front Camera (MP) Internal Memory (GB) Price (INR)
Product 1 0.4902 0.4826 0.6510 0.5547 0.5255
Product 2 0.5183 0.4826 0.3906 0.2773 0.4554
Product 3 0.5398 0.5653 0.5208 0.5547 0.5255
Step 2: Calculate the weighted normalized decision matrix:
𝑉 = ( 𝑎𝑖𝑗 𝑋 𝑤𝑗)
Table: Weighted Normalization Matrix
Dimension(l x b x h) Weight (gm) Front Camera (MP) Internal Memory (GB) Price (INR)
Product 1 0.2719 0.1301 0.0608 0.0301 0.0146
Product 2 0.2875 0.1301 0.0365 0.0151 0.0126
Product 3 0.2994 0.1524 0.0486 0.0301 0.0146
Product 4 0.2479 0.1249 0.0365 0.0301 0.0136
Step 3: Calculate the ideal solution V+ and the negative ideal solution V V+ = {v1+, v2+,..vn+} = { Maxvij | j∈J), (Min vij|j∈ J)}
V- = {v1-, v2-,..vn-} = { Minvij | j∈ J), (Max vij|j∈J)}
Table: The upper most & lower most values
Dimension Weight Front Camera Internal Memory Price
Most +Ve Value 0.2994 0.1524 0.0486 0.0151 0.0146
Most -Ve Value 0.2479 0.1249 0.0365 0.0301 0.0126
Step 4: Calculate the separation measures, using the m-dimensional Euclidean distance.
𝑆+ = 𝑛𝑗 =1(𝑉𝑖𝑗 − 𝑉+)2, where 1 ≤ 𝑖 ≤ 𝑚, 1 ≤ 𝑗 ≤ 𝑛
𝑆− = 𝑛𝑗 =1(𝑉𝑖𝑗 − 𝑉−)2, where 1 ≤ 𝑖 ≤ 𝑚, 1 ≤ 𝑗 ≤ 𝑛 Table: The Separation Measures
Step 5: Calculate the relative closeness to the ideal solution
𝑃𝑖 = 𝑆𝑖−
𝑆𝑖+ + 𝑆𝑖− , where 1 ≤ 𝑖 ≤ 𝑚, 1 ≤ 𝑗 ≤ 𝑛
Where the larger is, Pi the closer the alternative is to the ideal solution.
Table: Relative Closeness from Ideal Solution
P1 0.4364
P2 0.6025
P3 0.7979
P4 0.0160
The result obtained from table clearly indicates that product3 has maximum relative closeness from the ideal solution and hence product3 is to be selected.
S1 + 0.0403
S2 + 0.0281
S3 + 0.0151
S4 + 0.0615
S1 - 0.0312
S2 - 0.0426
S3 - 0.0596
Figure: House of Quality CUSTOMER DEMAND F U N C TI O N A L C H A R A C TER IS TI C S E a sy D im e ns ioni n g M a te ri al U se d M e ga P ix e l Int e rna l M e m or y Cos t of D e si gni ng
Size Specification 5 ® ∆ 50
Weight Specification 3 ® ∆ 30
Quality Picture 1 ® 09
Operating Complexity 2 ® 18
Competitive Price 5 ∆ ο ο ο ® 110
ORGANIZATIONAL DIFFICULTY
3 1 4 2 2 Q.I.=217
F U N C TI O N A L S P EC IF IC A TI O N M e di u m S iz e P re fe rre d L igh t in w e ight & E c o fri e nd ly 14 t o 16 M e ga P ix e l 32 to 64 G B i n te rna l M e m or y Ba se d on t h e no. of fe a ture s
ABSOLUTE IMPORTANCE 50 47 29 38 53
RELATIVE IMPORTANCE (%)
RESULT & DISCUSSION
The result obtained from two different models are as follows:
1. Evaluation of New Product Design Alternative
Table: Relative Closeness from Ideal Solution
Product 1 P1 0.4364
Product 2 P2 0.6025
Product 3 P3 0.7979
Product 4 P4 0.0160
The result obtained from table clearly indicates that product 3 has maximum relative closeness from the ideal solution and hence product 3 is to be selected.
2. The House of Quality
The quality index obtained based on the AHP and TOPSIS is 217. Which signifies the upper most deviation from the ideal product design. Higher the value of Quality index, higher will be the quality achieved for product design.
REFERENCES
[1] Akao, Y., 1972. New Product Development and Quality Assurance Deployment System (in Japanese). Standardization and Quality Control 25 (4), 243–246. [2] Akao, Y. (Ed.), 1990. Quality Function Deployment:
Integrating Customer Requirements into Product Design. Productivity Press, Cambridge, MA.
[3] Anne Cleven, Philipp Gubler and Kai M. Hunter, 2009. “Design Alternatives for Evaluations of Design Science Research Aircrafts”, DESRIST’09, May 7-8, 2009, Malvern, PA, USA.
[4] Babak Haji Karimi and Mohamad Mehdi, 2012. “Applying a Hybrid QFD-TOPSIS Method to Design Product in the Industry”, “Research Journal of Applied Sciences, Engineering and Technology”, 4(18): 3283-3288, 2012.
[5] Brugha C. (1998), “structuring and Weighting Criteria in Multi Criteria Decision Making”, 13th International
Conference on Multiple Criteria Decision Making, p. 229-242.
[6] Caroline Maria de Miranda Mota, 2008, “A Multi criteria decision model for assigning priorities to activities in project management”, International Journal of Project Management.
[7] Chensong and Chuck Zhang, 2003, “Integration of GQFD and Fuzzy Multi Attribute Utility Theory- Based cost Estimation for Environmentally Conscious Product Development”, International Journal of
Environmentally Conscious Design & Mfg. Vol. 11, 2003.
[8] Chih-Hung hsu, An-Yuan Chang and Hui-Ming Kuo, 2012, “Data mining QFD for the Dynamic Forecasting of Life Cycle under Green Supply Chain”, WSEAS Transactions of Computers, Issue 1, Volume 11, January 2012.
[9] C.P.M. Grovers, “What and How about Quality Function Deployment”, International Journal of Production Economics 46-47 (1996) 572-585. [10] D.J. Blackwood, S. Sarkar and A.D.F. Price, 1998.
“Modelling Levels of Accuracy in Design Cost Estimation”, “14th Annual ARCOM Conference, 9-11
September 1998, Volume 1, 330-9.
[11] F. HosseinzadehLotfi, 2011. “Ranking Efficient Units in DEA by Using TOPSIS Method”, “Applied Mathematics Science”, Vol. 5, 2011, no. 17, 805-815. [12] F. De Felice, 2010”, “A multiple Choice Decision
Analysis: An Integrated QFD-AHP Model for the Assessment of Customer Needs”,“International Journal of Engineering, Science and Technology”, Vol. 2, No.9, 2012, pp. 25-38.
[13] Gregory A. Keoleian, 1993. “The Application of Life Cycle assessment to Design”, “J. Cleaner Production 1993, Volume 1, Number 3-4.
[14] Ignacio Cariaga and Hesham Osman, 2007. “Integrating Value Analysis and Quality Function Deployment for Evaluating Design Alternatives”, “Journal of Construction Engineering and management”, Vol. 133, No. 10, 2007.
[15] James S. Dyer, and Peter C., 1992. “Multi Criteria Decision Making, Multi attribute Utility Theory”, “Management Science”, Vol. 38, No. 5, 1992. [16] Ji-Hyung Park and Kwang-KyuSeo, 2005. “A
knowledge-based Approximate Life Cycle Assessment system for Evaluating EnvironmentallImpacts of Product Design Alternatives in a Collaborative Design Environment,” “Science Direct, Advance Engineering Informatics 20 (2006) 147-154.
www.elsevier.com/locate/aei
[17] Margoluis R., Stem C., Salafsky N. and Brown M. 2009. “Design Alternatives for evaluating the impact of conservation project, “Environmental program and Policy Evaluation: Addressing Methodological Challenges, New Directions for Evaluation, 122, 85-96. [18] M.D. Bovea and B. Wang. Integration of Customer,
Cost and Environmental Requirements in Product Design: An Application of GQFD.
[19] Nai-Jen Chang and Cher-Min Fong, 2010. “ Green Product Quality, Green Corporate Image, Green Customer Satisfaction, and Green Customer Loyalty”, “ African Journal of Business Management”, Vol. 4(13), pp. 2836-2844, 2010.
[20] Ola Isaksson, Sven Keski-Seppala and Steven D. Eppinger, 2000. “Evaluation of Design Process Alternatives using Single Flow Graphs”, “Journal of Engineering Design”, ISSN 1466-1387 online 2000, Taylor & Francis Ltd.
[21] Pramen P. Shrestha and Niranjan Mani, 2012. “Impact of Design Cost on Design Bid Build Project
Performance”, “Construction Research Congress”, 2012.