http://www.sciencepublishinggroup.com/j/ajac doi: 10.11648/j.ajac.20170506.14
ISSN: 2330-8753 (Print); ISSN: 2330-8745 (Online)
Effect of Seasonal Variation in the Composition of Major
and Trace Elements of Lake Chamo, Ethiopia
Adane Gebresilassie Hailemariam
1, Belete Yilma Hirpaye
2 1Chemistry Department, Dire Dawa University, Dire Dawa, Ethiopian2
Chemistry Department, Arbaminch University, Arba Minch, Ethiopian
Email address:
adanegebre19@yahoo.com (A. G. Hailemariam), y.belete2@gmail.com (B. Y. Hirpaye)
To cite this article:
Adane Gebresilassie Hailemariam, Belete Yilma Hirpaye. Effect of Seasonal Variation in the Composition of Major and Trace Elements of Lake Chamo, Ethiopia. American Journal of Applied Chemistry. Vol. 5, No. 6, 2017, pp. 110-120. doi: 10.11648/j.ajac.20170506.14
Received: September 29, 2017; Accepted: October 10, 2017; Published: December 11, 2017
Abstract:
Water samples was collected from five sampling sites namely; inlet-1, inlet-2, center, outlet-1 and outlet-2 of Lake Chamo. The concentration of certain major and trace metals Na, K, Mg, Ca, Cr, Co, Ni, Mn and Cu were determined in the water within the two consecutive season winter (dry) and spring (wet) season using atomic absorption spectrometer (AAS) and flame photometer (FP). The results revealed that the dissolved metal concentration in water were, Na ranged from 18 - 22, Mg 0.34-0.97, K 10-19, Ca 1.6 -5.5, Cr 0.61- 4.0, Co 1.50-3.8, Ni 0.78-1.10, Mn 1.01– 1.98 and Cu 0.53 -1.20 mg/L in the winter season and in the spring season Na ranged from 12- 17.5, Mg 0.51- 0.62, K 10- 13, Ca 1.5- 3.9, Cr 0.60- 1.20, Co 1.50- 3.80, Ni 0.78-1.10, Mn 1.01–1.9 and Cu 0.50- 0.78 mg/L. the physicochemical values in the winter season were, PH ranged from 9.39 - 9.45, TDS 815 - 910 mg/L, conductivity 1746 -1965 µS/cm, temperature 25.5 – 27.6°C, salinity 0.87 - 0.93ppt, turbidity 21.59 - 28.21 NTU and DO 6.37 mg/L - 8.24 mg/L and in the next season (spring), PH ranged from 9.30 - 9.40, TDS 865 – 920mg/L, conductivity 1739 - 1960µS/cm, temperature 25.8 – 29°C, salinity 0.81- 0.87ppt, turbidity 22.59 - 37.21 NTU and DO 6.27 mg/L - 8.24 mg/L.Keywords:
Lake Chamo, Water, Physicochemical1. Introduction
1.1. Background
Water is one of the most essential substances needed to sustain human life, animals, plants and other living things. Without water no life is possible on earth. Different types of water bodies differ on their depth, size and level of water it holds. Among the different water bodies, lakes are a large body of water surrounded by land, inhabited by various aquatic life forms. Many researchers up on their studies on the level of trace elements in organisms inhabiting in lakes and other water bodies provide information on the status of the aquatic environment and the biota residing in them. [1]
As rivers drain in to lake, monitoring of the quality of river’s water play a great role in water resource and ecological management. The Abaya-Chamo drainage basin as a sub basin of Great Rift Valley Lakes system has been an area of rapid population growth and settlement. The water quality of Lake Chamo has been affected in the past decade
resulting in the death of aquatic habitats and wild life like zebra due to toxic cyano-bacterial bloom and other toxic noxious gases caused by increased hypo-limnetic activity in the lake. [2]
Water has unique chemical and physical properties due to its polarity and hydrogen bonds which makes it is able to dissolve, absorb, adsorb or suspend many different compounds. In nature, water acquires metals from its surrounding and those arising from humans and animals as well as other biological activities. The occurrences of enhanced concentrations of heavy metals especially in sediments may be an indication of human induced perturbations rather than natural enrichment through geological weathering. Heavy metals are non-biodegradable and they persist in the environment and may become concentrated up to the food chain, leading to enhanced levels in liver and muscle tissues of fishes, aquatic bryophytes and aquatic biota [3-5].
The formation of ion-pairs or ion-complexes in natural waters can have a major effect on the rates of redox processes, mineral solubility and biochemical availability [6]. Metals concentrations in aquatic ecosystems are usually monitored by measuring their concentrations in water, sediments and biota, which generally exist in low levels in water and attain considerable concentration in sediments and biota [7].
Most frequently metals are transported from land surface to water bodies. The consequence of metals disposed to the water can lead hazardous to man through his food. Dissolved constituents of water bodies are often determined as a major component for baseline limnological studies. The major ions Ca2+, Mg2+, Na+, K+, Cl-, SO42-, HCO3-, and CO32- are
essential constitute of water and responsible for ionic salinity as compared with other ions. The use of water in agriculture is growing, population growth and urbanization which all lead to the generation of more waste water in urban areas. The massive disposal of quantities of metal waste at landfills can lead to metal pollution of ground and surface water [8].
Due to the natural factors such as soil erosion, sediment loading, solution of minerals and increasing anthropogenic activities, the nature of the aquatic environment will change. This change in the aquatic environment will affect fish’s habitat in the lake Chamo. Even though Lake Chamo attract attention of many researchers due to its historical and scientific importance currently, there was no document appeared regarding the accumulation or concentration of these essential and trace elements as well as the effect of seasonal variation on the lake water.
This study is designed to determine the current level of the concentrations of metals such as sodium (Na), magnesium (Mg), potassium (K), calcium (Ca), chromium (Cr), cobalt (Co), nickel (Ni), manganese (Mn) and copper (Cu) in water. The status of the water parameters like temperature, dissolved oxygen, pH, turbidity, conductivity, salinity and total dissolved solid of the lake water were also investigated
in this study.
1.2. Objectives of the Study
1.2.1. General Objective
To evaluate seasonal variation in the composition of major and trace elements in the water.
1.2.2. Specific Objectives
1. To study the physicochemical parameters of the water. 2. To compare and contrast seasonal variation in the
composition of major and trace elements in the water. 3. To correlate the water metal content with its
physicochemical parameters.
2. Materials and Methods
2.1. Study Area
Lake Chamo is located in the Southern Nations Nationalities and Peoples Region (SNNPR) of southern Ethiopia. It is located in the Great Rift Valley at an elevation of 1,235 meters to the south of Lake Abaya and city of Arbaminch and east of the Guge Mountains. The lake’s northern end lies in the Nechisar National Park. Earlier studies (Amha Belay and Wood, 1982) stated that Lake Chamo has a surface area of 551 km2 and a maximum depth of 16m. However, according to Seleshi Bekele (2006), the surface area of the lake declined to about 335 km2. Elizabeth Kebede (1996) reported a maximum depth of 13m. The lake is fringed with beds of typha as well as wetlands. The rivers draining in to Lake Chamo are listed as: Sile, Argoba, Wezeka, Sego, as well as overflow from Lake Abaya brought to it by the Kulfo River. Oscar Neumann explored the area in 1901 and found that a dry channel connecting Lake Chamo to the Sagan River which led him to conclude the lake contributes to the Sagan in years of heavy rainfall. [10].
2.2. Experimental Procedures
2.2.1. Sample Collection
Water sampling
The Water samples were collected seasonally (winter 2012/13 – spring 2013). One liter polyethylene bottles were used for collecting water samples. The bottles were cleaned with detergents and rinsed with deionized water. During the sampling period the bottles were rinsed with the lake water two times and then used for collecting the water samples. Water samples were collected from five sites which ranges from the entry of kulfo river to the out flow through Sagan and the GPS reading for each sites were, inlet-1(N5º 55.174’, E37º33.541’), inlet-2(N5º 54.979’, E37º33.762), center (N5º52.801, E37º36.401), outlet-1(N5º51.360, E3737.949) and outlet-2(N5º51.393, E3737.903) as shown on figure 1. The collected samples were placed in icebox and brought to laboratory for farther analysis. While collecting the water samples, the physicochemical characteristics of the water like dissolved oxygen (DO), total dissolved solids (TDS), conductivity, pH, salinity, temperature and turbidity also have been checked in situ along with GPS measurement.
2.2.2. Sample Preparation
Preparation of water sample
As the water which was collected from the lake contains many different suspended and dissolved materials that may affect the instrument’s sample inlet line (AAS and Flame photometers) while measurements are taken, for this purpose the sample was treated taking it to Arbaminch University Chemistry Laboratory, the water sample was centrifuged for 15 min and about 500 mL of water was filtered through what-man filter paper. The filtrate was acidified with 1.00
mL conc. HNO3 and kept in the refrigerator at 4°C until
analysis.
2.2.3. Sample Analysis
Determination of major and trace metals
A series of working standard solutions of metals were prepared by appropriate dilution of the metal stock solutions with distilled, deionized water. After getting of the absorbance (from AAS and flame photometer) of each prepared sample, the calibration graph was constructed as absorbance versus concentration with the help of Origin lab 8.1 software, for each element using the prepared standard solutions. The metals Mg, Ca, Cr, Mn, Fe, Co, Ni, Cu and Zn in the prepared samples of water were determined with the Buck Scientific 210VGP atomic absorption spectrophotometer while Na and K concentrations were determined by flame photometer (Model PFP7).
Determination of physicochemical parameters of the water The physicochemical parameters of the water like dissolved oxygen (DO) was checked by (model 970) DO2
meter; conductivity, TDS, Turbidity and salinity were checked by using Conductivity meter-4200 and high quality 40 digital multi-meter (HQ40d) and PH of the water by PH -Meter. All those parameters were measured in situ.
2.4. Data Analysis
The correlation of physicochemical parameters and the levels of metals in lake water were assessed using SPSS v16.0. Software like Origin lab. 8.1 and Microsoft office excel 2007 were used for graphs and figures presentation.
3. Results
Table 1. Physicochemical parameter measurements taken in both winter and spring season from Lake Chamo.
Water sample taken in winter Water sample taken in spring
Parameters units Inlet-1 Inlet-2 Center Outlet-1 Outlet-2 Inlet-1 Inlet-2 Center Outlet-1 Outlet-2
PH - 9.45 9.45 9.39 9.43 9.44 9.30 9.33 9.38 9.33 9.40
TDS mg/L 815 905 910 895 908 865 910 920 905 919
Conductivity µs/cm 1746 1838 1893 1965 1926 1739 1835 1892 1960 1925
temperature °C 25.5 25.9 24.5 27 27.6 25.8 26.9 24.6 29 27
salinity ppt 0.87 0.92 0.82 0.93 0.92 0.87 0.82 0.81 0.84 0.82
turbidity NTU 28.02 26.20 21.59 23.54 22.78 36.02 37.21 22.59 26.54 23.78
DO mg/L 7.10 6.37 8.24 7.5 8.0 6.80 6.27 8.24 6.50 7.90
*** Water’s physicochemical Parameters measured in five sampling sites on Lake Chamo
Table 2. Metals concentration in water samples taken in both winter and spring season from Lake Chamo.
Water sample-1 water sample-2
Metals Inlet-1 Inlet-2 Center Outlet-1 Outlet-2 Inlet-1 Inlet-2 Center Outlet-1 Outlet-2
Na 18 15.5 12.8 22 18.9 15.6 14.7 12 17.5 16
Mg 0.97 0.84 0.34 0.86 0.79 0.51 0.62 0.33 0.47 0.38
K 16 13 10 19 17 13 12 10 12 11
Ca 3.9 2.5 1.6 5.5 3.0 3.0 3.9 1.5 2.5 1.5
Cr 3.5 0.65 0.61 4.0 3.5 1.20 0.65 0.60 1.20 0.65
Co 3.63 1.90 1.50 3.8 3.0 1.86 1.64 1.50 3.80 3.63
Mn 1.51 1.10 1,01 1.26 1.98 1.09 1.03 1.01 1.2 1.9
Ni 1.10 0.94 0.78 1.13 0.90 0.89 1.10 0.78 0.94 0.86
Cu 0.82 0.66 0.53 1.20 0.71 0.78 0.68 0.50 0.71 0.66
Table 3. The mean values of metals concentration and physicochemical parameter of the water taken in winter season.
Metals Mean of metals Concentration
Physicochemical parameters
Mean of
Physicochemical values
Na 17.44 pH 9.43
Mg 0.76 TDS 886.6
K 15 Conductivity 1874
Ca 3.3 Temperature 26.1
Cr 2.4 Salinity 0.89
Co 2.7 Turbidity 24.4
Ni 0.97 DO 7.44
Mn 1.4
Cu 0.78
Table 4. The mean values of metals concentration and physicochemical parameter of the water taken during spring season.
Metals Mean of metals Concentration
Physicochemical parameters
Mean of
Physicochemical values
Na 13.2 pH 9.34
Mg 0.46 TDS 904
K 11.6 Conductivity 1870
Ca 2.48 Temperature 26.7
Cr 0.86 Salinity 0.832
Co 2.5 Turbidity 29.23
Ni 0.91 DO 7.14
Mn 1.25
Cu 0.67
Table 5. The correlation between mean metal concentration and physicochemical parameter of the water taken in the winter season.
Correlations - 1
phy.chem values Water metal content phy.chem values
Pearson Correlation 1 0.387
Sig. (2-tailed) 0.391
N 7 7
Water metal content
Pearson Correlation 0.387 1
Sig. (2-tailed) 0.391
N 7 8
Table 6. The correlation between mean metal concentration and physicochemical parameter of the water taken during the spring season.
Correlation - 2
phy.chem values Water metal content phy.chem values
Pearson Correlation 1 0.393
Sig. (2-tailed) 0.383
N 7 7
Water metal content
Pearson Correlation 0.393 1
Sig. (2-tailed) 0.383
N 7 8
4. Discussion
4.1. Physicochemical Parameters of the Water
The water parameter measurements have indicated the variation of the quality of water within the two consecutive seasons. The physicochemical parameter reading taken from Lake Chamo within the two seasons is given in table 1. The reading obtained in winter season showed that, PH of the water ranges in 9.39 - 9.45, total dissolved solids (TDS) 815 -
910 mg/L, conductivity 1746 -1965 µS/cm, temperature 25.5 – 27.6°C, salinity 0.87 - 0.93ppt, turbidity 21.59 - 28.21 NTU and dissolved oxygen (DO) falls in the ranges of 6.37 - 8.24 mg/L. while the data obtained in the next season (spring) have some variation, PH ranges between 9.30 - 9.40, total dissolved solids (TDS) 865 mg/L – 920mg/L, conductivity 1739 - 1960µS/cm, temperature 25.8 - 29°C, salinity 0.81 - 0.87ppt, turbidity 22.59 - 37.21 NTU and dissolved oxygen (DO) in the ranges of 6.27 - 8.24 mg/L. so these difference or variation in the physicochemical parameter measurements of the water of lake Chamo is expected to be the result of seasonal changes.
4.1.1. pH(Acidity or Alkalinity)
The water pH value is determined by the relative concentrations of H+ ion and OH- ion. Water with a pH of 7 has equal concentrations of H+ ion and OH- ion and is considered to be a neutral solution. If a solution is acidic (pH <7), the concentration of H+ ion is greater than the concentration of OH- ion. If a solution is basic (pH >7), the concentration of H+ ion is less than the concentration of OH -ion. In this study, the pH value of the lake water is found to be slightly alkaline with the range of 9.43 - 9.45 and 9.30 - 9.43 in dry and wet seasons, respectively. The mean pH values between both seasons showed no significant difference. The pH values measured in both seasons were found above the upper limit defined by WHO guide lines 6.5- 8.5 [11]. The pH was found to have slight variations between stations and seasons. Higher pH may result due to waste discharge, microbial decomposition of organic matter in the water body or may be attributed to sewage discharge by surrounding human population Patil, S. G et al [12]. Rainfall generally has a pH value of 5 to 6.5 which is acidic as a result of dissolved carbon dioxide and air pollutants such as sulphur dioxide or nitrogen oxides. If rainwater flows over soil containing hard water minerals, its pH usually increases. Bicarbonate ions, HCO3-, resulting from limestone deposits
react with water to produce OH- ions according to the reaction given:
HCO3- + H2O—H2CO3- + OH-
This results in lakes often being basic with pH values between 7 and 8, sometimes as high as 8.5. The measure of pH is very important indication of the quality of water due to the sensitivity of organisms to the pH of their environment. Small changes in pH can affect the existence of biological life and most of them thrive in a quite narrow and critical pH range. The table below shows pH effect on aquatic life.
4.1.2. Temperature, Total Dissolved Solids (TDS) and Conductivity
and spring, respectively which is similar to previous studies, Yosef T. G and Eyasu shumbolo [13, 14]. In both seasons, the least temperature was recorded at the center of the lake which has maximum depth. Shade is important to the health of the water body as it reduces the warming effect of direct sunlight. The study showed as the temperature of the lake slightly exceeds the permissible limit 24°C - 28°C [15]. Some human activities removed shade trees from the area, allowing more sunlight to reach the water, causing temperature to rise. Temperature of air above the water body may affect water temperature depending on the depth of the water. Shallow water bodies are more susceptible to temperature changes than deep water. The increment in the lake water temperature will affect solubility of dissolved oxygen. More gas can be dissolved in cold water than warm; therefore animals requiring a high level of dissolved oxygen will only thrive in cold water. Increased water temperature can cause an increase in the photosynthetic rate of aquatic plants and algae, which can lead to increased plant growth and algal blooms, and harm the local ecosystems, Metabolic rate of organisms and Resistance in organisms if water becomes too hot or too cold, organisms become stressed, lowering their resistance to pollutants, diseases and parasites. Solids are found in streams in two forms, suspended and dissolved form. Dissolved solids in freshwater samples include soluble salts that yield ions such as sodium (Na+), calcium (Ca2+), magnesium (Mg2+), bicarbonate (HCO3–), sulfate (SO42– ), or chloride (Cl–). The TDS concentration in a body of water is affected by many different factors. A high concentration of dissolved ions is not, by itself, an indication that a stream is polluted or unhealthy. It is normal for water bodies to dissolve and accumulate fairly high concentrations of ions from the minerals in the rocks and soils over which they flow. The present study found the TDS value in ranges from 815 to 910 mg/L and 865 to 920 mg/L in the winter and spring season respectively. Among the sampling stations, the maximum reading was obtained for site centre with values 910mg/L in winter and 920mg/L in spring season. This result exceeds the WHO permissible limit of 500mg/L WHO, 1993[16]. High levels of TDS in water used for drinking purposes may lead to many diseases, Sabata, B. C and Nayar, M. P [17]. As deposits contain salts (NaCl and KCl) or limestone (CaCO3-), significant concentrations of Na+, K+,
Cl– will result, as well as hard-water ions, such as Ca2+ and HCO3– from limestone. TDS is sometimes used as a
“watchdog” environmental test and its values will change when ions are introduced to water from salts, acids, bases, hard-water minerals, or soluble gases that ionize in solution. There are many possible man made sources of ions that may contribute to elevated TDS readings. Fertilizers from fields can add a variety of ions to a stream. Increases in TDS can also result from runoff from roads that have been salted in the winter. TDS values in lakes and streams are typically found to be in the range of 50 to 250 mg/L but in areas of especially hard water or high salinity, TDS values may be 500 mg/L or higher, U.S EPA [15].
Conductivity is a measure of water’s capability to carry an
electric current and also it is a tool to assess the purity of water. Minerals and salts must be dissolved in water in order for it to conduct electricity; as the concentration of dissolved solids increases, so does the conductivity of the liquid. The present investigation found the conductivity of Lake Chamo water in the range of 1746 - 1965 µS/cm and 1739 - 1960 µS/cm in the dry and wet season, respectively. The value is similar to that obtained by eyasu shumbolo et al [14] but much higher than the value reported by earlier work, Ababu teklemariam [2]. The current high conductivity of the lake is also attributable to increased ionic concentration due to evaporative water lose. The wide variations in the conductivity values between seasons could be attributed to the combined influence of sea water intrusion with the flooding tide and influence of fresh water particularly during the rainy season. Among the sites, maximum conductivity reading was recorded for outlet-1 both in the winter and spring which was 1965 and 1960 µS/cm, respectively. The variation between the stations is suggestive for the influence on the lake while the seasonal differences observed for the conductivity which is a clear indication of the role of season in the ionic distribution in the lake. Dissolved solids may originate from a variety of organic and inorganic sources that can be either natural or human derived, such as the degradation of rock or plant matter or agricultural runoff of topsoil. The electrical conductivity measured in Lake Chamo exceeded the values of 1000 µS /cm maximum for fresh water bodies [18]. The high electrical conductivity values in both seasons indicate the presence of high concentrations of total dissolved solid from non-point sources such as municipal effluents.
4.1.3. Salinity, Turbidity and Dissolved Oxygen
Salinity is a measure of the total salt concentration, comprising mostly of Na+ and Cl- ions as well as small quantities of other ions like Mg2+, K+, or SO42-. It is the total
of all non-carbonate salts dissolved in water. In the present study salinity of the lake Chamo ranges from 0.87-0.93 ppt and 0.81- 0.87ppt in the winter and spring season, respectively. Among the stations the maximum salt concentration is recorded at inlet-2, outlet-1 and outlet-2 in the dry season and at inlet-1 in the wet season. Increment in salinity has also been reported by Elzabeth kebede of Chamo in the last four decades [19]. Demeke admasu [20] also reported a salinity level of 1g/L as compared to 0.6g/L of salinity that was measured by Loffredo and Maldura [21]. It is evident that the water has become more concentrated, which might be attributed to high evaporation. The major ions Ca2+, Mg2+,Na+, K+, Cl-, SO42-, HCO3- and CO32- are
essential constituent of water and responsible for ionic salinity as compared with other ions [22].
winter season and 22.59 - 37.21NTU in the spring. The result inferred that Lake Chamo is more turbid in spring season than winter time. Comparatively inlet-1 and inlet-2 showed higher reading in both seasons. The result exceeds the permissible limit of 10 NTU set by BIS 1991 [23]. The turbidity of the lake may increased as a result of Soil erosion, silt and clay deposition, Urban runoff, Industrial waste, sewage treatment effluent; particulates, abundant bottom-dwelling organisms and Organic matter, microorganisms; decaying plants and animals; petrol, diesel or oil from roads. High turbidity decreases the amount of sunlight able to penetrate the water, thereby decreasing the rate of photosynthesis. Reduced clarity also makes the water less aesthetically pleasing, making it less desirable for many water uses. When water is cloudy, sunlight will warm it more efficiently because suspended particles absorb the sunlight, warming the water. This can lead to problems associated with increased water temperature.
Oxygen (O2) is undoubtedly the most important of the
gases, since most aquatic organisms need it to survive. The dissolved oxygen (DO) concentration of lake Chamo water ranged from 6.37mg/L - 8.24mg/L and 6.27mg/L - 8.24mg/L in winter and spring season, respectively. The maximum reading is recorded at the center of the lake with a value of 8.24mg/L in both seasons. Permissible limit of DO is 5mg/L and higher DO values often more than the saturation values were found mostly in the station where more weeds are present and may be due to their photosynthetic activities [24]. Normally high DO was encountered in unpolluted areas while at polluted areas level of DO is very less. Low content of DO assign of organic pollution, it also due to inorganic reluctants like Hydrogen sulfite, Ammonia, Nitrate, ferrous ion and other such oxidisable substances[25]. Farther depletion of DO to the level of anaerobic is the most critical manifestation of pollution. DO was an indicator for organic pollution [26].
4.2. Metal Concentrations in Water
Metals concentration in the water samples taken from Lake Chamo in two seasons from winter 2012/13 to spring 2013, have some variation as there is different water bodies or rivers that drain in to the lake during rainy season. During spring season most rivers that flow in to Lake Chamo will get higher amount of water content as a result of rainfall. This water will carry both organic and inorganic substances that are available in the surrounding. Due to the addition of those substances to the lake, the water characteristics and concentration of essential and trace elements present in the lake will be altered and also the physicochemical properties of the water also has been increased as a consequence of those impurities introduce in to the lake. The values of the concentration of metals in water in the same season vary strongly among the sampling sites. The metal concentrations of the water at five different sampling sites which was calculated from the absorbance given in appendix 3 and 4 are given in table 2. According to this study, the concentration of Na ranges between 18 22, Mg 0.340.97, K 1019, Ca 1.6
-5.5, Cr 0.61- 4.0, Co 1.50-3.8, Ni 0.78-1.10, Mn 1.01– 1.98 and Cu 0.53 -1.20 mg/L in the winter season. But during rainy season of the area ( spring), the concentrations of those metals has been changed, Na ranges in 12- 17.5, Mg 0.51- 0.62, K 10- 13, Ca 1.5- 3.9, Cr 0.60- 1.20, Co 1.50- 3.80, Ni 0.78-1.10, Mn 1.01–1.9 and Cu 0.50- 0.78 mg/L.
The concentration of essential and trace metals in lakes can be varied from season to season which may be due to the tributaries or rivers that drain in to the lake, anthropogenic activities such as industry, agriculture, overgrazing and burning of fossil or the events taking place naturally like volcanic eruption, flood, soil erosion, sediment loading and solution of minerals. As it was explained Lake Chamo has some rivers that drain in to it. Among those sile and kulfo rivers are the main, especially Kulfo River which drains near to the Arbaminch town could have higher water volume as a result of municipal wastes and effluents released to it. The physical, chemical and biological processes occurring permanently in an aquatic environment should be considered to explain the inorganic elements concentration. Dissolved metal ions create turbidity, discoloration of lake water, can precipitate and form bottom sludge. Limits on individual metals are usually based on toxicity levels. Various metals including those which are essential micronutrients are toxic to organisms at their higher concentrations. Normally the free form of the element is potentially toxic to aquatic biota. Complexation with organic ligands significantly reduces their concentration and the adverse effects. Other factors such as pH, salinity and hardness also affect the concentration of free metal ions and thus regulate toxicity. However, several regulatory agencies have specified limits on total metals to provide a sufficient safeguard against possible synergistic effects. This study showed the variation in metal concentration of the water of Lake Chamo from five different sampling sites (inlet-1, inlet-2, center, outlet-1 and outlet-2) within two consecutive seasons’ winter and spring.
4.2.1. Sodium, Potassium, Magnesium and Calcium
In the present study the concentration of Na ranges from 18 to 22 mg/L in winter while in the spring it falls in the ranges of 12 - 17.5 mg/L as it is revealed from the result Table 2. The concentration of Na is increased in winter as the water level of the lake decrease and it is decreased in spring when water size of the lake was increased. Among the sampling sites, the maximum Na concentration is identified in site outlet-1 which has values 22mg/L and 17.5mg/L in winter and spring, respectively. The value obtained from this study lower than the permissible limit of Na 60 - 120mg/L BIS, 1998 [27] and also so lower than reported by Mohamed, H. et al on lake Qarun of Egypt (8.72 g/L) [9]. The higher concentration of sodium limits the biological diversity due to osmotic stress.
respectively. The concentration of K is decreased in the spring due to increase in volume of the lake water. Among the sampling sites, outlet-1 sampling site showed maximum potassium concentration of 19mg/L in the winter while in the spring season, the maximum potassium concentration was observed in the inlet-1, 13 mg/L. This is due to the high water inflow to the lake. The obtained values are greatly lower than reported by Mohamed, H. et al on lake Qarun of Egypt (398mg/L) [9].
Magnesium occurs in all natural waters. It is an essential constituent of chlorophyll. In this study, the concentration of magnesium has shown some variation within the two consecutive seasons. Magnesium acts as a limiting factor for the growth of phytoplankton. The concentration of Mg is in the ranges of 0.34 - 0.97 mg/L in the winter (table 3). In the spring season, the concentration falls in the ranges of 0.33 – 0.62 mg/L. The concentration of magnesium was higher in the winter than spring. Maximum Mg concentration was recorded in the sampling site of inlet-1 during winter and inlet-2 in spring. The presence of high magnesium concentration in water reduces its quality for domestic use. In
the present investigation, the average magnesium concentration (0.76 mg/L) of Lake Chamo water is lower than the standard magnesium concentration (30 mg/L) in lake water, BIS 1998 [27].
The concentration of calcium in water depends on the residence time of the water in calcium rich geological formations. In this investigation the concentration of calcium is seen in the range of 1.6 – 5.5 mg/L and 1.5 to 3.9 mg/L in the winter and spring, respectively. The result depicted that the maximum concentration is obtained in the winter (5.5 mg/L) than the spring season. From all the sampling sites, the maximum concentration is recorded for outlet-1 in the winter while in the spring, maximum calcium concentration is observed for inlet-2. The result of this study falls in the permissible range of 1.0 – 75 mg/L, BIS 1998 [27]. But the obtained value is greatly lower than reported by Mohamed, H. et al on lake Qarun of Egypt (641 mg/L) [9].
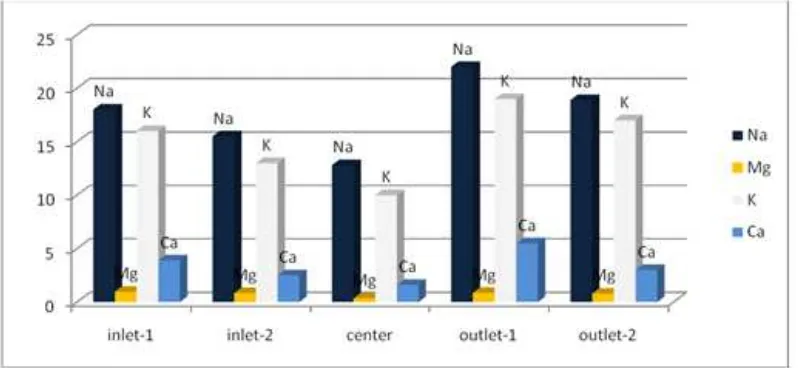
Figure 2 and 3 shows the concentration of Na, Mg, K and Ca in the five sampling sites of water from Lake Chamo within the two consecutive seasons.
Figure 2. The concentratiaon of Na, Mg, K and Ca in the five sampling sites on Lake Chamo water during winter season.
Figure 2 and 3 revealed that the concentration of the metals Na, K, Mg and Ca is higher in the outlet part of the lake in winter season while in spring, the concentration of the metal except Na is higher in the inlet part of the lake indicating as rain water brings those metals to the lake from the surrounding in the form of flood.
4.2.2. Chromium, Cobalt and Nickel
According to the result obtained from this study, the chromium concentration is in the ranges of 0.61 - 4.0 mg/L in the winter season. But in the spring, it falls in the range of 0.60 - 1.20 mg/L. The concentration of chromium in winter is seen higher (4.0 mg/L) in outlet-1 while similar concentration is recorded for sampling sites, inlet-1 and outlet-2 (3.5 mg/L). In the spring season, the higher Cr level is calculated for inlet-1 and outlet-1 with a value of 1.20mg/L. This value is higher than reported by Kebede N. et al on lake Awasa and Ziway (0.20 and 0.129mg/L) and exceeds the permissible limit of WHO, Trivedi and Gurdeep (0.05mg/L) of lake water [29, 30].
Cobalt is an essential constituent as a component of vitamin B12. In the present study the concentration of cobalt
(given in Table 2) is in the ranges of 1.50 mg/L - 3.80 mg/L in both seasons. The overall cobalt concentration of the lake was unchanged but there were some slight changes in concentration among the sampling sites. According to the result, the maximum cobalt concentration is recorded for outlet-1. The result revealed that the concentration of Co in all the sampling sites are almost constant that confirmed there is no external factors that affect the concentration of Co in Lake Chamo. But the result exceeds the permissible limit (0.003mg/L) as WHO set for cobalt.
Nickel is known to be essential nutrient for microorganisms and aquatic life. The result of this study found the concentration of Ni in the range 0.78 -1.10mg/L in both winter and spring season. The higher concentration was calculated for inlet-1 and inlet-2 in the winter while in the
spring the maximum concentration is recorded in inlet-2. The value obtained from this study slightly higher than reported by Öztürk, M. et al [12] on Avsard Dam lake in Turkey (0.0004 to 0.012 mg/L) and also exceeds the permissible limit of WHO (0.02 mg/L) [29].
4.2.3. Manganese and Copper
The result presented in Table 3 revealed the concentration of manganese is higher in the winter season ranges from 1.01 to 1. 98 mg/L than spring and it falls between 1.01 and 1.90 mg/L. The concentration variation of manganese in Lake Chamo within the two consecutive seasons is insignificant. Out of the sampling sites, the maximum concentration is recorded for outlet-2 in both seasons which was 1.98 and 1.90 mg/L, respectively. This is higher than reported by samir
et al in the northern delta lakes, Egypt (0.244 mg/L) and is also exceeds the permissible limit (0.05mg/L) of EPA and WHO [28, 29].
Copper is among the heavy metals which are available in fresh water. The source of these heavy metals in fresh water bodies is mainly through industrial effluent and municipal wastes released to water bodies. In the present study, the concentration of Cu is higher in the spring that ranges from 0.53mg/L to 1.20 mg/L and it falls in the range of 0.50 mg/L - 0.78 mg/L in the spring (table 3). The outlet-1 of the sampling site is recorded the maximum Cu concentration (1.20 mg/L) in the winter time and higher Cu concentration in the spring time is observed for inlet-1 (0.78mg/L). The overall Cu level is higher in the winter time when the water volume decreased. The higher concentration in the station outlet-1 in winter time indicates the movement of the Cu toward the outlet when the volume of the water is higher. This result is higher than reported by samir et al (0.186mg/L) but lower than the WHO permissible limit of 2.0 mg/L [29].
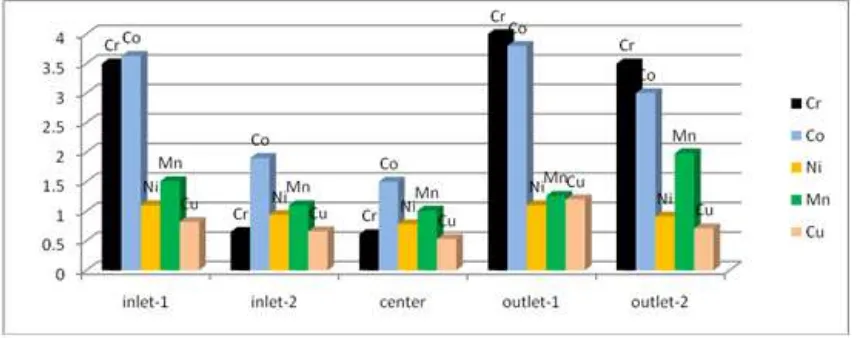
Figure 4 and 5 shows the concentration of Cr, Co, Mn, Ni and Cu in the five sampling sites of water from Lake Chamo within the two consecutive seasons (winter and spring).
Figure 5. The concentration of Cr, Co, Ni, Mn, and Cu in five sampling sites on Lake Chamo water during spring season.
Figure 4 and 5 revealed that the concentration of the metals Cr, Co, Ni, Mn and Cu is higher in the outlet part of the lake both in the winter and spring season. This indicates that there is no significant amount of those metal inter to the lake from the surrounding during rainy season.
4.4. Correlation Between Metal Concentration of the Water and Physicochemical Parameters
4.4.1. Correlation Between Metal Concentration and Physicochemical Parameter of Water Sample Taken in the Winter Season
According to the result given in table 5, the correlation between the mean metal concentration and physicochemical parameters of the water taken in the winter season showed a positive correlation with value of 0.387. The increase in the metal concentration has direct relation with the increase in the physicochemical parameter.
4.4.2. Correlation Between Metal Concentration and Physicochemical Parameter of Water Sample Taken in the Spring Season
The result given in table 6, showed the correlation between the mean metal concentration and mean physicochemical parameter values of water taken in the spring season. The physicochemical parameter values have been increased as the concentration of metals increased which implies the linear relationship of the two values.
5. Conclusions
This study revealed that the physicochemical variables such as temperature, pH, TDS and DO of lake Chamo were slightly above the recommended limit of WHO. The values obtained for TDS, temperature and turbidity of water were higher in the wet (spring) season than dry (winter) season. The pH of this study showed lake Chamo water is alkaline which might have an effect on the bioavailability of dissolved metals. The turbidity of Lake Chamo is higher than
the permissible limit of 10 NTU. Center of the lake showed higher value of DO in both season indicating that the higher the depth the higher would be DO value.
The physicochemical variables have also shown slight variation among the five different sampling sites. Salinity, EC and temperature showed higher values in sampling sites of outlet-1 and outlet-2 in the dry season while in the wet season, EC and temperature revealed higher values in sites of outlet-1 and outlet-2. Salinity is higher in sites outlet-1 and inlet-1. The turbidity of the water is higher in sites inlet-1 and 2 in both seasons and pH reading is higher in sites inlet-1 and inlet-2 in dry season but in the spring season, the higher pH reading is observed for outlet-2 and center. Both TDS and DO showed higher value for sampling sites center and outlet-2 in both winter and spring season. Generally the physicochemical variables obtained from this study indicated that Lake Chamo has slightly shown variation in different season and this might affect the aquatic organism.
The level of dissolved major and trace elements like Na, K and Ca were in the same range with the permissible limit of WHO while the concentration of Cr, Co, Ni, Mn and Cu were slightly higher than the recommended limit. The value of Mg is below the permissible limit of lake water. The metal concentration has shown some variation within the two consecutive seasons. The metal concentration of the lake Chamo water was higher in the winter (dry) season where the level of the water was lower than spring (wet) season in which high rain fall exist.
Appendix
Appendix 1. Absorbance of the Standard Solutions Prepared for Metal Determination in Water Samples.
Metals concentration of standards absorbance
Na
10 0.017
20 0.028
40 0.046
60 0.061
Mg
1 0.518
3 0.661
5 0.782
7 0.892
9 0.988
K
10 0.013
20 0.024
40 0.043
60 0.059
Ca
1 0.005
3 0.009
5 0.013
7 0.017
9 0.019
Cr
1 0.005
3 0.006
5 0.007
7 0.008
9 0.010
Absorbance of the prepared standard solutions
Metals concentration of standards absorbance
Co
1 0.010
3 0.017
5 0.026
7 0.036
9 0.044
Ni
1 0.010
3 0.019
5 0.026
7 0.034
9 0.041
Mn
1 0.044
3 0.087
5 0.125
7 0.180
9 0.222
Cu
1 0.018
3 0.038
5 0.061
7 0.082
9 0.098
**** Concentrations are in ppm
Appendix 2. Absorbance for Water Sample-1.
Metals Absorbance
Inlet-1 inlet-2 center outlet-1 outlet-2
Na 0.028 0.026 0.020 0.031 0.029
Mg 0.57 0.52 0.50 0.54 0.53
K 0.019 0.015 0.013 0.022 0.020
Ca 0.010 0.008 0.006 0.014 0.009
Cr 0.006 0.0053 0.0051 0.0063 0.006
Co 0.015 0.012 0.010 0.0159 0.0155
Ni 0.012 0.011 0.0101 0.014 0.010
Mn 0.050 0.046 0.044 0.049 0.053
Cu 0.013 0.011 0.010 0.020 0.012
Appendix 3. Absorbance for Water Sample-2.
Metals Absorbance
Inlet-1 inlet-2 center outlet-1 outlet-2
Na 0.025 0.024 0.020 0.028 0.027
Mg 0.54 0.57 0.50 0.53 0.52
K 0.015 0.014 0.013 0.014 0.0135
Ca 0.009 0.013 0.005 0.008 0.005
Cr 0.0058 0.0053 0.0050 0.0058 0.0053
Co 0.0130 0.0120 0.010 0.0159 0.0157
Ni 0.010 0.012 0.0101 0.011 0.0109
Mn 0.50 0.049 0.044 0.051 0.052
Cu 0.013 0.0113 0.010 0.012 0.011
References
[1] Kebede, N.; Bhagwan, S.; Chandravanshi and Taddese, W. (2010) Correlation among trace metals in tilapia (Oreochromis niloticus), sediment and water samples of lakes Awassa and Ziway, Ethiopia. Int. J. Biol. Chem. Sci., 4, 1641-1656. [2] Ababu, T. (2005) Water quality monitoring in lake Abaya and
lake Chamo region: A research based on water resources of the Abaya-Chamo basin - South Ethiopia, Ph.D. thesis, Siegen University, Germany.
[3] Essien, D. and Nsikak, U. (2006) Spatio-temporal distribution of heavy metals in sediment and surface water instubbs creek, Nigeria. Trends Applied Sci. Res., 3, 292-300.
[4] Akan, C. J.; Abdulrahman, I. F.; Sodipo, A. O.; Ochanya, E. A. and Askira, K. Y. (2010) Heavy metals in sediments from River Ngada. J. Environ. Chem. Ecotoxicol., 2, 131-140. [5] Rashed, N. M. Biomarkers as indicator for water pollution
with heavy metals in rivers, seas and oceans. Faculty of science, Aswan, south valley University, Egypt.
[6] Frank, M. (2009) Speciation of metals in natural waters. Rosentiel school of marine and atmospheric science, University of Miami, USA.
[7] Öztürk, M.; Özözen, G.; Minareci, O. and Minareci, E. (2009) Determination of heavy metals in fish, water and sediments of avsar dam lake in turkey. Iran J. Environ. Health. Sci. Eng., 6, 73-80.
[8] Indrajit, S.; Ajay, S. and Shrivastava, S. (2011) Study for determination of heavy metals in fish species of the river yamuna (Delhi) by inductively coupled plasma-optical emission spectroscopy (ICP-OES). Adv. Appl. Sci. Res., 2, 161-166.
[9] Mohamed, H. and Mohamed, R. (2005) Accumulation of trace metals in some benthic invertebrate and fish species relevant to their concentration in water and sediment of lake qarun, Egypt. Egypt J. Aqua. Res., 31, 290-301.
[10] Zerihun, D. (2008) Impact of fisheries and water quality changes on the management of Lake Chamo. A thesis submitted for the degree of Master of Science in Environmental science, M. Sc. thesis, Addis Ababa University.
[11] WHO (2004) Guidelines for drinking water quality, 3rd ed., Geneva, Switzerland.
[13] Tekle - Giorgis Y. (2000). Comparative age and growth assessment of the African catfish, clarias gariepinus Burchell (Clariidea) and Nile Perch, Lates niloticus linn. (Centropomidea) in the three southern Rift Valley lakes of Ethiopia, Lake Awasssa, Abaya and Chamo. PhD Thesis, Addis Ababa University, Addis Ababa.
[14] Eyasu Shumbulo, (2005). Phytoplankton biomass in relation to water quality in Lakes Abaya and Chamo, Ethiopia. Arbaminch University, Ethiopia.
[15] U.S. EPA. (U.S. Environmental Protection Agency). 1990. National water quality inventory. 1988 Report to Congress. Office of Water. U.S. Government Printing Office, Washington, D. C., USA.
[16] WHO (World Health Organization) (1993) Guidelines for drinking water quality, recommendation, Geneva: WHO. [17] Sabata, B. C. and Nayar, M. P. (1995) River pollution in india;
a case study of Ganza river, India, 33.
[18] BIS, Indian standard Drinking water Specification, Bureau of Indian Standard, (1990) Indian Standard.
[19] Elizabeth, K. (1996). Phytoplankton in an alkalinity-salinity series of Lakes in the Ethiopian Rift Valley. PhD Thesis, Uppsala University, Uppsala, Sweden.
[20] Demeke, A. (1998) Age and growth determination of tilapia, Oreochromis niloticus L. (Pisces: Cichlidea) in some lakes in Ethiopia. PhD Thesis, Addis Ababa University, Addis Ababa.
[21] FAO: Loffredo and Maldura (1941) Source book for the inland fisheries resource of Africa. 3. Rome.
[22] Wetzel, R. G. and Likens, G. E. (1991) Limnological analysis, 2nd ed; Springer-verlag, New York.
[23] Bureau of Indian standards (BIS) guideline values for drinking water, 1991, India.
[24] Nayak, L. and Behora, D. P. (2004) Seasonal variation of same physic chemical parameters of the Chilika lagoon after opening the new month, India, Mar. Sci., 33, 206-208. [25] Patel, A. C. and Patel, R. S. (2012) Comparison of
physic-chemical parameters of two lakes at Lodra and Nardipurumer biotic stress, Int. J. Sci. Res. Pub., 2, 1-7.
[26] Patra, A. P.; Patra, J. K; Mahapatra, N. K; Das, S. and Swain, G. C. (2010) Seasonal variation in physicochemical parameter of Chilika Lake after opening of new month, Orissa, India, World J. Fish mar. Sci., 2, 109-117.
[27] Bureau of Indian standards (BIS) guideline values for drinking water, 1998, India.
[28] Environmental protection agency, Ireland 2001. Parameters of water quality, interpretation and standards.
[29] WHO (world health organization) standards guidelines for drinking water, 2000.